
Sample Category Title
NZDCAD Wave Analysis
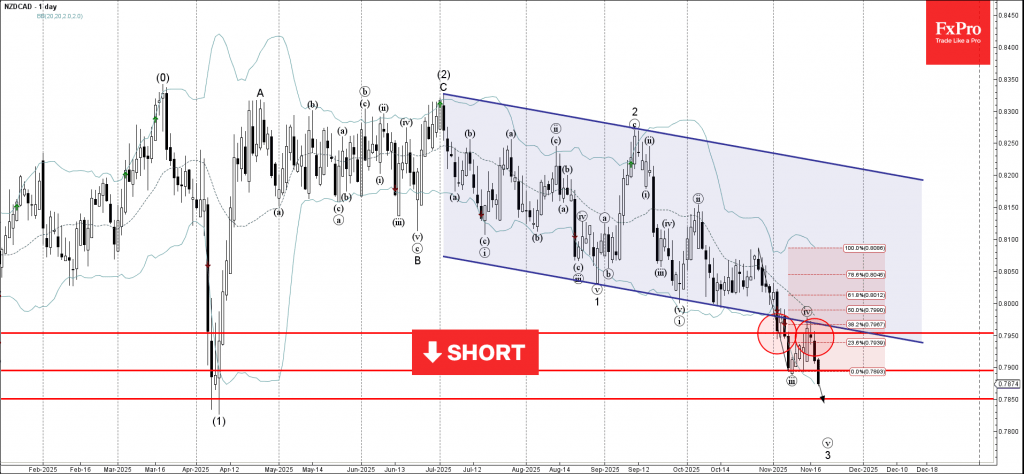
NZDCAD: ⬇️ Sell
- NZDCAD reversed from resistance zone
- Likely to fall to support level 0.7850
NZDCAD currency pair recently reversed down from the resistance zone between the resistance level 0.7950, 20-day moving average and the lower trendline of the recently broken down channel from July.
The downward reversal from this resistance zone accelerated the active impulse wave iii – which belongs to the impulse waves 3 and (3).
Given the clear daily downtrend, NZDCAD currency pair can be expected to fall further to the next support level 0.7850, which reversed the rice sharply in April.
WTI Oil Collapses 3% – Selloff as Ukraine-Russia War Nears Resolution
Some reports from Axios have emitted the possibility of the Russia-Ukraine war going towards a US-led year-end resolution.
Some of this could have been anticipated – Volodymyr Zelenskyy announced yesterday that paths to direct discussion with Russia could reopen and that Ukraine is “preparing to reinvigorate negotiations”.
So the overnight report could just be one of diplomatic progress, in a US attempt to provide a plan similar Peace Plan as the one that was agreed in Gaza. The rest will be to see if both sides actually commit to the discussions.
The direct effect was some imminent selling in Oil and related products, with Black Gold down $1.80 from its highs, or very close to 3%.
An argument could be that the war continuing was also a bearish catalyst, with Russia flooding Markets to sponsor its attacks on Ukraine.
So if the war ends, could supply drastically reduce? Would it necessarily lead to a rebound?
This could be an opportunity to fade the news but will be contingent on many other factors, the most important being positioning and how prices actually move at the news.
So let's take a look at that precisely in a multi-timeframe US Oil (WTI) technical analysis
US Oil (WTI) Technical Analysis
Daily Chart
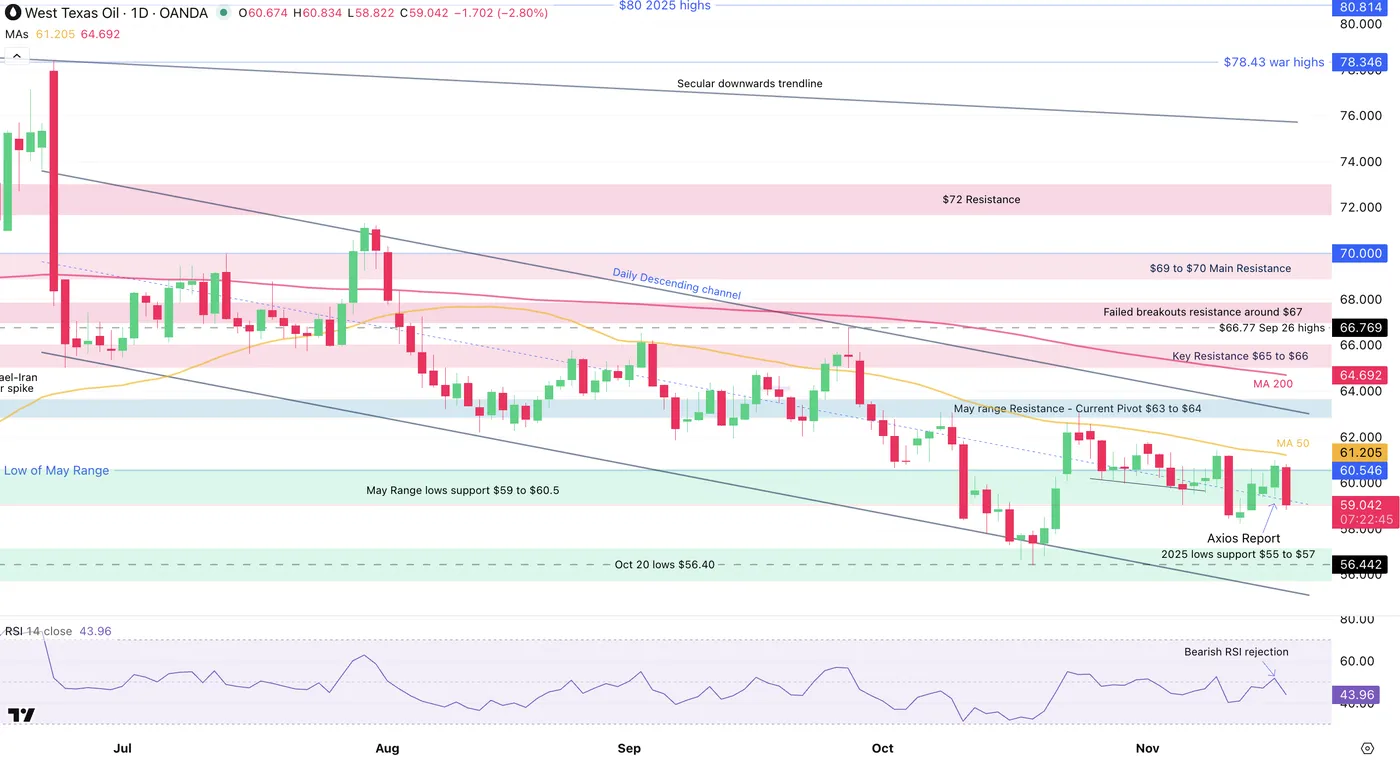
US Oil (WTI) Daily Chart. November 19, 2025 – Source: TradingView
Oil still evolves within its Main Descending Channel formed throughout July and actually hangs around its middle, indicating somewhat of a balance in the price action.
Current trading remains within the May range between $59 and $60.5 that acts as long-timeframe support but also as imminent consolidation zone.
The RSI tilting towards the lower part gives the bears a slight technical advantage, but as long as the Daily Momentum remains above the 40 level, it's still largely considered neutral, implying further rangebound action.
Still remaining in a downwards channel, the action keeps a slight bearish but balanced tilt.
Let's dive deeper in the charts.
4H Chart and technical levels
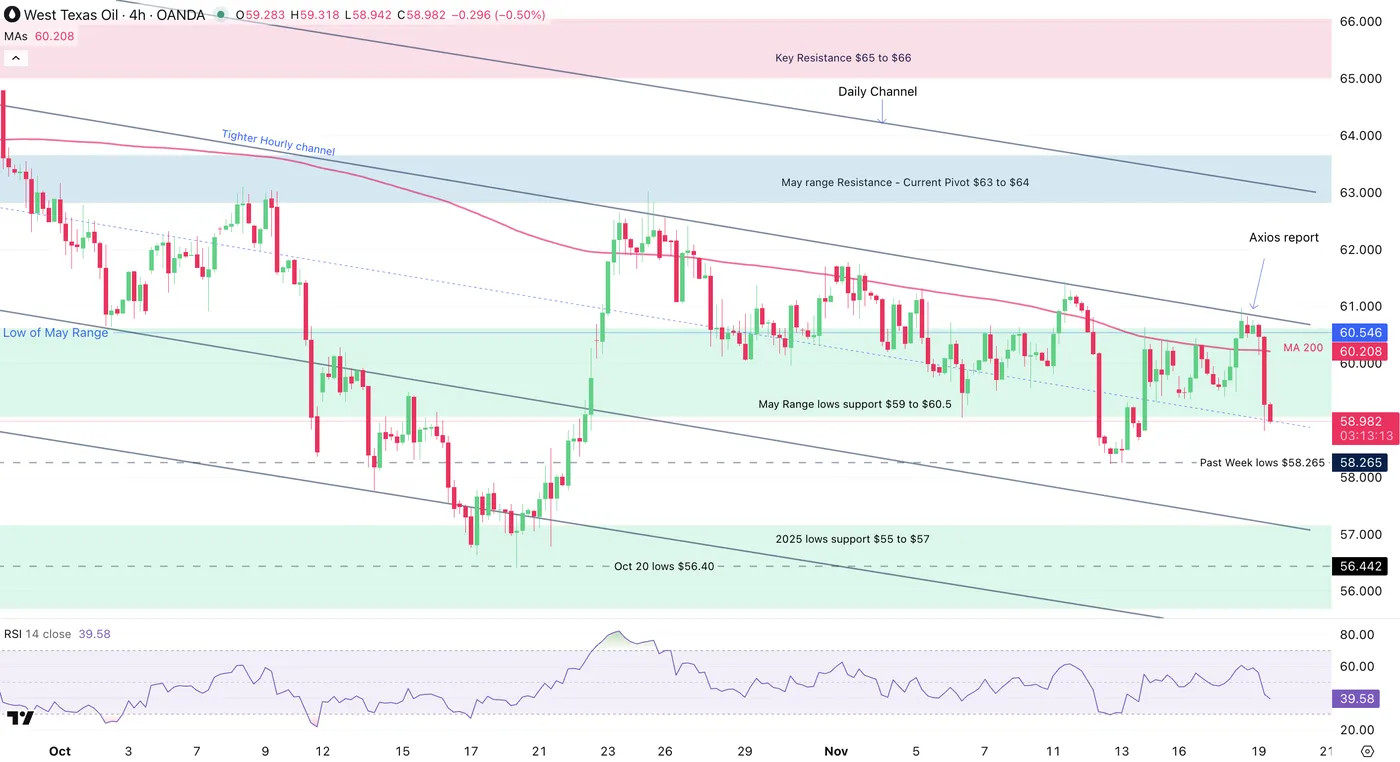
US Oil (WTI) 4H Chart. November 19, 2025 – Source: TradingView
Levels to place on your WTI charts:
Resistance Levels
- Key September Resistance $65 to $66
- Sep High timeframe Pivot $62 to $63
- $60.90 Weekly highs
Support Levels
- $59 to $60.50 2021 Support now Pivot (attempting to break)
- $55 to $57 2025 Support
- Oct 20 lows $56.38
- $57.50 Hourly channel lows
- Past Week lows $58.265
1H Chart
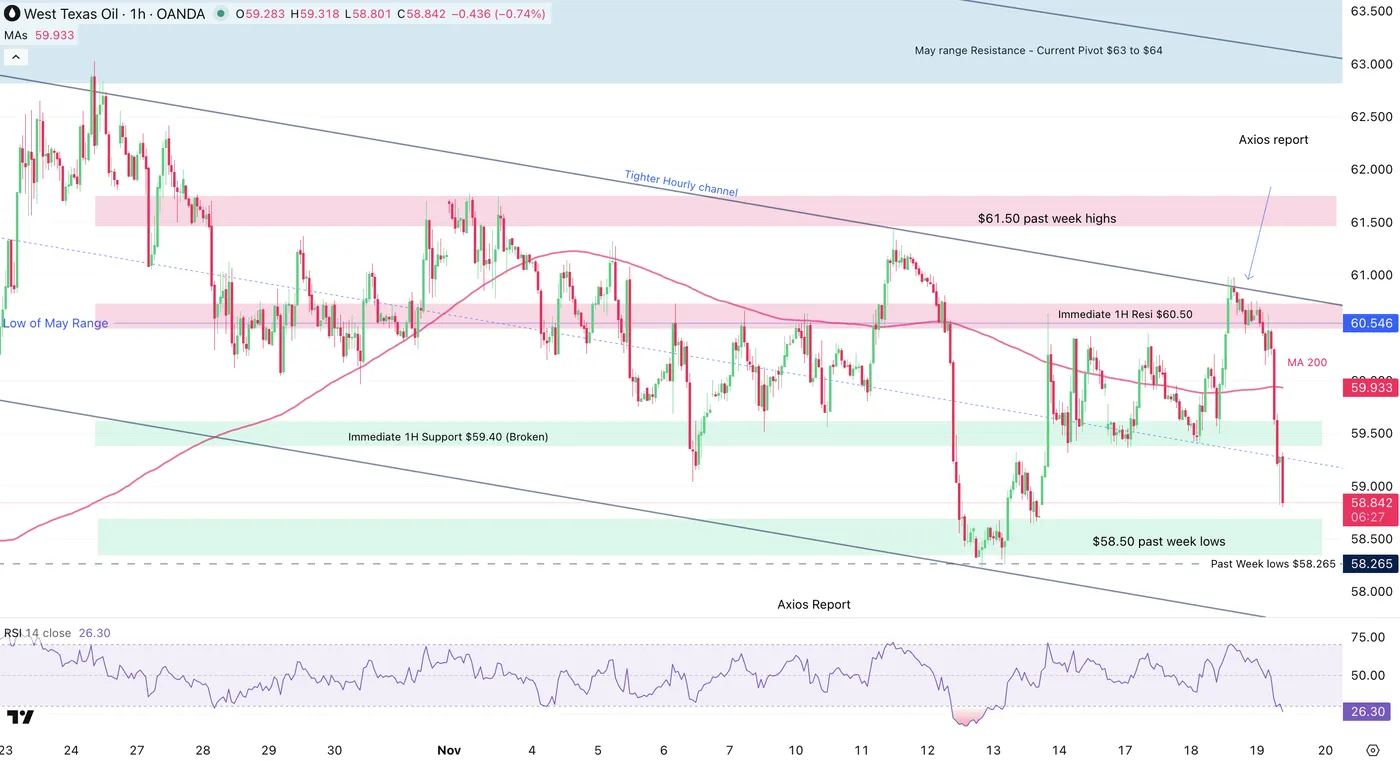
US Oil (WTI) 1H Chart. November 19, 2025 – Source: TradingView
Sellers are making a move to push below the $59 support mentioned on the higher timeframe and could test the previous week lows at $58.56.
Keep an eye on the Hourly channel bounds which tend to act as strong support and resistance levels.
The 1H RSI is coming towards oversold, therefore continuation here would imply that sellers are keeping the short-term hand.
Watch what happens when and if prices reach the past week lows support ($58 to $58.50).
Safe Trades!
Sunset Market Commentary
Markets
One stock to rule them all. Q3 Nvidia earnings are key after market closure tonight. Option markets imply traders are expecting the company’s share price, which has the biggest weighing in the S&P 500, to move by an average of 6.4% in either direction when markets open on Thursday. The earnings report coincides with key European and US equity markets testing first support levels (October lows). Losing those would morph a correction (amongst others over lofty AI valuations) into a more pronounced setback. In the run-up to the release, the EuroStoxx50 in any case avoided a move below 5488. It currently trades 0.33% higher on the day, overcoming 0.50% opening losses. A Politico report suggesting that the White House is on the brink of unveiling a major new peace agreement with Russia that officials say will bring war with Ukraine to an end helps lift spirits with the exception of the defense sector. US stock markets open up to 0.5% higher for Nasdaq. Apart from the Nvidia result, FOMC Minutes of the October policy meeting are also on tap during US hours. They’ll be testament to the highly divided comments from Fed governors which erupted since the second risk management rate cut since restarting the policy normalization cycle lower. They are unlikely to settle or even navigate the debate on the outcome of the December Fed meeting (currently 50/50 split). Thursday’s September payrolls, even though outdated, might in this respect have more market moving potential being the first big government release since the shutdown ended. It was today also announced that US September retail sales will be released November 25.
The Japanese yen is suffering on FX markets. Not only because the new PM’s office is preparing an additional budget rumoured to be double (JPY 25tn) its original and last year’s size, but now also with risk sentiment no longer working as offsetting factor. USD/JPY rallies to its highest level since January today (156.5 from 155.50) with spillover to other USD-crosses. EUR/USD for example slips from the 1.16 handle towards 1.15500. EUR/JPY hits a new all-time high at 181. Sterling is unmoved by this morning’s October CPI numbers which adds to the disinflation thesis. After peaking at 3.8% Y/Y in September, inflation slowed to 3.6% mainly because of energy prices. While it cements a December 25 bps BoE rate cut, sterling has bigger issues on its mind in the form of next week’s Budget.
News & Views
A new proposal by the European Commission aims to reduce digital regulation, considered as over-reaching, poorly defined, complicated and at times even contradictory. Some of the EU’s AI Act are already in effect from August this year with requirements for so-called high-risk AI systems (such as self-driving vehicles) coming into force in the summer of next year. The EC now proposes to push that date forward for as much as 16 months and additionally calls for streamlining the process to report cybersecurity incidents and easing data protection regulations to facilitate the training of AI models. The Commission’s plan builds on suggestions made by former ECB president Draghi in his 2024 report on (waning) European competitiveness.
Delayed August US trade data showed the deficit declining by around a quarter from -$78.2bn to -$59.6bn. The steep drop coincided with a series of import levies that came into effect at the start of that month. Import value fell by 5.1% m/m, one of the largest monthly drops since at least the early nineties. The record -16.2% monthly decline came on the back of US president Trump’s Rose Garden tariff announcement while the other big drops only occurred during crises (2008, 2020). The import reduction was led by nonmonetary gold, a reflection of a big increase in tariffs on Switzerland to 39%, which in the meantime was negotiated down to 15%. Imports of computer accessories and communications equipment also fell. Exports rose a meagre 0.1% m/m.
EUR/JPY Mid-Day Outlook
Daily Pivots: (S1) 179.70; (P) 180.00; (R1) 180.38; More...
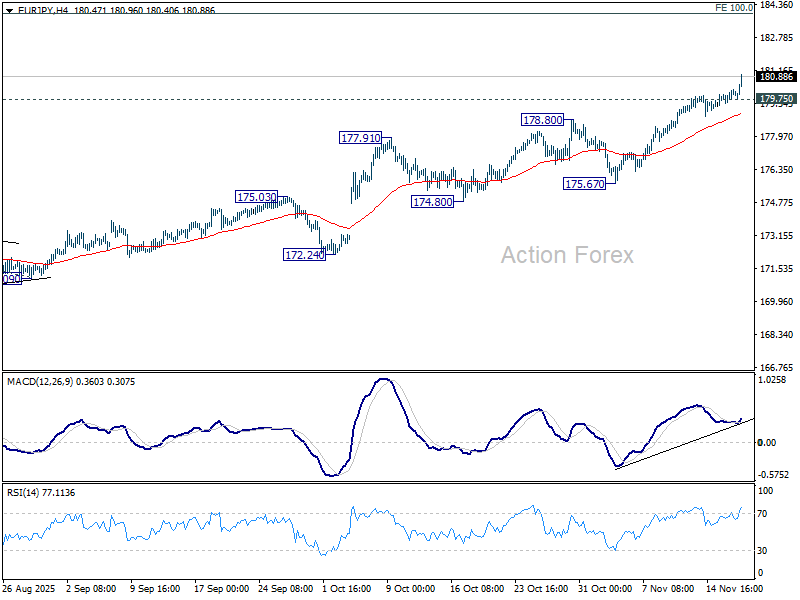
EUR/JPY's rally is in progress and intraday bias stays on the upside for 100% projection of 161.06 to 173.87 from 171.09 at 183.90. Firm break there will target 186.31 projection level next. On the downside, below 179.75 minor support will turn bias neutral and bring consolidations first, before staging another rise.
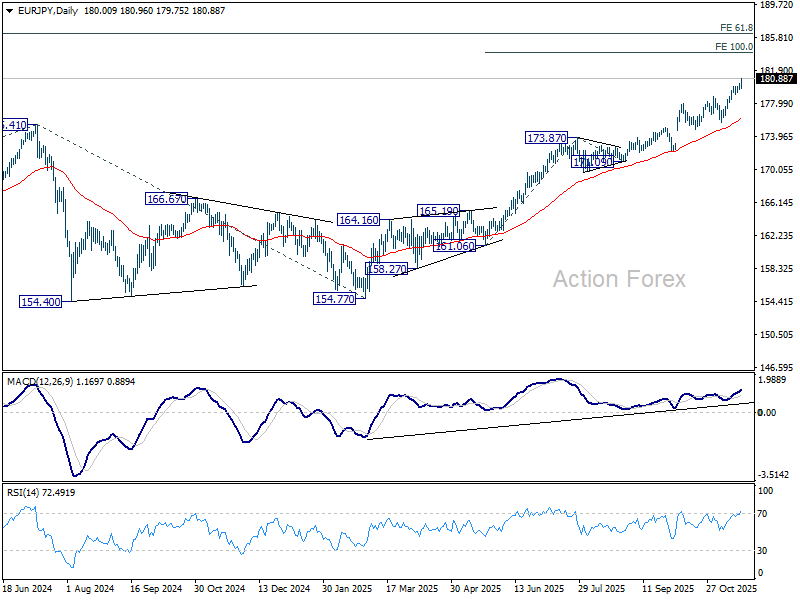
In the bigger picture, up trend from 114.42 (2020 low) is in progress and should target 61.8% projection of 124.37 to 175.41 from 154.77 at 186.31. Outlook will continue to stay bullish as long as 55 W EMA (now at 169.00) holds, even in case of deep pullback.
EUR/USD Mid-Day Outlook
Daily Pivots: (S1) 1.1566; (P) 1.1587; (R1) 1.1603; More…
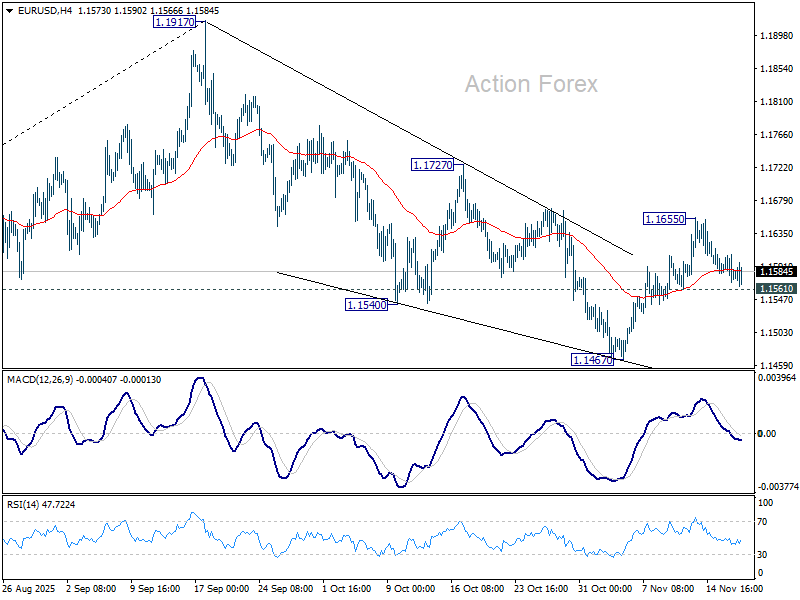
Intraday bias in EUR/USD remains neutral and outlook is unchanged. On the upside, above 1.1655 will affirm the case that fall from 1.1917 has completed as a correction at 1.1467. Bias will be back on the upside for 1.1727 resistance first. However, break of 1.1561 will revive near term bearishness and target 1.1467 low instead.
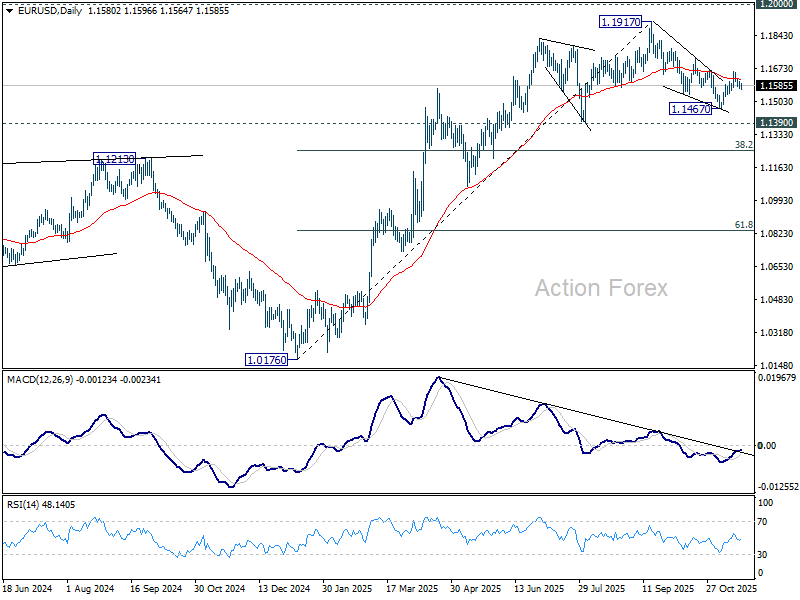
In the bigger picture, considering bearish divergence condition in D MACD, a medium term top is likely in place at 1.1917, just ahead of 1.2 key psychological level. As long as 55 W EMA (now at 1.1328) holds, the up trend from 0.9534 (2022 low) is still in favor to continue. Decisive break of 1.2000 will carry larger bullish implications. However, sustained trading below 55 W EMA will argue that rise from 0.9534 has completed as a three wave corrective bounce, and keep long term outlook bearish.
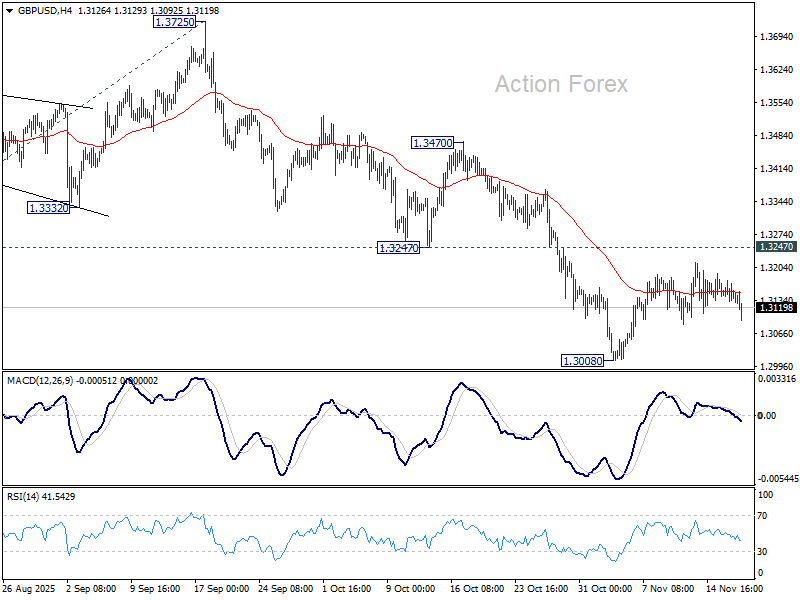
GBP/USD Mid-Day Outlook
Daily Pivots: (S1) 1.3127; (P) 1.3152; (R1) 1.3170; More...
GBP/USD dips mildly today but stays in range above 1.3008. Intraday bias remains neutral at this point. Further decline is expected as long as 1.3247 support turned resistance holds. Break of 1.3008 will resume the fall from 1.3787, and target 138.2% projection of 1.3787 to 1.3140 from 1.3725 at 1.2831. Nevertheless, firm break of 1.3247 will suggest that fall from 1.3787 has completed as a corrective move already.
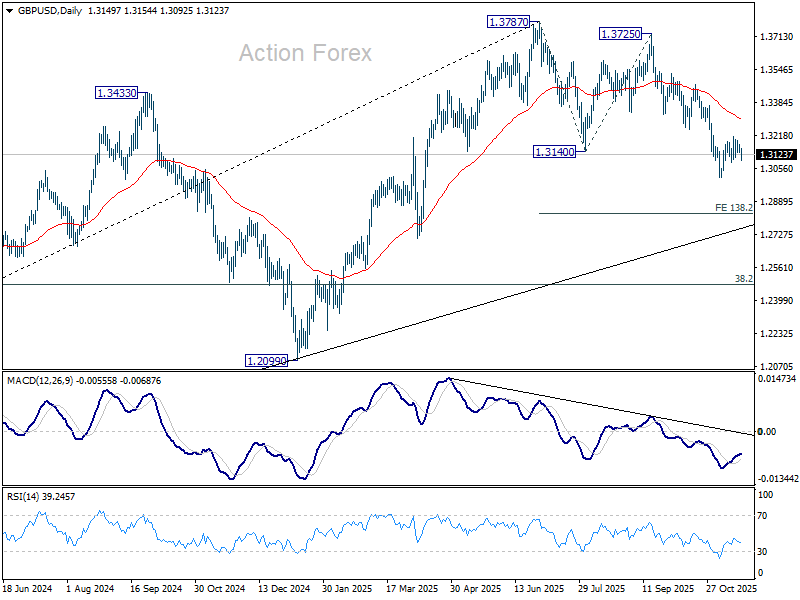
In the bigger picture, the break of 55 W EMA (now at 1.3182) is taken as the first sign that corrective rise from 1.0351 (2022 low) has completed. Decisive break of trend line support (now at 1.2824) will solidify this case and target 38.2% retracement of 1.0351 to 1.3787 at 1.2474 next. Meanwhile, in case of another rise, strong resistance should emerge below 1.4248 (2021 high) to cap upside to preserve the long term down trend.
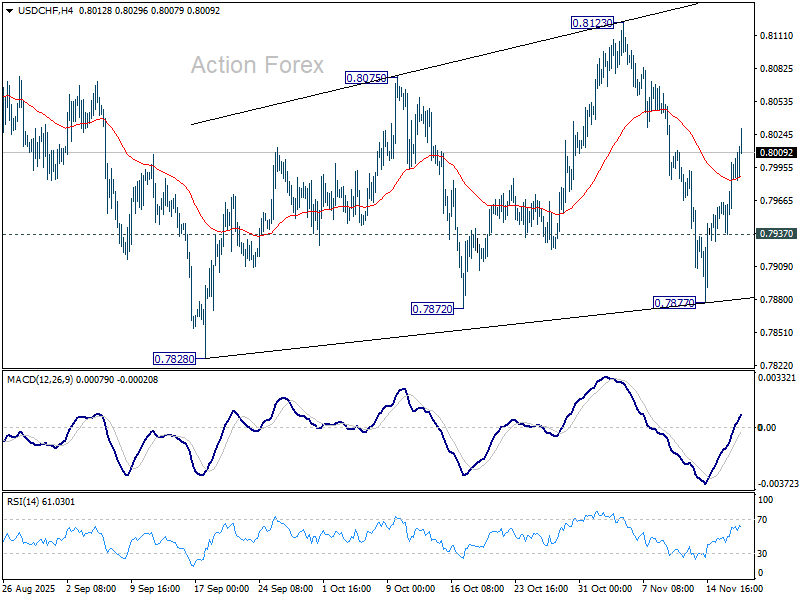
USD/CHF Mid-Day Outlook
Daily Pivots: (S1) 0.7956; (P) 0.7979; (R1) 0.8019; More…
Intraday bias in USD/CHF remains mildly on the upside at this point. Corrective pattern from 0.7828 low is probably extending with another rising leg. Further rally would be seen to 0.8123 resistance. On the downside, below 0.7937 minor support will turn bias neutral first. Break of 0.7877 will bring retest of 0.7828 low.
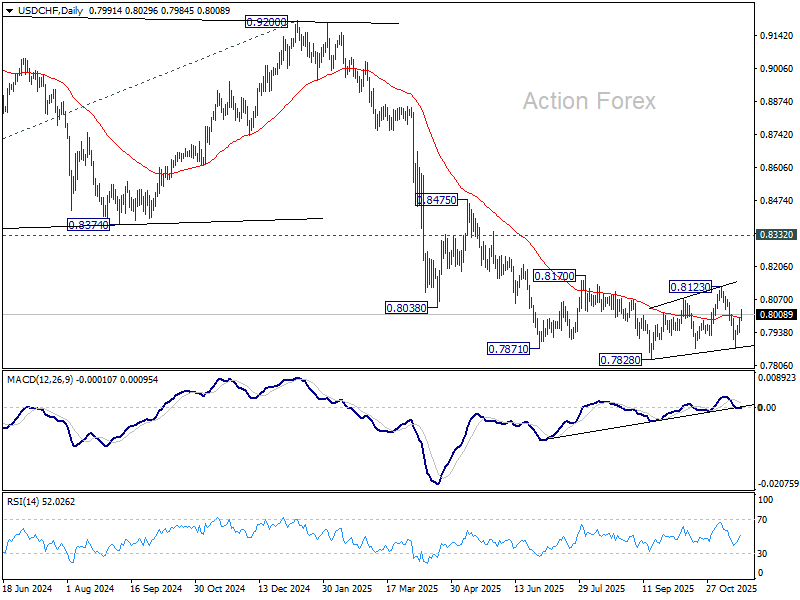
In the bigger picture, long term down trend from 1.0342 (2017 high) is still in progress. Next target is 100% projection of 1.0146 (2022 high) to 0.8332 from 0.9200 at 0.7382. In any case, outlook will stay bearish as long as 0.8332 support turned resistance holds (2023 low).
USD/JPY Mid-Day Outlook
Daily Pivots: (S1) 154.98; (P) 155.36; (R1) 155.89; More...
USD/JPY's rally continues today and breaks above 100% projection of 146.58 to 153.26 from 149.37 at 156.05. There is no sign of topping yet and the break of medium term rising channel indicates upside acceleration. Intraday bias stays on the upside. Next target is 158.85 key structural resistance, and then 161.8% projection at 160.17. On the downside, below 155.20 minor support will turn intraday bias neutral and bring consolidations, before staging another rise.
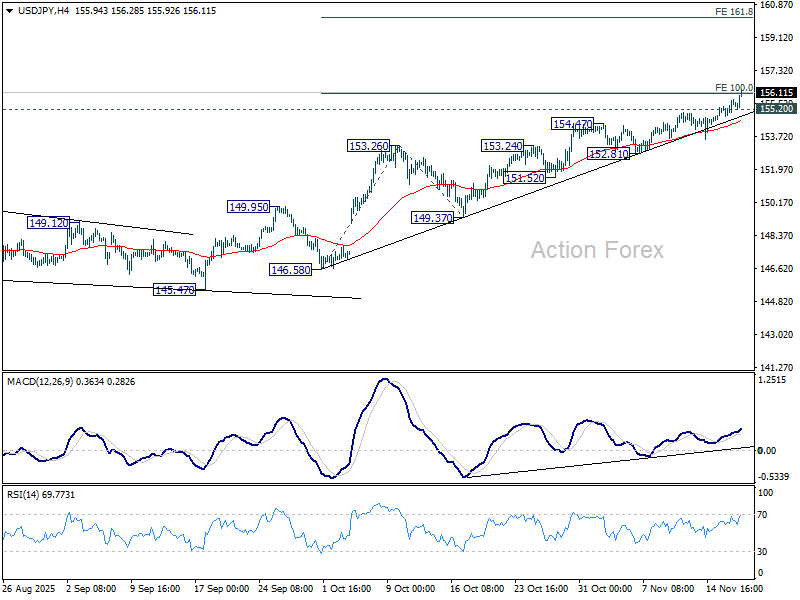
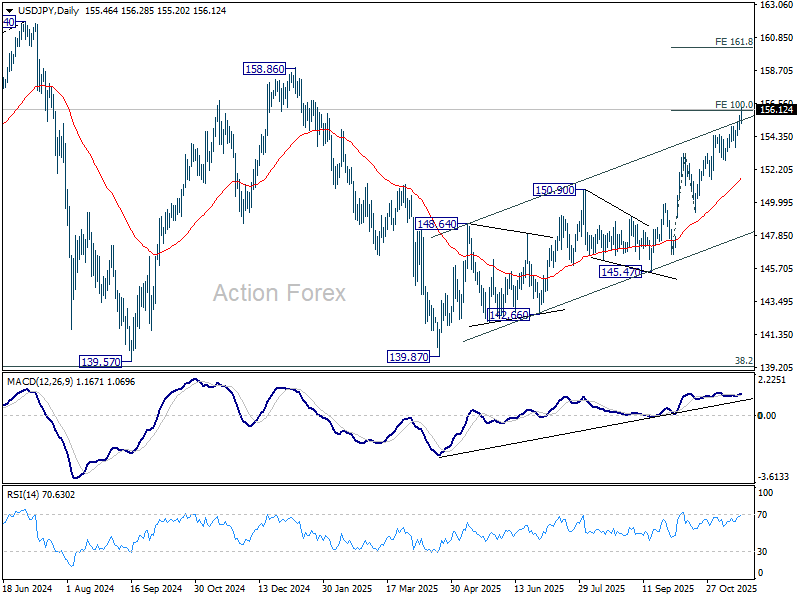
In the bigger picture, current development suggests that corrective pattern from 161.94 (2024 high) has completed with three waves at 139.87. Larger up trend from 102.58 (2021 low) could be ready to resume through 161.94 high. On the downside, break of 150.90 restiveness turned support will dampen this bullish view and extend the corrective pattern with another falling leg.
Yen Extends Losses as Japan Floats Tweak to 2013 BoJ Framework
Yen’s selloff accelerated again today despite repeated warnings from top Japanese officials that they are monitoring FX markets with a “strong sense of urgency.” The latest remarks came after Finance Minister Satsuki Katayama met BoJ Governor Kazuo Ueda and Economic Revitalisation Minister Minoru Kiuchi, where all sides reaffirmed their commitment to the 2013 joint agreement to achieve 2% inflation.
Yet markets latched on to Katayama’s admission that she has proposed a technical tweak to the joint agreement while keeping substantial elements intact. Any hint of modification is noteworthy. The original 2013 statement—signed under intense pressure from then-Prime Minister Shinzo Abe—called on the BoJ to achieve its 2% inflation target “at the earliest date possible” and committed both sides to defeating deflation. That language remained unchanged even after inflation has exceeded 2% for more than three years.
What the tweak entails is still unclear, but investors see it through the lens of Prime Minister Sanae Takaichi’s clear pro-growth agenda and her administration’s resistance to any rapid tightening. A revised framework that places greater emphasis on supporting the economy—or softens the urgency around 2%—could effectively tie the BoJ’s hands and delay the next rate hike.
Yen bears also remain emboldened by expectations that Takaichi will deliver a massive fiscal package underpinned by ultra-low borrowing costs. Kyodo reported this week that the stimulus could exceed JPY 20 trillion, funded largely through an extra budget of around JPY 17 trillion. While Katayama said no final decision on size has been made, the political direction is clear: Tokyo wants growth first, tightening later.
Sterling, meanwhile, is holding steady after slightly stronger-than-expected headline UK inflation. But the details still show price pressures peaked in September at levels below the BoE’s own projections. That keeps a December rate cut firmly on the table, with swaps pricing around an 80% probability. Friday’s October retail sales and November PMIs are expected to reinforce the slowdown narrative.
The Autumn Budget next week remains the final catalyst. Markets will watch closely for clarity on whether tax measures will be deployed to plug the fiscal gap—an outcome that could shape the BoE’s path beyond December.
In the broader currency space so far today, Euro is the strongest performer, followed by Dollar and Loonie. Kiwi sits at the bottom, followed by Yen and Aussie, while Sterling and Swiss Franc are trading mid-pack.
In Europe, at the time of writing, FTSE is down -0.06%. DAX is up 0.22%. CAC is flat. UK 10-year yield is up 0.003 at 4.560. Germany 10-year yield is down -0.018 at 2.689. Earlier in Asia, Nikkei fell -0.34%. Hong Kong HSI fell -0.38%. China Shanghai SSE rose 0.18%. Singapore Strait Times rose 0.01%. Japan 10-year JGB yield rose 0.023 to 1.772.
Eurozone CPI finalized at 2.1%, services lead price pressure
Eurozone CPI was finalized at 2.1% yoy in October, edging down from September’s 2.2% and keeping headline inflation close to the ECB’s target. Core CPI held steady at 2.4% yoy, unchanged from the previous month.
Services remained the dominant driver of inflation in Eurozone, contributing +1.54 percentage points, followed by food, alcohol and tobacco at +0.48 pp, while energy once again exerted a mild drag by -0.08pp.
Across the EU, inflation softened slightly to 2.5% yoy from September’s 2.6%. Price dynamics continued to diverge sharply across member states: Cyprus recorded the lowest annual rate at 0.2%, followed by France (0.8%) and Italy (1.3%). At the other end of the spectrum, Romania remained an outlier at 8.4%, with Estonia (4.5%) and Latvia (4.3%) also posting elevated readings. Compared with the previous month, inflation eased in fifteen member states, held steady in three, and increased in nine.
UK CPI slows to 3.6%, keeping BoE on track for December cut
UK inflation eased in October, with headline CPI slowing from 3.8% yoy to 3.6%, just above the market’s 3.5% forecast. Core inflation (excluding energy, food, alcohol and tobacco) matched expectations at 3.4% yoy, down from 3.5% previously.
Goods inflation cooled, slipping from 2.9% yoy to 2.6%, while services inflation—still the stickiest component—eased from 4.7% to 4.5%.
On a monthly basis, headline CPI rose 0.4% mom.
The figures point to steady, gradual deceleration rather than sharp disinflation, leaving the BoE’s December cut narrative largely intact. Markets are unlikely to adjust pricing meaningfully until the Autumn Budget clarifies the fiscal stance. For now, the data reinforces a picture of easing, but not yet subdued, domestic price pressures.
Australia wage price index rises 0.8% qoq in Q3, private sector underperforms
Australia’s wage price index rose 0.8% qoq in Q3, matching expectations and holding the same pace as Q2. The headline stability masks a mild divergence across sectors: private-sector wages increased 0.7% qoq while public-sector wages climbed 0.9% qoq, continuing their recent outperformance.
On an annual basis, wage growth came in at 3.4% yoy, unchanged from Q2. Public-sector pay rose 3.8% yoy, edging up from last year’s 3.7%. Private-sector wage growth slowed to 3.2% yoy from 3.5% in September 2024. This marks the third consecutive quarter in which public wages have grown faster than their private counterparts.
USD/JPY Mid-Day Outlook
Daily Pivots: (S1) 154.98; (P) 155.36; (R1) 155.89; More...
USD/JPY's rally continues today and breaks above 100% projection of 146.58 to 153.26 from 149.37 at 156.05. There is no sign of topping yet and the break of medium term rising channel indicates upside acceleration. Intraday bias stays on the upside. Next target is 158.85 key structural resistance, and then 161.8% projection at 160.17. On the downside, below 155.20 minor support will turn intraday bias neutral and bring consolidations, before staging another rise.
In the bigger picture, current development suggests that corrective pattern from 161.94 (2024 high) has completed with three waves at 139.87. Larger up trend from 102.58 (2021 low) could be ready to resume through 161.94 high. On the downside, break of 150.90 restiveness turned support will dampen this bullish view and extend the corrective pattern with another falling leg.