Sample Category Title
GBP/JPY Daily Outlook
Daily Pivots: (S1) 203.87; (P) 204.31; (R1) 204.92; More...
GBP/JPY's rally is still in progress and intraday bias stays on the upside for 205.30 resistance. Firm break there will resume whole rise from 185.43 and target 208.09 high. For now, further rise is expected as long as 102.31 support holds, in case of retreat.
In the bigger picture, price actions from 208.09 (2024 high) are seen as a corrective pattern which might have completed at 184.35. Firm break of 208.09 high will resume the up trend from 123.94 (2020 low). Next target is 61.8% projection of 148.93 to 208.09 from 184.35 at 220.90. However, decisive break of 197.47 support will dampen this view and extend the corrective pattern with another fall.
Yen Fails to Rally in Risk-Off Trade as BoJ Hike Slips Further Out
Risk-off sentiment continues to drive global markets this week, but the traditional safe-haven Yen is gaining little traction from the turbulence. The currency’s inability to capitalize on the broad defensive tone reflects an overriding theme: expectations that the BoJ’s long-awaited rate hike will be pushed back once again.
Political pressure from the new government has already all but ruled out a move in December. However, the market’s base case of a January hike is now being questioned too. Former BoJ board member Goushi Kataoka, who now serves on Prime Minister Sanae Takaichi’s flagship economic panel, openly urged the central bank to wait even longer.
Kataoka argued it would be “premature” for the BoJ to lift rates to 0.75% in December or January and said the central bank should wait until March or April. He stressed the need for policymakers to assess the impact of the government’s upcoming stimulus package—expected to exceed JPY 20 trillion, according to Kyodo—and to gather more information on next year’s wage negotiations. His comments carry weight given his history as one of the most dovish voices on the BoJ board from 2017 to 2022.
The timing debate will get fresh attention today as BoJ Governor Kazuo Ueda meets with key government ministers, including Finance Minister Satsuki Katayama. Markets are watching closely for any subtle signals on how strongly the administration intends to lean on the central bank to avoid premature tightening.
In Europe, UK CPI data is the main macro highlight for the session. Headline inflation is expected to dip from 3.8% to 3.5% in October, with core slipping from 3.5% to 3.4%. Unless there is a major surprise, the release is unlikely to shift expectations for a December BoE rate cut. The real swing factor remains next week’s Autumn Budget, where uncertainty still hangs over whether the government will resort to tax hikes to plug the fiscal shortfall.
The FOMC minutes from the October meeting will be closely parsed too. Markets will look for clues on how close the Fed came to another rate cut, especially with futures now pricing less than 50% chance of easing in December. Still, the biggest catalyst for expectations may be Thursday’s delayed September non-farm payrolls report, now set to land after weeks of data blackout during the government shutdown.
Overall in the currency markets this week, Kiwi is currently the weakest performer, followed by Aussie and then Swiss Franc. At the top of the table sits Loonie, followed by Dollar and then Sterling, while Euro and Yen are holding the middle ground.
In Asia, at the time of writing, Nikkei is down -0.16%. Hong Kong HSI is down -0.70%. China Shanghai SSE is down -0.17%. Singapore Strait Times is down -0.06%. Japan 10-year JGB yield is up 0.013 at 1.762. Overnight, DOW fell -1.07%. S&P 500 fell -0.83%. NASDAQ fell -1.21%. 10-year yield fell -0.010 to 4.123.
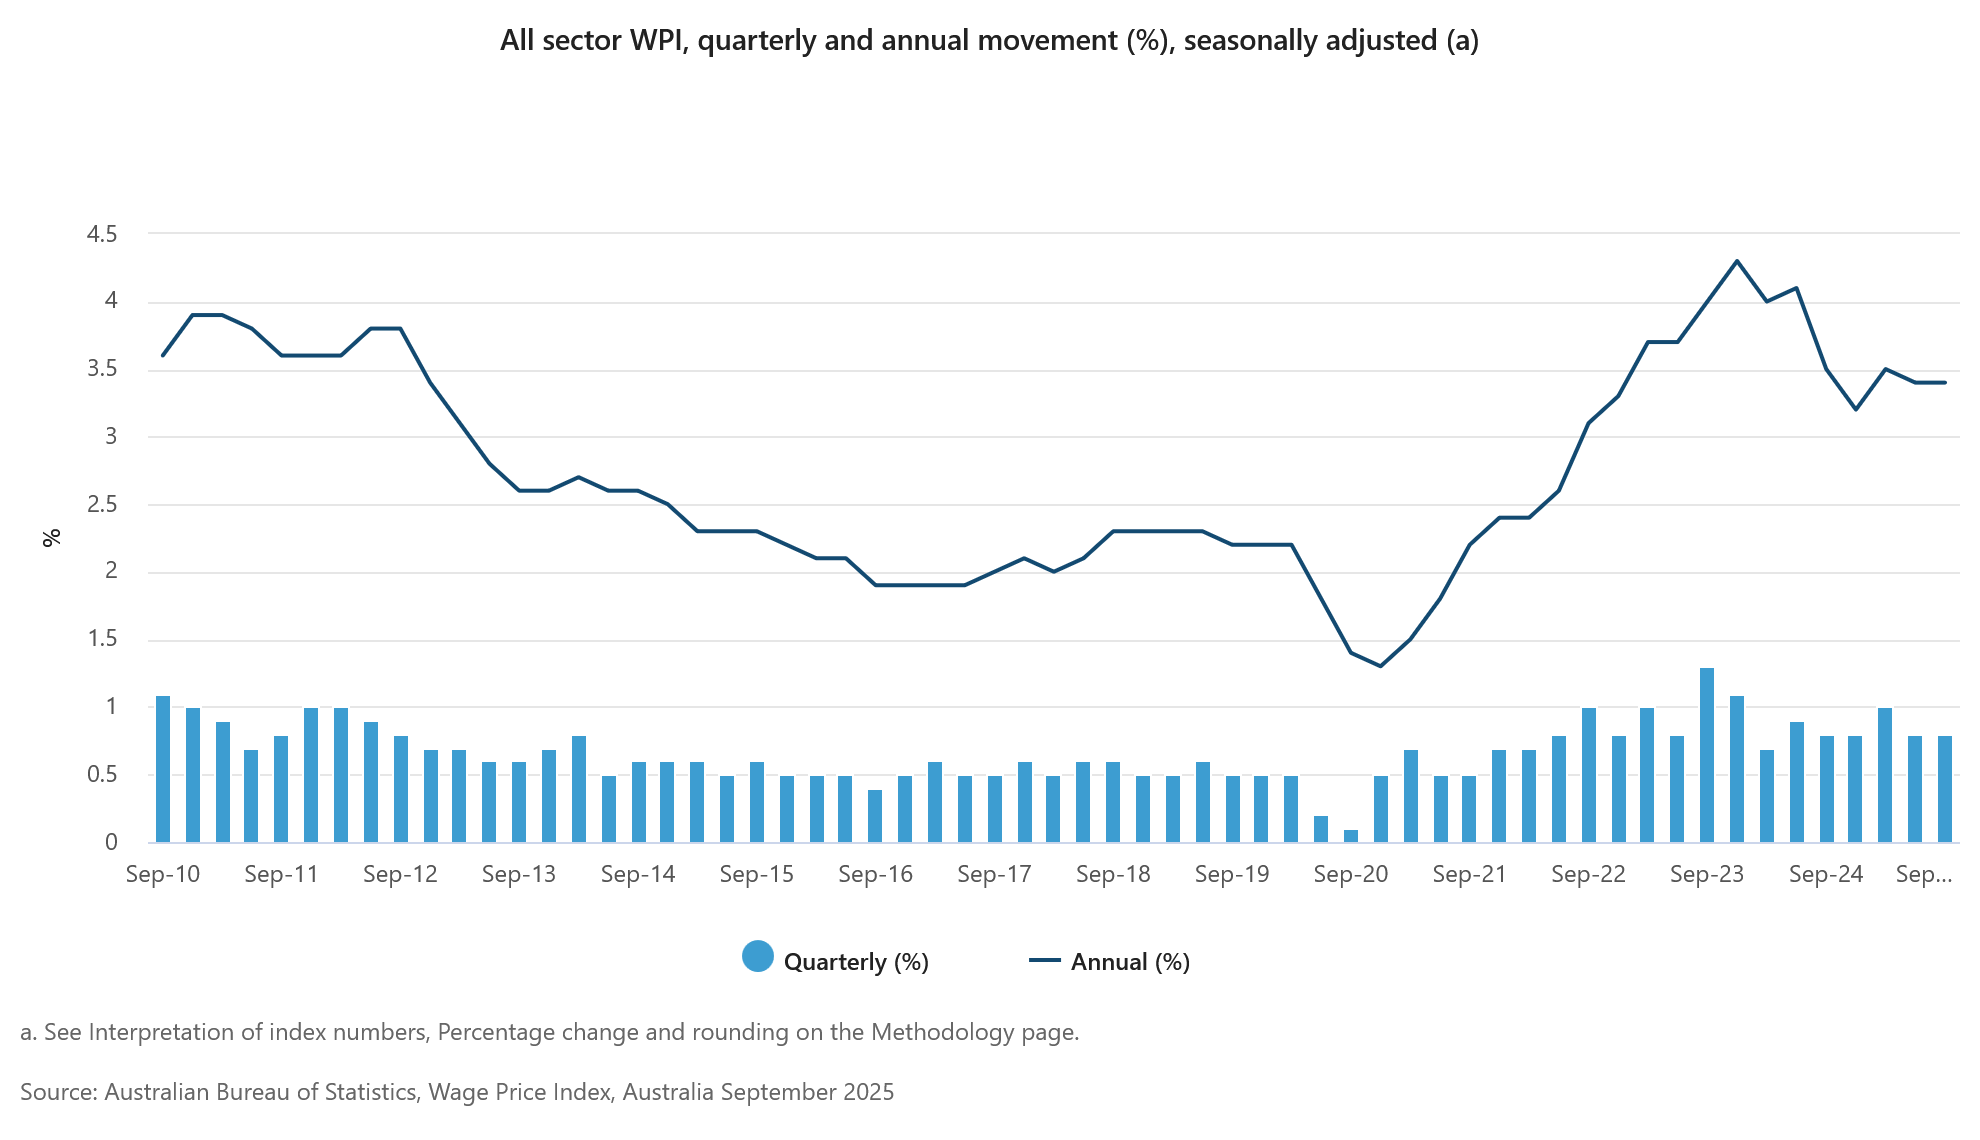
Australia wage price index rises 0.8% qoq in Q3, private sector underperforms
Australia’s wage price index rose 0.8% qoq in Q3, matching expectations and holding the same pace as Q2. The headline stability masks a mild divergence across sectors: private-sector wages increased 0.7% qoq while public-sector wages climbed 0.9% qoq, continuing their recent outperformance.
On an annual basis, wage growth came in at 3.4% yoy, unchanged from Q2. Public-sector pay rose 3.8% yoy, edging up from last year’s 3.7%. Private-sector wage growth slowed to 3.2% yoy from 3.5% in September 2024. This marks the third consecutive quarter in which public wages have grown faster than their private counterparts.
Barkin says Fed flying blind as data blackout ends
Richmond Fed President Thomas Barkin said the U.S. central bank is facing pressure on both sides of its mandate, with inflation still above target and job growth clearly slowing. However, he noted that the picture is not one-directional, as consumers are increasingly resisting price increases while a contraction in labor supply has kept the unemployment rate stable.
Barkin described the Fed’s current environment as akin to “docking a boat at night without a lighthouse,” highlighting the difficulty of judging policy in the absence of timely government data during the shutdown. The upcoming release of delayed reports, he said, will offer much-needed clarity on both inflation and labor market dynamics.
“I think we have a lot to learn between now and then,” Barkin added, suggesting that the December decision remains highly data-dependent as policymakers wait for the first full set of figures since the government reopened.
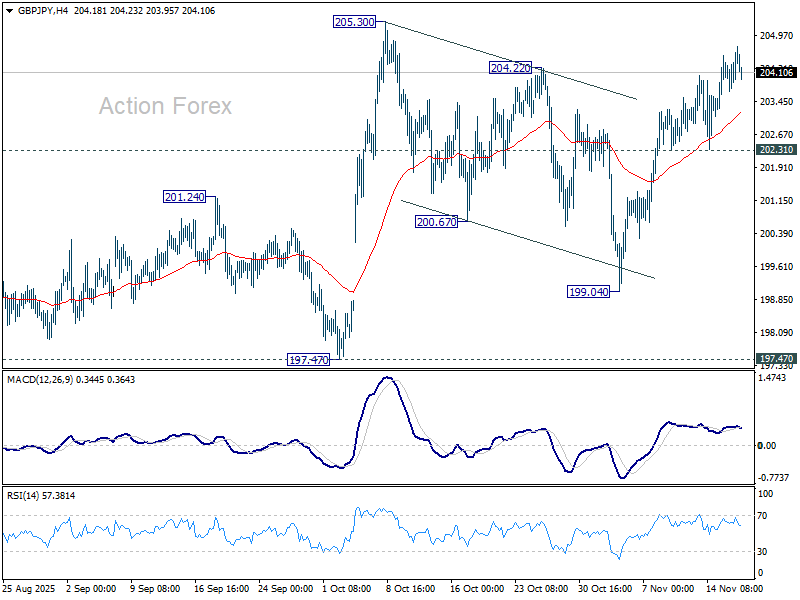
GBP/JPY Daily Outlook
Daily Pivots: (S1) 203.87; (P) 204.31; (R1) 204.92; More...
GBP/JPY's rally is still in progress and intraday bias stays on the upside for 205.30 resistance. Firm break there will resume whole rise from 185.43 and target 208.09 high. For now, further rise is expected as long as 102.31 support holds, in case of retreat.
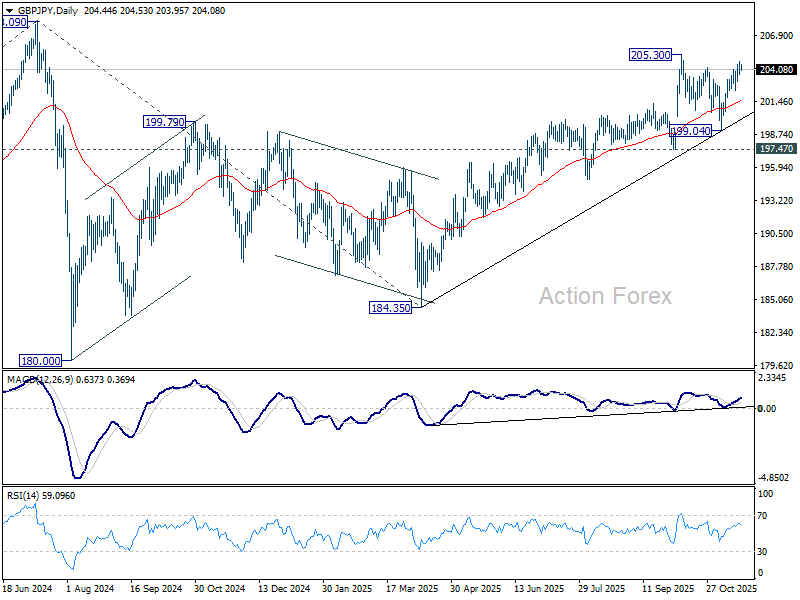
In the bigger picture, price actions from 208.09 (2024 high) are seen as a corrective pattern which might have completed at 184.35. Firm break of 208.09 high will resume the up trend from 123.94 (2020 low). Next target is 61.8% projection of 148.93 to 208.09 from 184.35 at 220.90. However, decisive break of 197.47 support will dampen this view and extend the corrective pattern with another fall.
GBP/USD Aims Higher Ahead of Key UK CPI Report Release
Key Highlights
- GBP/USD started a recovery wave above 1.3100.
- A major bearish trend line is forming with resistance at 1.3165 on the 4-hour chart.
- EUR/USD is consolidating above the 1.1565 support.
- The UK CPI could increase 3.5% in Oct 2025 (YoY).
GBP/USD Technical Analysis
The British Pound found support at 1.3000 and started a recovery wave against the US Dollar. GBP/USD climbed above 1.3050 and 1.3085.
Looking at the 4-hour chart, the pair settled above 1.3100 and the 23.6% Fib retracement level of the downward move from the 1.3471 swing high to the 1.3009 low. The pair tested the 100 simple moving average (red, 4-hour).

On the upside, the pair faces resistance near the 1.3170 zone. There is also a major bearish trend line forming with resistance at 1.3165. The first key hurdle sits at 1.3200. A close above 1.3200 might send the pair higher toward 1.3240 and the 50% Fib retracement level of the downward move from the 1.3471 swing high to the 1.3009 low.
The next resistance could be 1.3290 and the 200 simple moving average (green, 4-hour). Any more gains could set the pace for a steady increase toward 1.3350.
On the downside, there is a key support at 1.3110. The next support is 1.3080, below which the pair could start a steady decline to 1.3000. A close below 1.3000 could start a pullback toward 1.2850. Any more losses might open the doors for a test of 1.2740.
Looking at EUR/USD, the pair started a recovery wave above 1.1600 and now faces tough resistance near 1.1650.
Upcoming Key Economic Events:
- UK Consumer Price Index for Oct 2025 (YoY) – Forecast +3.5%, versus +3.8% previous.
- UK Core Consumer Price Index for Oct 2025 (YoY) – Forecast +3.4%, versus +3.5% previous.
Australia wage price index rises 0.8% qoq in Q3, private sector underperforms
Australia’s wage price index rose 0.8% qoq in Q3, matching expectations and holding the same pace as Q2. The headline stability masks a mild divergence across sectors: private-sector wages increased 0.7% qoq while public-sector wages climbed 0.9% qoq, continuing their recent outperformance.
On an annual basis, wage growth came in at 3.4% yoy, unchanged from Q2. Public-sector pay rose 3.8% yoy, edging up from last year’s 3.7%. Private-sector wage growth slowed to 3.2% yoy from 3.5% in September 2024. This marks the third consecutive quarter in which public wages have grown faster than their private counterparts.
Barkin says Fed flying blind as data blackout ends
Richmond Fed President Thomas Barkin said the U.S. central bank is facing pressure on both sides of its mandate, with inflation still above target and job growth clearly slowing. However, he noted that the picture is not one-directional, as consumers are increasingly resisting price increases while a contraction in labor supply has kept the unemployment rate stable.
Barkin described the Fed’s current environment as akin to “docking a boat at night without a lighthouse,” highlighting the difficulty of judging policy in the absence of timely government data during the shutdown. The upcoming release of delayed reports, he said, will offer much-needed clarity on both inflation and labor market dynamics.
“I think we have a lot to learn between now and then,” Barkin added, suggesting that the December decision remains highly data-dependent as policymakers wait for the first full set of figures since the government reopened.
Gold (XAU) and Silver (XAG) Send Mixed Signals to Doubtful Traders
Markets are getting rocked up and down across asset classes lately.
- Cryptos are getting sold off aggressively (Is the selling done or is it only a first wave?).
- Equities are seeing some record volatility compared to the past few years in frantic +1% up and down moves, as can be seen today.
Even Metals are failing to gather traction after reaching some new records towards the end of last month.
They are holding relatively well compared to the other asset classes that performed great throughout 2025, but the fact that they can't seem to attract inflows during high-range risk-off profit-taking points to a deeply confused market.
The dominant 2025 trend of Stocks, Cryptos, and Metals rallying simultaneously is what has been broadly called the Debasement Trade (a trade rooted in the debasement of the US Dollar and fiat currencies in general).
But when all these anti-fiat assets fall at the same time, what is truly happening?
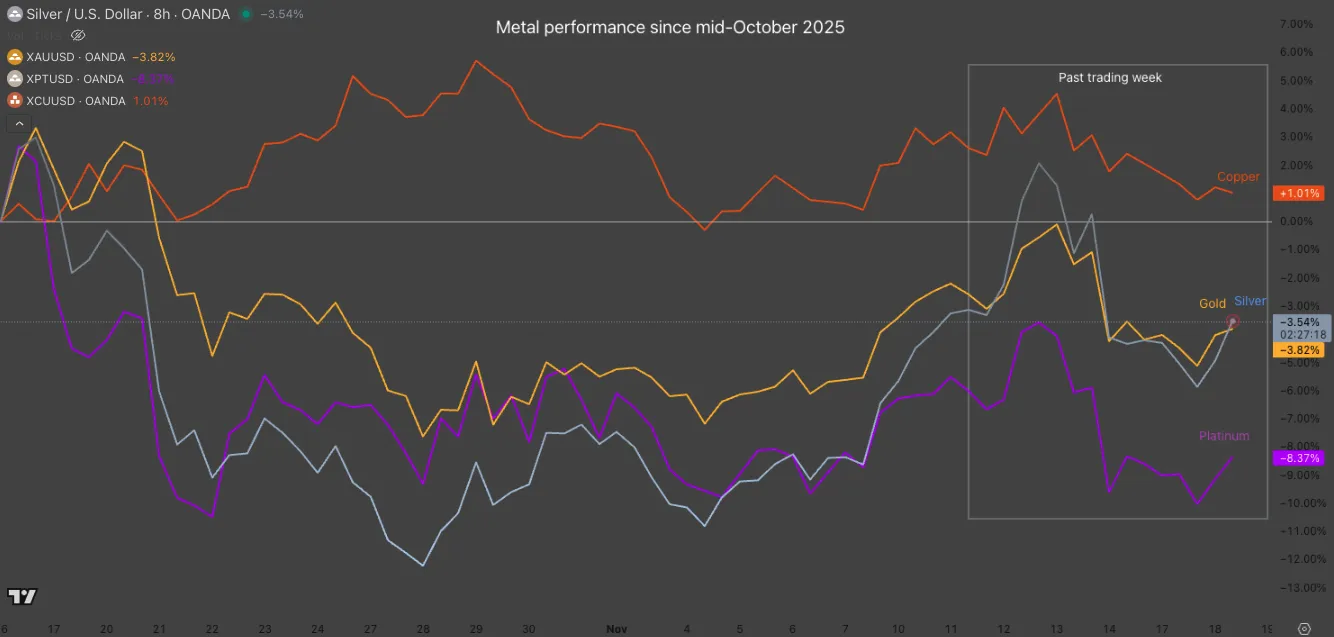
Metal Performance since Mid-October 2025. November 18, 2025 – Source: TradingView
Bank of America has sent out warnings on dangerously low cash levels, which usually doesn't rhyme well with risk asset performance (or any asset, except Treasury bonds).
This flow could signal the start of a trend where massive profit-taking and position closing—a potential Re-basement Trade (contrary to the debasement trade)—takes hold.
In the waiting for such developments to happen (or not), let's dive into two timeframe charts for Gold (XAU/USD) and Silver (XAG/USD) to spot what key levels can come into play for upcoming trading.
Gold maintains its triangle formation
Gold (XAU/USD) Daily Chart
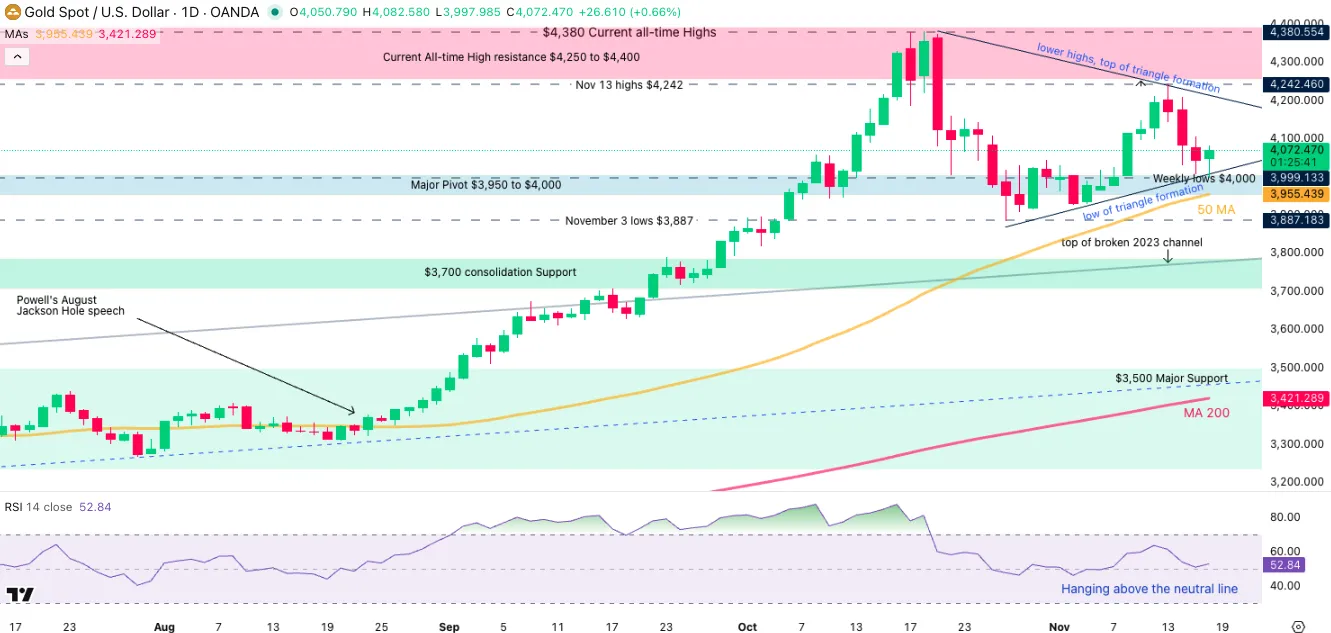
Gold (XAU) Daily Chart, November 18, 2025 – Source: TradingView
Gold has been holding its triangle formation (mentioned in our recent Gold analysis) with precision, indicating that Markets are still more on the mood for consolidation.
To tilt the scales one way however, the Daily RSI has been holding strong above the neutral line, indicating that buyers remain in control. This also corroborates with the price action holding above $4,000 – Keep this level closely in check.
Traders might have to be more patient in order to see a definite breakout (both upside and downside are still possibilities).
In the meantime, the triangle formation is the one key technical aspect to watch.
Gold (XAU/USD) 2H Chart and levels
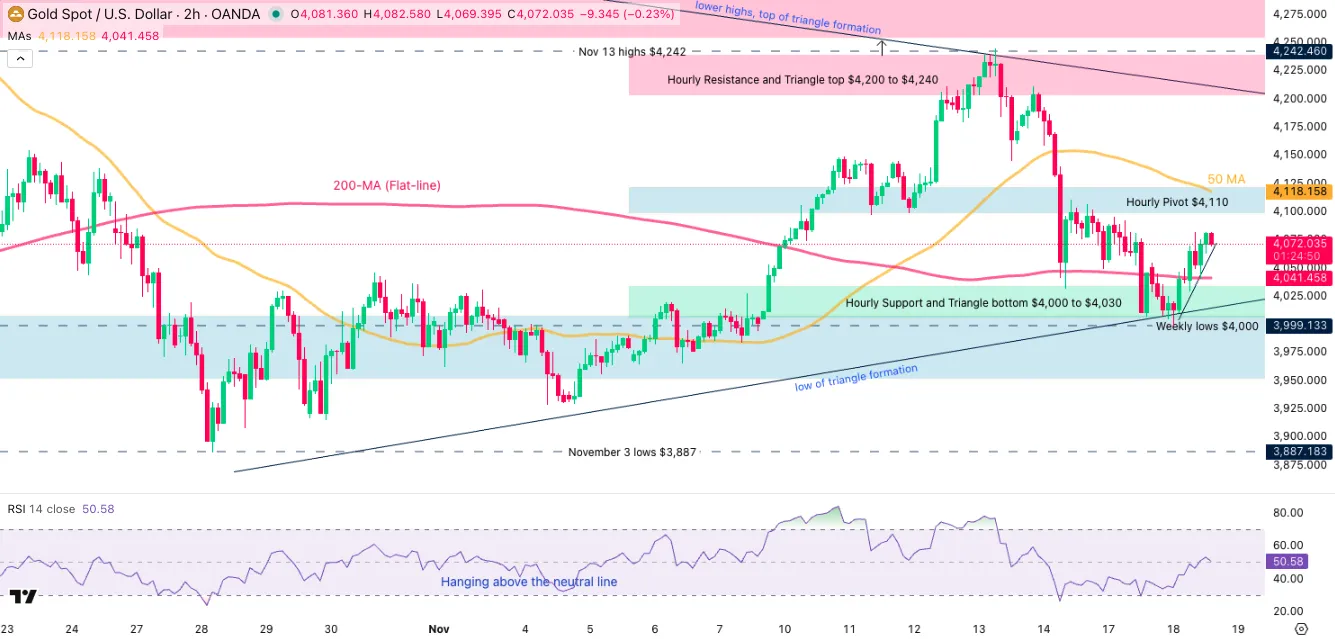
Gold (XAU) 2H Chart, November 18, 2025 – Source: TradingView
Gold is still holding within a $4,000 to $4,240 range but seems to be contracting as things unroll.
The MA 200 largely flatlining confirms this point, therefore watch for a breakout of the Triangle formation if you want to trade a directional price action.
If not, one can look at opportunities within the triangle formation (strong support and resistances are there for now).
Gold technical levels of interest:
Resistance Levels
- Current All-time High resistance $4,250 to $4,400 (ATH $4,380)
- Hourly Resistance and Triangle top $4,200 to $4,240
- Session highs $4,080
Support Levels
- Hourly Support and Triangle bottom $4,000 to $4,030
- Major Pivot $3,950 to $4,000
- $3,700 consolidation Support
- $3,500 Major Support
Silver (XAG) holds a strong range
Silver (XAG/USD) Daily Chart
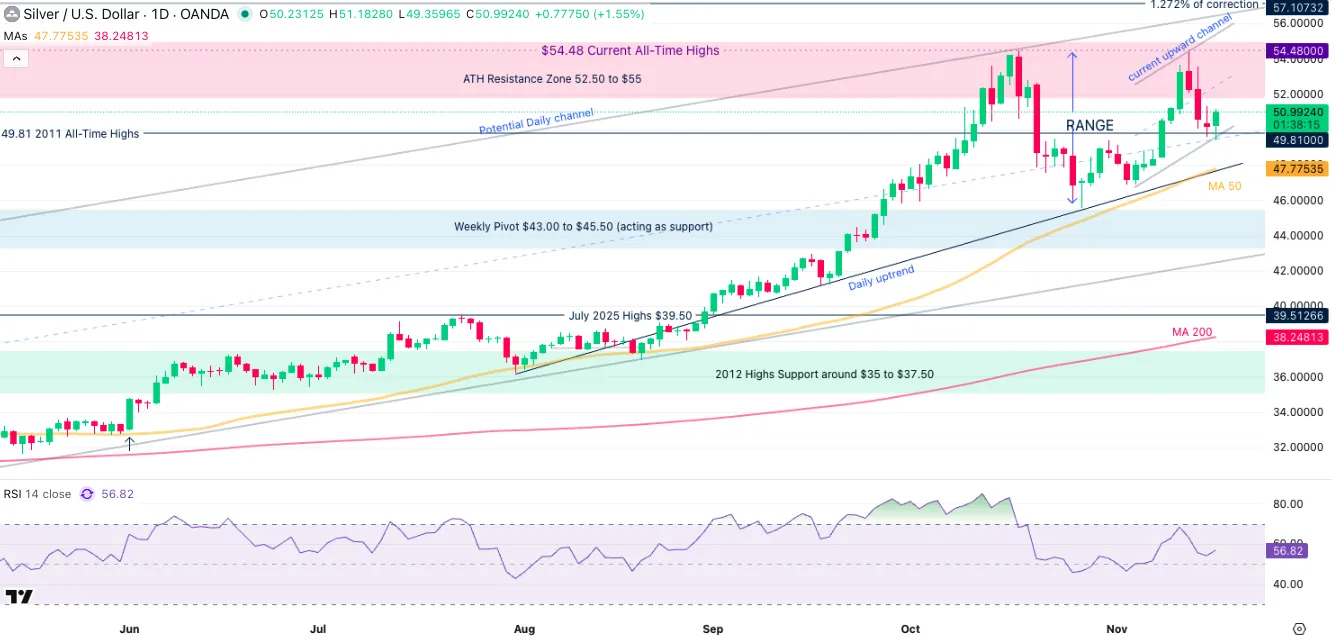
Silver (XAG) Daily Chart, November 18, 2025 – Source: TradingView
Silver has had quite a run to its new all-time highs, even outperforming Gold towards its rise.
However, momentum as calmed down quite suddenly, leading to a $47 to $52 broad range in the past week of action.
The action is more sideways than anything, but bulls are trying to accumulate some momentum as can be seen in the few breakout attempts that need more strength.
Still, some small consistent buying is currently playing out, so watch for any breakouts beyond hourly support and resistance levels – more details on them right below.
Silver (XAG/USD) 4H Chart and levels
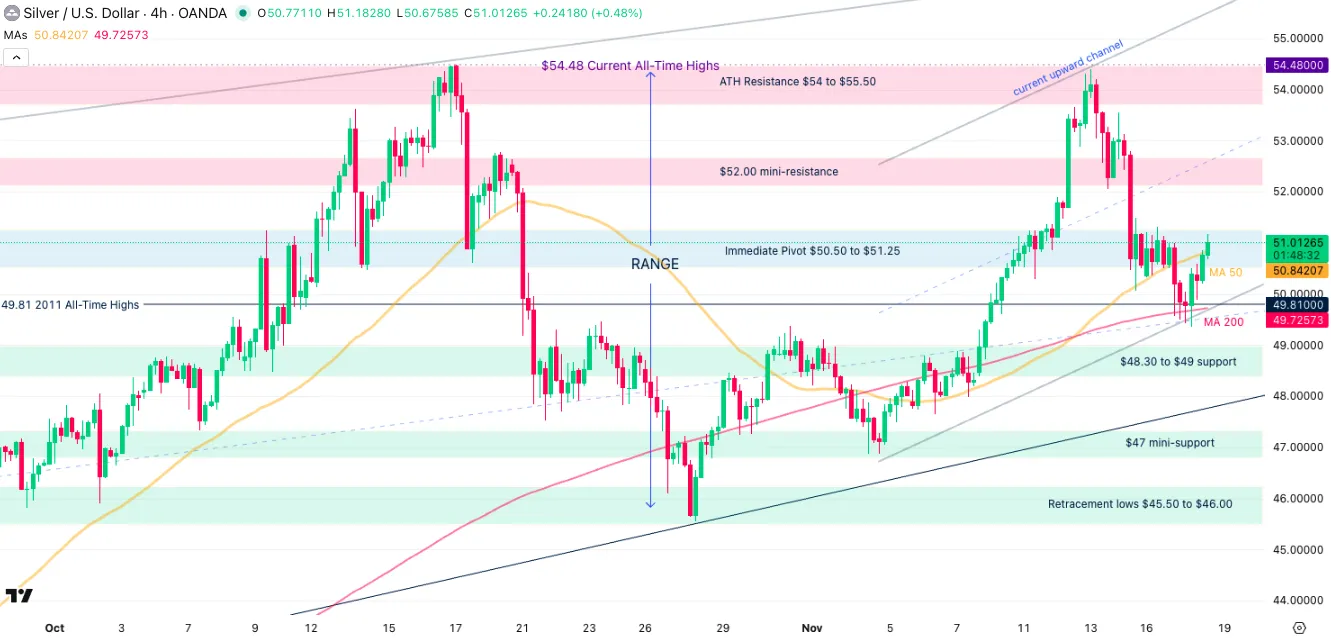
Silver (XAG) 4H Chart, November 18, 2025 – Source: TradingView
Levels to watch for Silver (XAG) trading:
Resistance Levels:
- Immediate Pivot $50.50 to $51.25
- 2025 record $55.48
- $52 to $53 mini-resistance
- $51.18 session highs
- Potential resistance 1 $57.50 to $60 (1.382% from 2022 lows)
- Potential resistance 2 $62 to $65 (1.618 from Impulsive Move)
Support Levels:
- $48.30 to $49 support
- $47 low of potential daily channel
- $45.55 October 28 lows
- $43.00 to $45.00 Weekly pivot
- $39.50 to $40 higher timeframe support
- 2012 Highs Support around $37.50
Safe Trades!
Gold (XAU/USD) Price Technical Outlook: $4000/oz Holds Firm as FOMC Minutes and Labor Data Releases Lie Ahead
Gold prices have had a topsy turvy start to the week but the $4000/oz handle has held firm. Bulls have returned and price has bounced off the confluence area at $4000 but needs acceptance above the $4100/oz handle for the rally to gather steam.
The question on the minds of market participants is whether or not Gold bulls will remain in control after the Fed minutes release and Labor data on Thursday?
Technical Outlook - Gold (XAU/USD)
Looking at the four-hour chart below, the technical picture is interesting.
Having bounced off the ascending trendline which lined up with the $4000/oz handle, Gold broke above the 100-day MA and is now testing the descending trendline drawn from the November 13 high around $4245/oz.
A break of the descending trendline and the 50-day MA around the $4096/oz handle could open up a potential rally toward the previous descending trendline touch at $4212/oz.
Of course there is a resistance area around the $4150/oz handle which could prove to be a stumbling block but bulls may be emboldened or if not will be eyeing US labor data and the Fed minutes as a potential catalyst.
To keep the bullish momentum going, the 100-day MA at 4041 is now a crucial near-term support area. If this area holds, it should bode well for bullish momentum.
Gold (XAU/USD) Four-Hour Chart, November 18, 2025
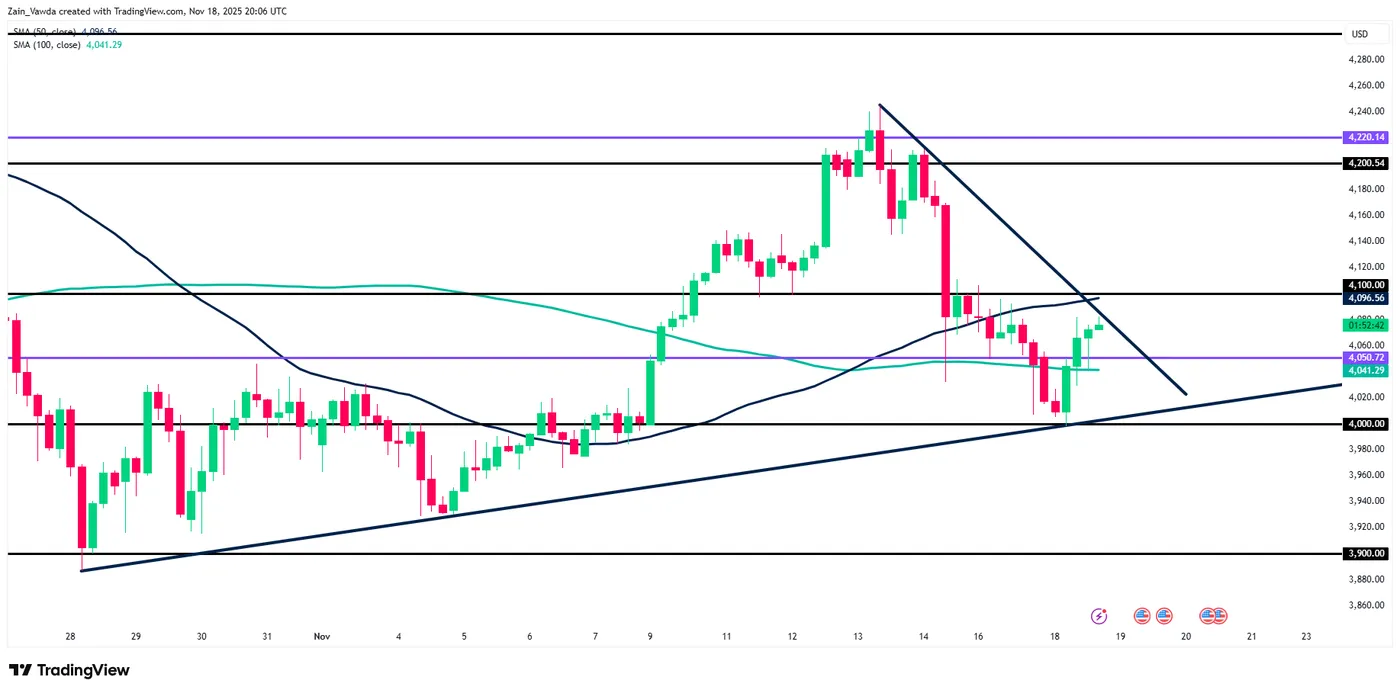
Source: TradingView (click to enlarge)
Market Dynamics and Data Releases
The price of Gold (XAU/USD) has appeared relatively unaffected by the moves in the US Dollar Index of late. However, this does not mean that correlation is no longer something to keep an eye on.
This week's Fed minutes and Labor data releases will play a major role in rate cut expectations which will impact market sentiment and the US Dollar Index. This in turn will play a major role in the movement of Gold prices moving forward.
The aggressive repricing of rate cut probabilities for the Feds December meeting (93.7% probability a month ago vs 51.1% probability at present) has kept Gold gains in check.
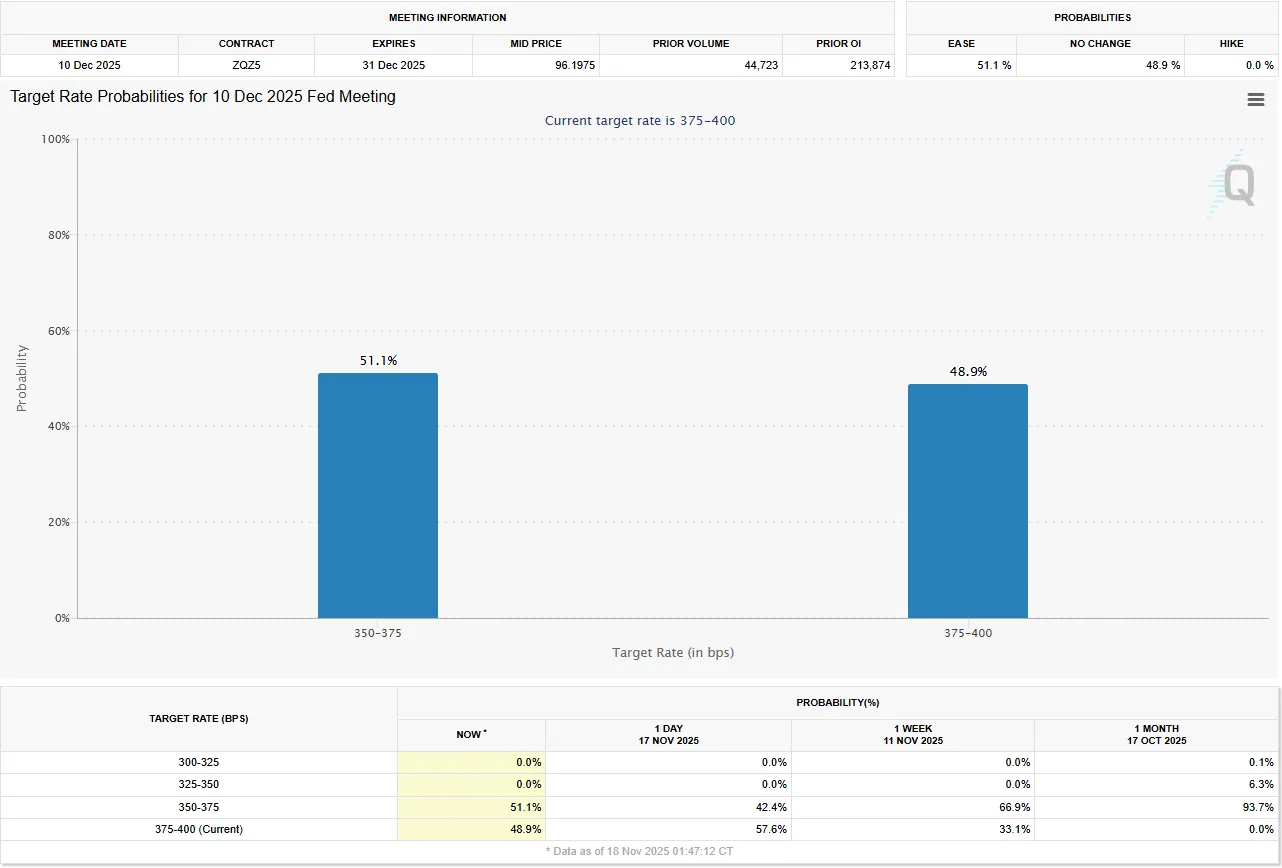
Source: CME FedWatch Tool
However, a weak print on the labor data front could see rate cut expectations spike and thus propel Gold higher once more.
Markets already know broadly what to expect from the Fed minutes release as it was Fed Chair Powell's tone and the 10-2 vote split at the Fed's October meeting that kickstarted the hawkish repricing of rate cut expectations.
Thus the event could be sidelined by market participants in favor of Thursday's labor data release.
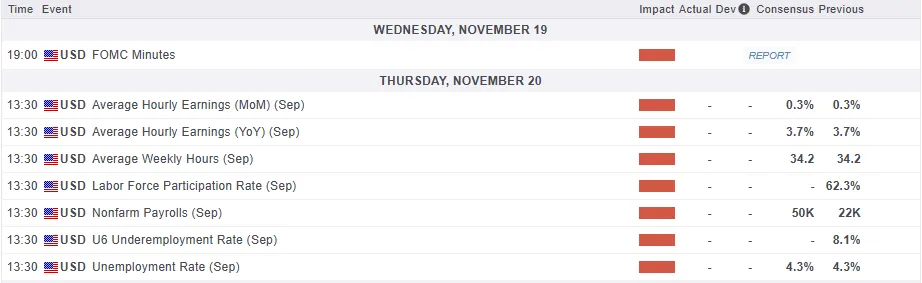
For all market-moving economic releases and events, see the MarketPulse Economic Calendar. (click to enlarge)
Be nimble and trade safe.
Dollar-Franc Looks for Support at Triple Bottom Ahead of FOMC Minutes, Eyes 0.80000
Currently trading at 0.79952, having recovered losses from earlier in today’s session, USD/CHF is up +0.42% in today’s session.
Having recently suffered its worst weekly performance since June, falling by 1.38% in week 46, dollar-franc now looks for support near the key level of 0.8000, having recently formed a triple bottom on the daily timeframe.
Otherwise, markets now eye an all-important FOMC Minutes release tomorrow.
What’s next for USD/CHF?
USD/CHF: Key takeaways 18/11/2025
- Succumbing to bearish pressure in last week's trading, USD/CHF has found some support in the past few sessions and is currently looks to secure a three-day winning streak
- While changing expectations of Fed monetary policy is offering some short-term upside to the dollar, consistent safe haven flows and a recent US-Switzerland trade agreement continue to cement the franc’s position as best-performing major currency year-to-date
- With the next Federal Reserve meeting scheduled only three short weeks from today, markets now turn their attention to tomorrow’s FOMC Minutes release, with markets already readjusting expectations of another 25 BPS cut to end 2025
USD/CHF: Safe haven flows, trade deals & a hawkish Fed
While if I had a franc for every time I’ve mentioned safe-haven flows when talking about USD/CHF this year, I’d probably be able to buy a fair few cups of coffee, the fact remains that geopolitical tensions, dubious sovereign debt levels, and a shake-up to global trade all continue to add to the premium for renowned safe-haven currencies like the Swiss Franc.
While in years previous, much of this demand for more secure and reliable stores of wealth would have split somewhat between different currencies, the dollar and the yen have undeniably fallen by the wayside in favour of the franc in terms of safe-haven appeal.
Case in point: the Swiss franc remains the best-performing major currency year to date, with the euro in a close second place.
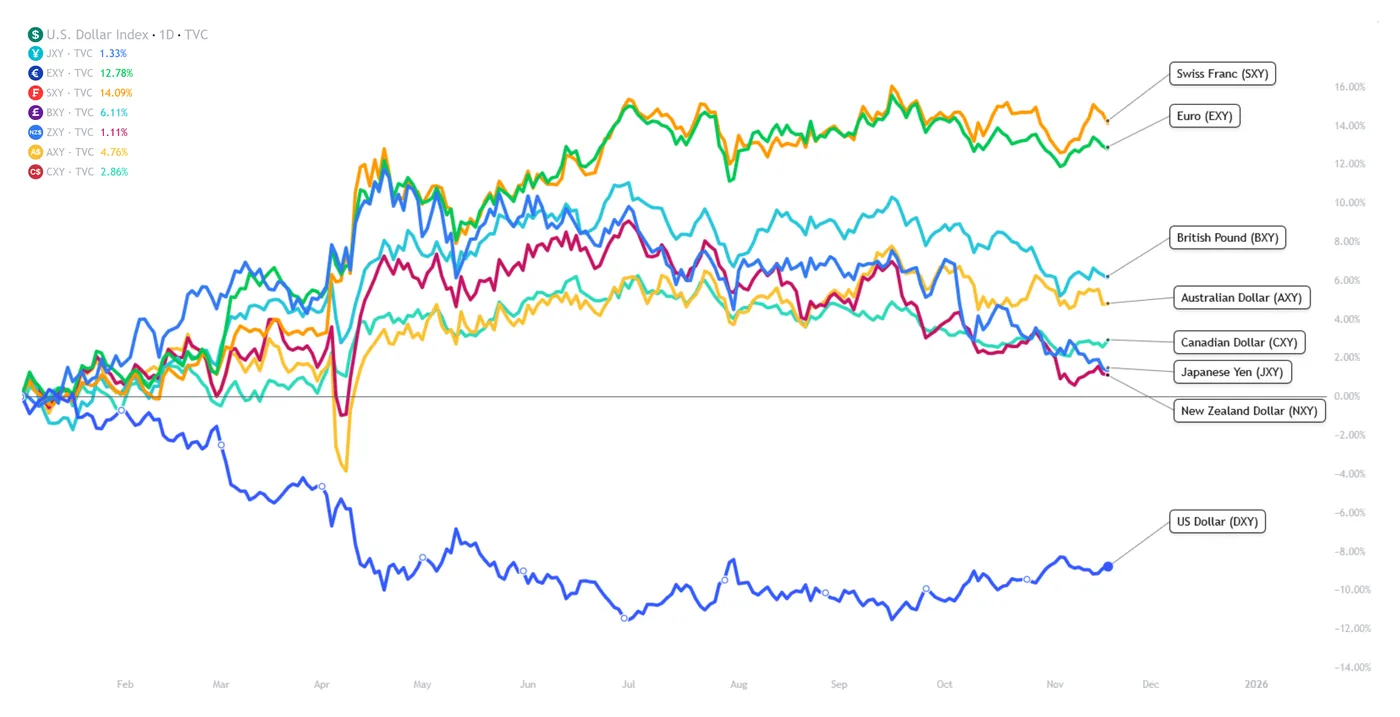
SXY, EXY, BXY, AXY, CXY, JXY, NXY, DXY, TVC, TradingView,18/11/2025
As ever, let’s break down some of the macroeconomic themes at play in USD/CHF markets.
USD/CHF: Fundamental Analysis 18/11/2025
Safe-haven flows continue to benefit the franc: While I have explained this in full as part of previous coverage, it would be remiss not to mention that an increase in safe-haven demand has been the deciding factor in CHF strength throughout 2025.
Between ballooning US government debt, a downgrade of US sovereign credit, global trade tensions, and continued world conflicts, there is clearly no shortage of tailwinds for safe-haven assets, with the rally in precious metal pricing and franc value sharing some common ground.
While deflationary pressures in the Swiss economy, alongside a rumoured return to negative rates, have somewhat called the franc’s status as ultimate safe-haven into question at times this year, the market has clearly voted with its feet in 2025, with falling dollar value compounding this effect further.
US-Switzerland trade deal: Announced earlier this week, the conclusion of a significant tariff agreement between the United States and Switzerland has offered some upside to the Swiss franc, with whispers of a trade deal between the two countries confirmed and finalised.
While I can’t speak for anyone else, when I think of the Swiss economy, I think of pharmaceuticals, luxury watches, and jewelry, which is, as it happens, far from just anecdotal. The Swiss economy consistently ranks highly in terms of the ratio of total exports to total GDP, particularly when compared to its European counterparts.
As such, and with an economy that relies heavily on exports to countries like the US, any notion of positive developments on trade tariffs will disproportionately benefit the franc, as seen in last week’s trading.
Fed’s hawkish repricing: While the above would support a strengthening of the franc over the dollar, recent upside in USD/CHF pricing suggests there’s something more at play.
That fly in the ointment is recent developments in Fed monetary policy, with an almost certain 25-basis-point cut in December, perhaps not so certain after all.
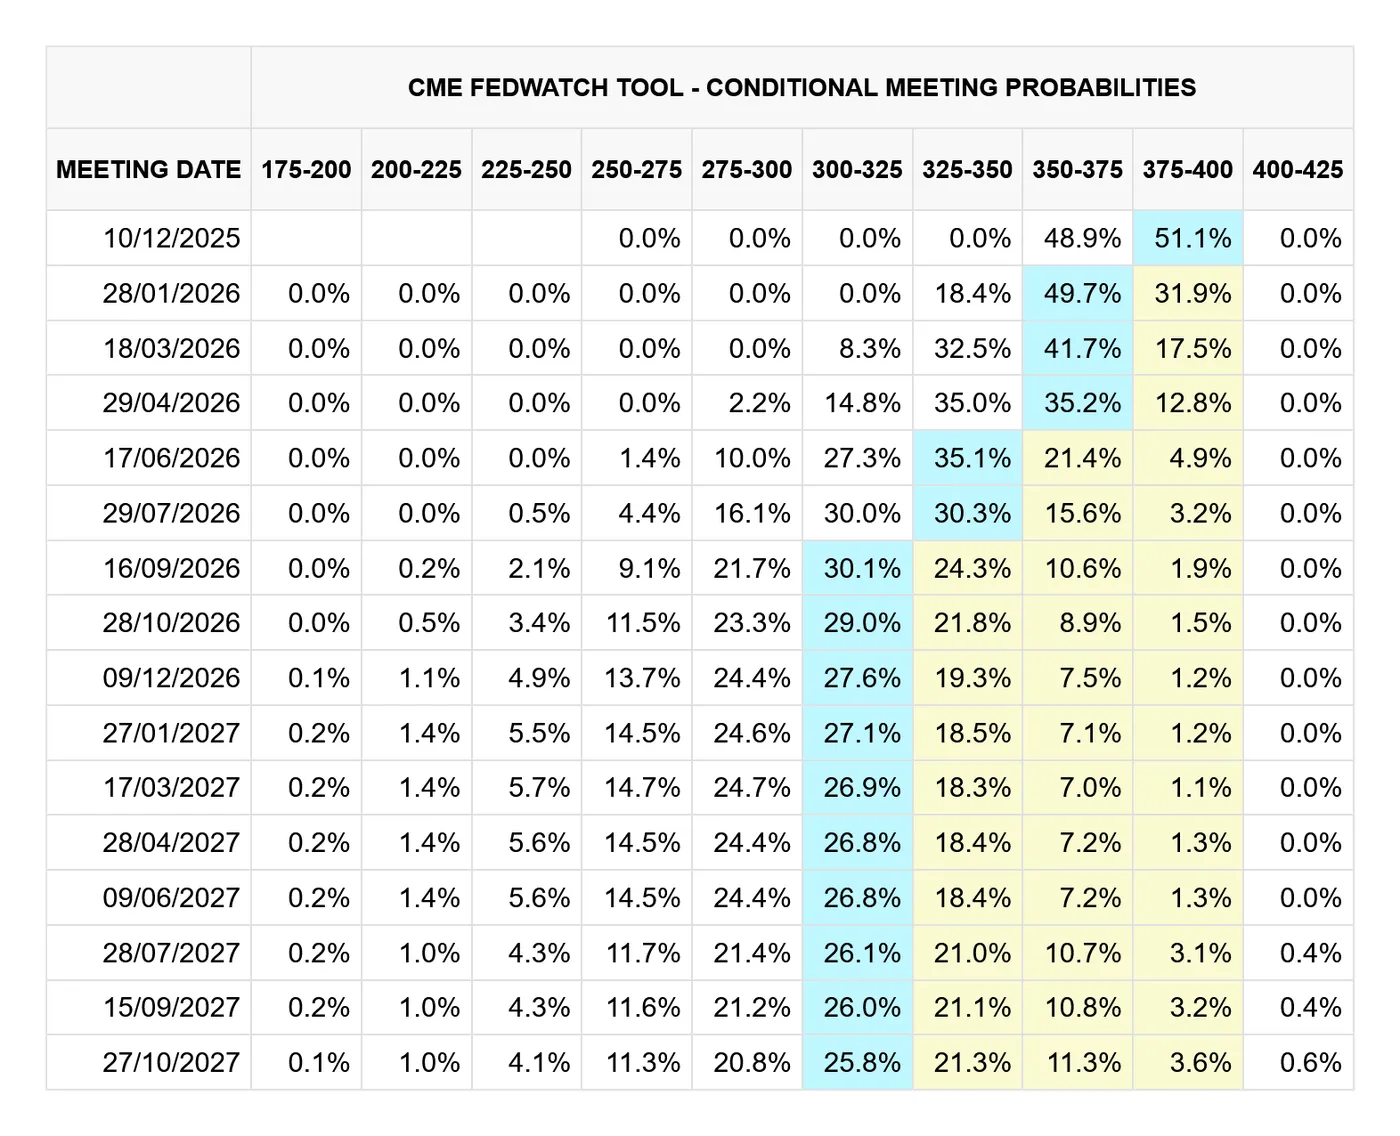
CME FedWatch, 18/11/2025
To add to a pre-existing hawkish tilt from the Federal Reserve, who, to give credit, has consistently attempted to temper market expectations of a rapid easing cycle, Vice Chair Jefferson shared some choice words in a speech yesterday:
“Given that outlook, I supported last month's decision to reduce our policy rate by 1/4 percentage point. That step was appropriate because I see the balance of risks as having shifted in recent months as downside risks to employment have increased. The current policy stance is still somewhat restrictive, but we have moved it closer to its neutral level that neither restricts nor stimulates the economy. The evolving balance of risks underscores the need to proceed slowly as we approach the neutral rate.”
Vice Chair Jefferson, speaking at the the Federal Reserve Bank of Kansas City, Kansas City, Missouri
Fair to say: the Federal Reserve is less dovish than previously thought some weeks ago, primarily on labour market concerns.
As can be expected, a more hawkish Fed is positive for the US dollar, especially considering the SNB currently offers an interest rate of 0.00% compared to the Fed’s 4.00%, marking a significant differential.
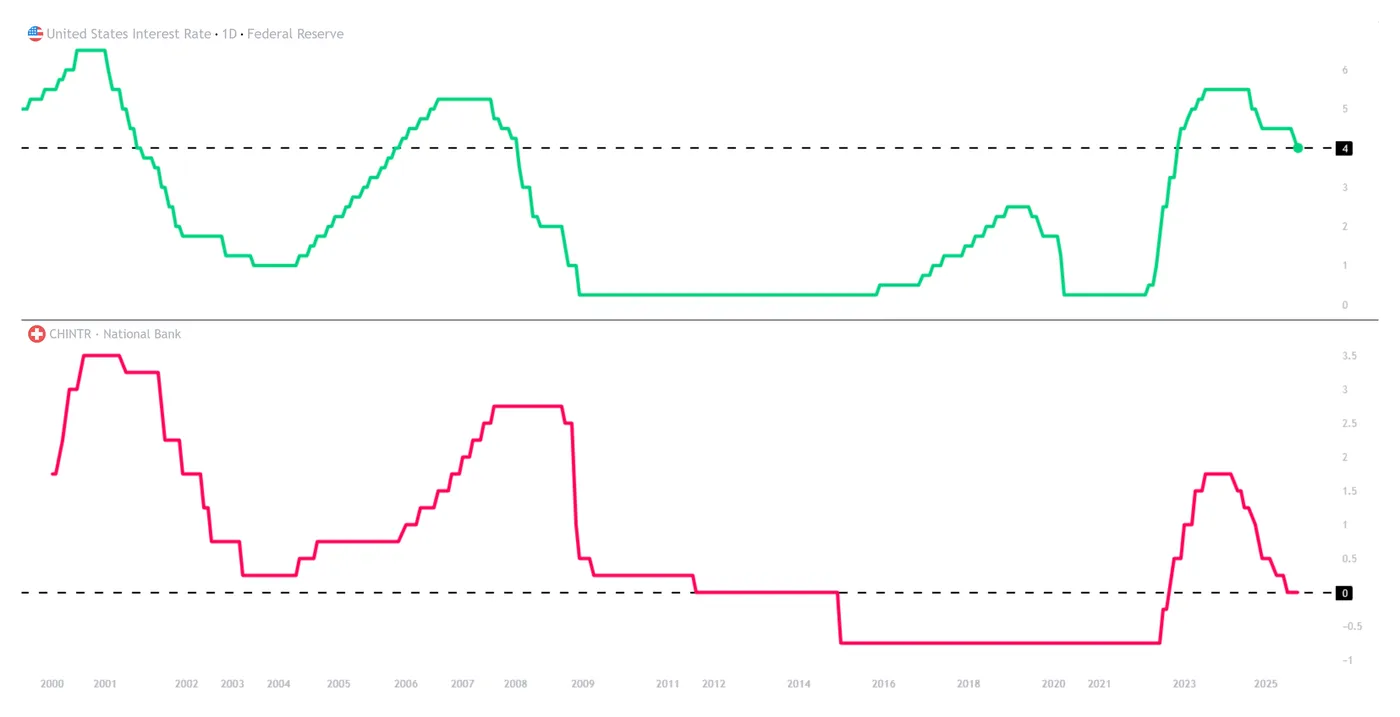
USINTR & CHINTR, TradingView,18/11/2025
Markets, now cast their watchful eye totomorrow’s FOMC Minutes release, and will of course be looking for further clues regarding December’s decision.
- Wednesday, November 19th, US FOMC Minutes, 14:00 EST
USD/CHF: Technical Analysis 04/11/2025
USD/CHF: Daily (D1) chart analysis:
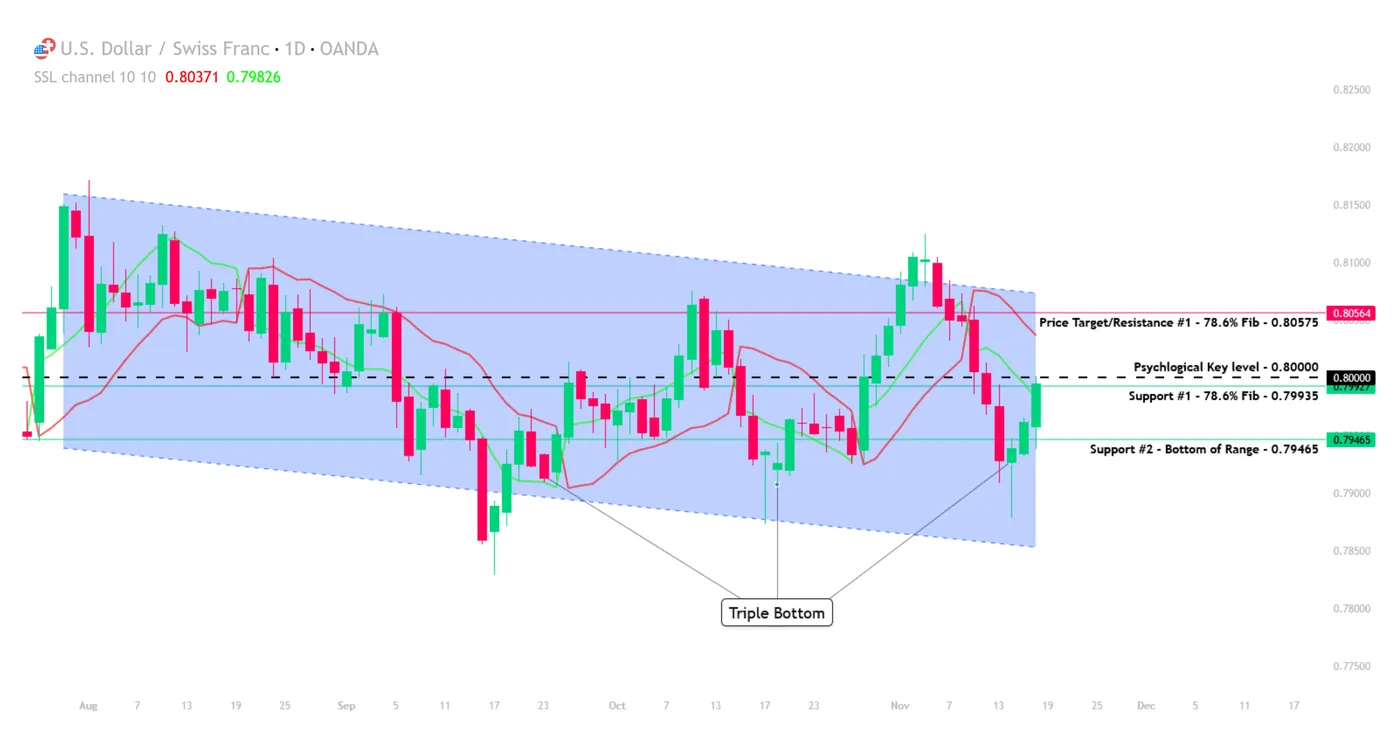
USD/CHF, D1, OANDA, TradingView, 18/11/2025
In the spirit of honesty, I would personally steer clear of trading USD/CHF at the moment, at least until price looks to break out of the current range.
Technically, USD/CHF has traded sideways since late July, but it is also entirely at the mercy of Fed commentary in the minutes tomorrow, so the fundamental picture remains somewhat unclear.
If I had to trade, I would be looking to the upside, especially considering the recent triple bottom and pin bar, but again, I’d want further confirmation. In any case:
Price targets and support/resistance levels:
- Price target/Resistance #1 - $0.80575 - 78.6% Fib from previous analysis
- Support #1 - $0.79935 - 78.6% Fib from previous analysis
- Support #2 - $0.79465 - Bottom of range
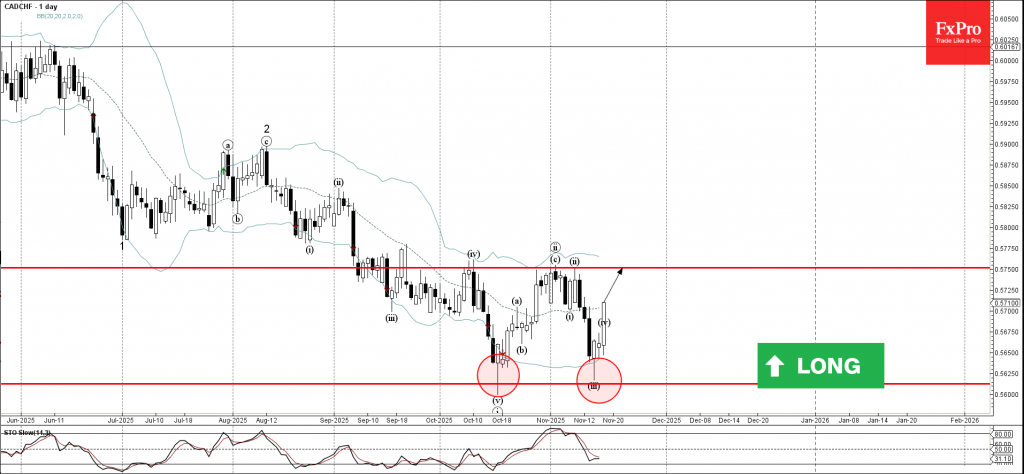
CADCHF Wave Analysis
CADCHF: ⬆️ Buy
- CADCHF reversed from key support level 0.5600
- Likely to rise to resistance level 0.5750
CADCHF currency pair recently reversed from key support level 0.5600 (which stopped the previous impulse wave i in the middle of October, as can be seen from the daily CADCHF chart below) standing near the lower daily Bollinger band.
The upward reversal from the support level 0.5600 created the daily Japanese candlesticks reversal pattern Hammer.