
Sample Category Title
EUR/AUD Daily Outlook
Daily Pivots: (S1) 1.7786; (P) 1.7829; (R1) 1.7894; More...
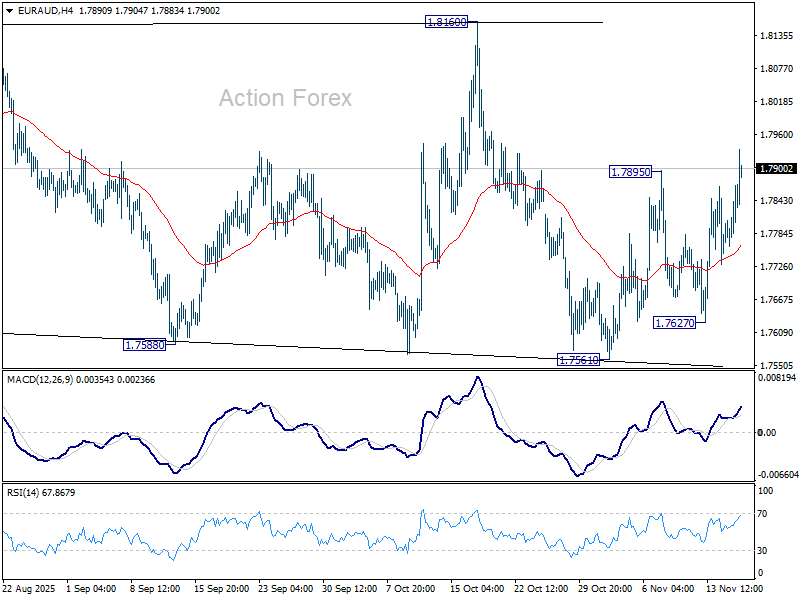
EUR/AUD's rebound from 1.7561 resumed by breaking through 1.7895. Intraday bias is back on the upside for 1.8160 resistance. Firm break there will resume the rally from 1.7245. On the downside, however, break of 1.7627 will turn bias back to the downside for 1.7561 support instead.
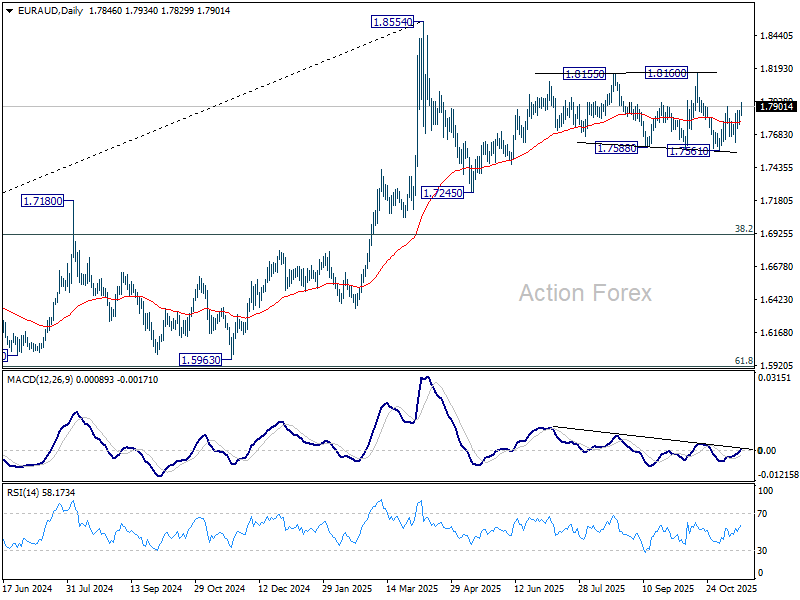
In the bigger picture, price actions from 1.8554 medium term top are seen as a corrective pattern. Sustained break of 55 W EMA (now at 1.7426) will suggest that it's correcting the whole rally from 1.4281 (2022 low). In this case, deeper decline would be seen to 38.2% retracement of 1.4281 to 1.8554 at 1.6922. Nevertheless, strong rebound from 55 W EMA will likely bring resumption of the up trend sooner.
EUR/CHF Daily Outlook
Daily Pivots: (S1) 0.9216; (P) 0.9224; (R1) 0.9235; More....
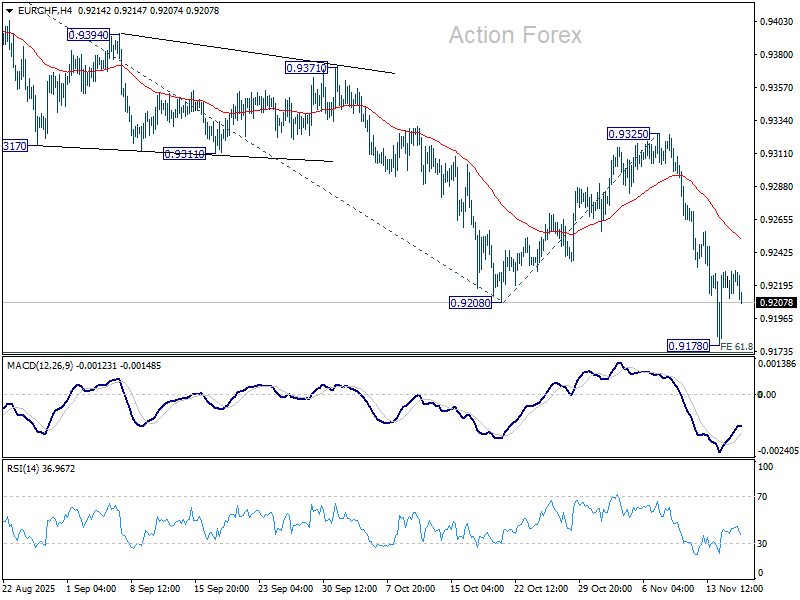
EUR/CHF is staying in consolidations above 0.9178 and intraday bias remains neutral. Upside of recovery should be limited below 0.9325 resistance to bring another fall. Firm break of 0.9178 will extend the larger down trend and target 100% projection of 0.9452 to 0.9208 from 0.9325 at 0.9082.
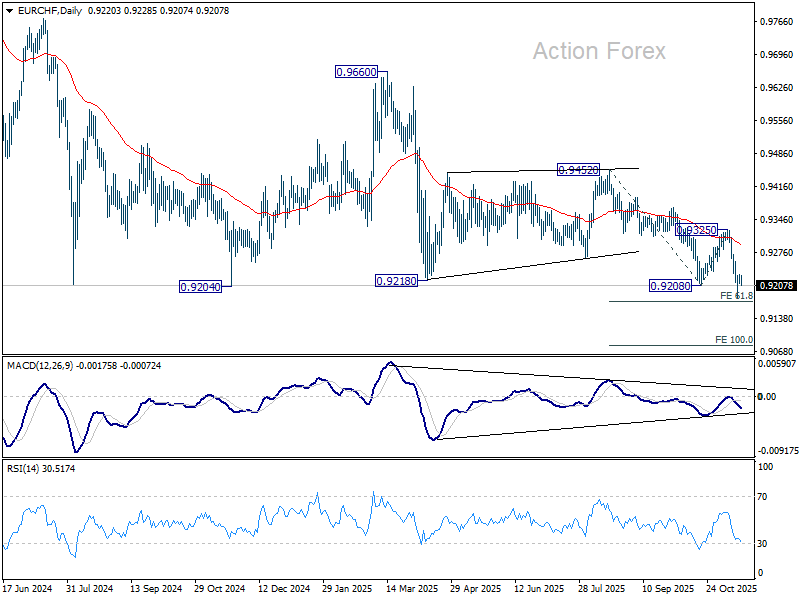
In the bigger picture, outlook remains bearish with EUR/CHF staying well inside long term falling channel after multiple rejection by 55 W EMA (now at 0.9377). Next target is 61.8% projection of 1.1149 to 0.9407 from 0.9928 at 0.8851. Break of 0.9452 resistance is needed to be the first sign of medium term bottoming. Otherwise, outlook will stay bearish in case of strong rebound.
AUD/USD Daily Report
Daily Pivots: (S1) 0.6510; (P) 0.6531; (R1) 0.6557; More...
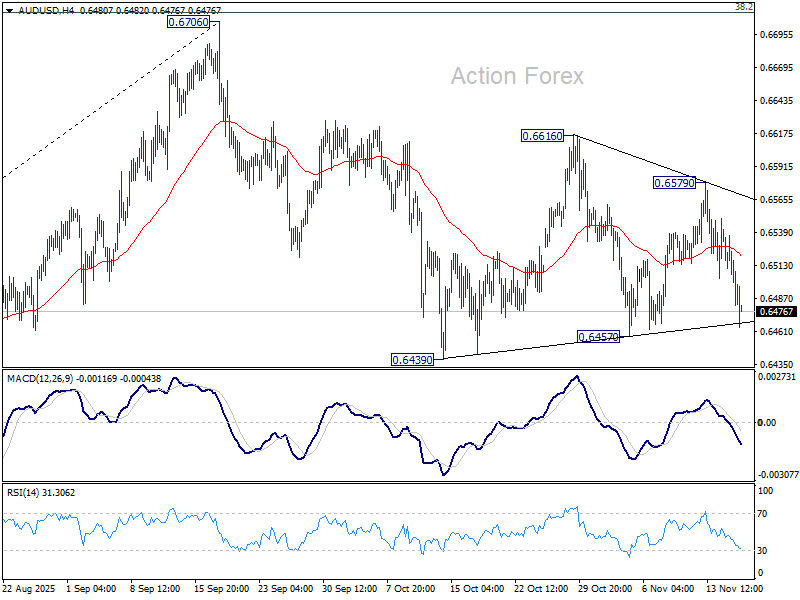
AUD/USD dives sharply today but still stays in range of 0.6457/6579. Intraday bias remains neutral first. On the downside, break of 0.6457 will target 0.6413 cluster (38.2% retracement of 0.5913 to 0.6706 at 0.6403). Decisive break there will carry larger bearish implications. On the upside, break of 0.6579 will bring stronger rise to 0.6616 resistance. Firm break there will target a retest of 0.6706 high.
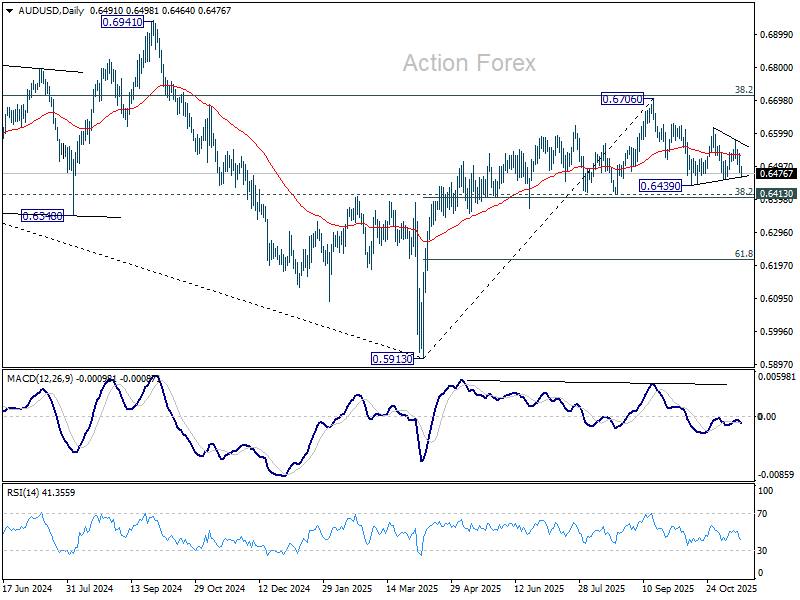
In the bigger picture, there is no clear sign that down trend from 0.8006 (2021 high) has completed. Rebound from 0.5913 is seen as a corrective move. Outlook will remain bearish as long as 38.2% retracement of 0.8006 to 0.5913 at 0.6713 holds. Break of 0.6413 support will suggest rejection by 0.6713 and solidify this bearish case. Nevertheless, considering bullish convergence condition in W MACD, sustained break of 0.6713 will be a strong sign of bullish trend reversal, and pave the way to 0.6941 structural resistance for confirmation.
USD/CAD Daily Outlook
Daily Pivots: (S1) 1.4028; (P) 1.4044; (R1) 1.4072; More...
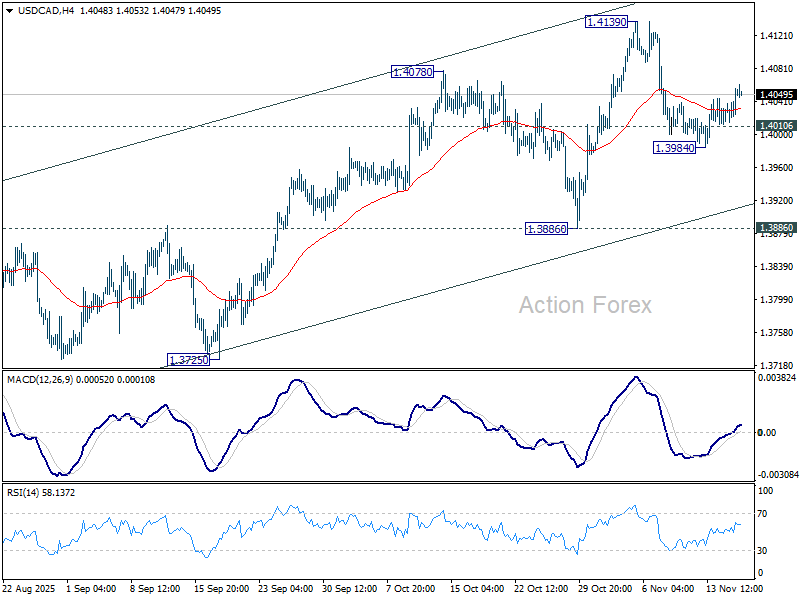
The extended rebound for 1.3984 suggests that pullback from 1.4139 has already completed. Intraday bias in USD/CAD is back on the upside for retesting 1.4139. Firm break there will resume the whole rally from 1.3538. On the downside through, below 1.4016 will resume the fall from 1.4139 through 1.3984 instead.
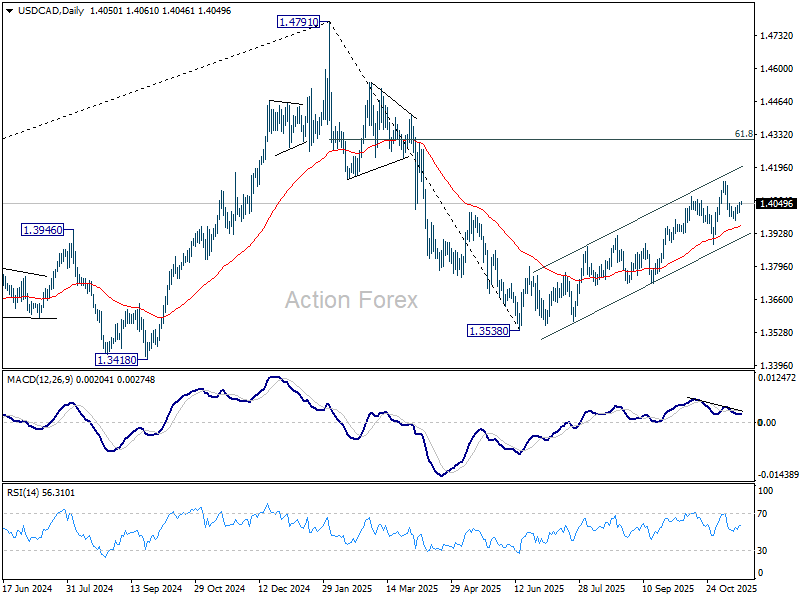
In the bigger picture, price actions from 1.4791 medium term top is likely just unfolding as a correction to up trend from 1.2005 (2021 low), with rise from 1.3538 as the second leg. A third leg should follow before up trend resumption. That is, range trading is set to extend for the medium term. For now, this will remain the favored case as long as 1.3886 support holds. However, firm break of 1.3886 will revive the case that fall from 1.4791 is indeed a larger scale correction.
EUR/USD Daily Outlook
Daily Pivots: (S1) 1.1576; (P) 1.1600; (R1) 1.1619; More…
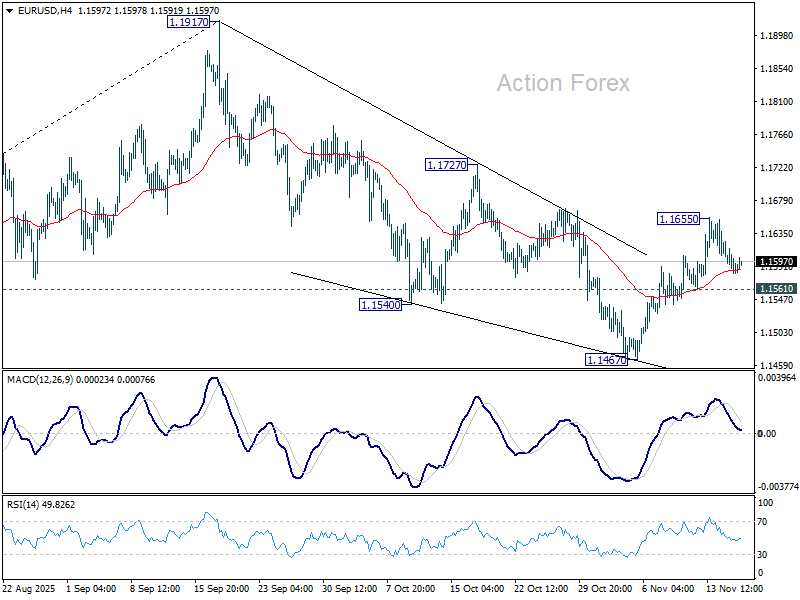
Intraday bias in EUR/USD remains neutral and outlook is unchanged. Fall from 1.1917 could have completed as a three wave correction at 1.1467. Above 1.1655 will target 1.1727 resistance first. Firm break there will solidify this bullish case and bring retest of 1.1917 high. However, break of 1.1561 will revive near term bearishness and target 1.1467 low instead.
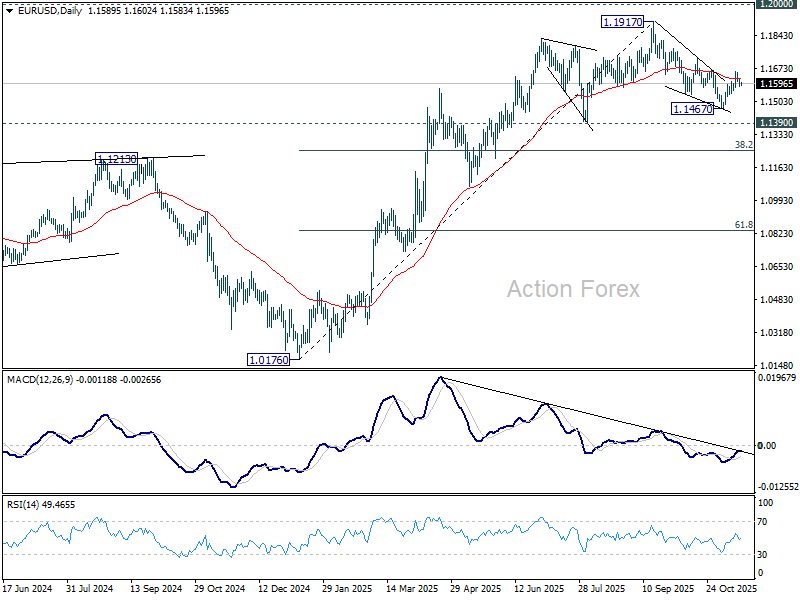
In the bigger picture, considering bearish divergence condition in D MACD, a medium term top is likely in place at 1.1917, just ahead of 1.2 key psychological level. As long as 55 W EMA (now at 1.1328) holds, the up trend from 0.9534 (2022 low) is still in favor to continue. Decisive break of 1.2000 will carry larger bullish implications. However, sustained trading below 55 W EMA will argue that rise from 0.9534 has completed as a three wave corrective bounce, and keep long term outlook bearish.
GBP/USD Daily Outlook
Daily Pivots: (S1) 1.3130; (P) 1.3161; (R1) 1.3187; More...
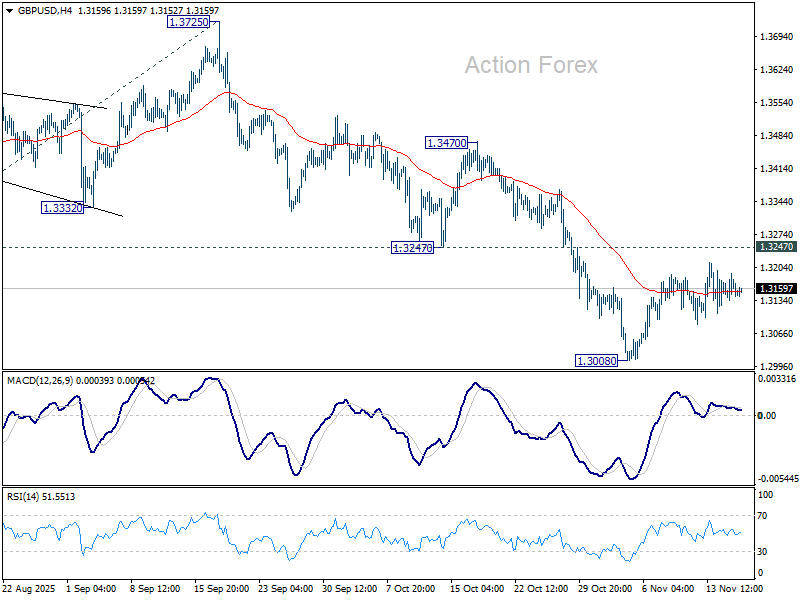
No change in GBP/USD's outlook as consolidations continues above 1.3008. Intraday bias stays neutral and further decline is expected as long as 1.3247 support turned resistance holds. Break of 1.3008 will resume the fall from 1.3787, and target 138.2% projection of 1.3787 to 1.3140 from 1.3725 at 1.2831. Nevertheless, firm break of 1.3247 will suggest that fall from 1.3787 has completed as a corrective move already.
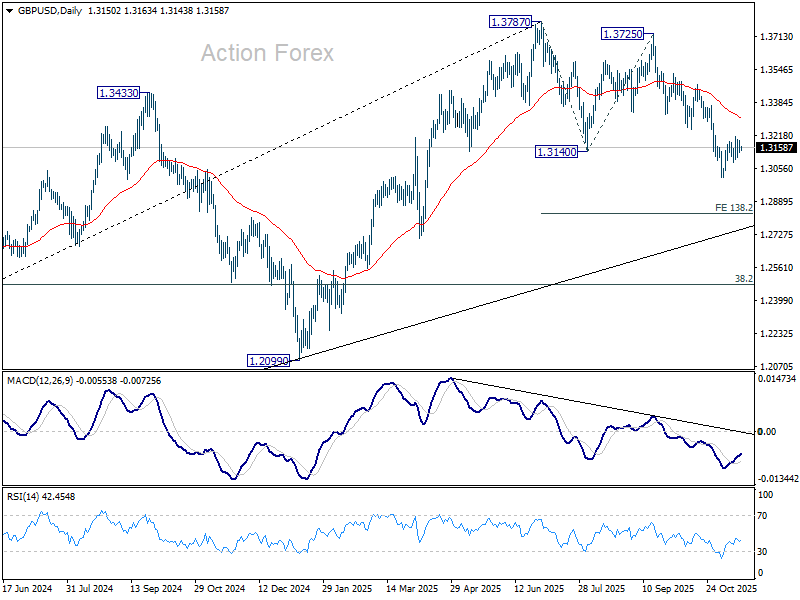
In the bigger picture, the break of 55 W EMA (now at 1.3182) is taken as the first sign that corrective rise from 1.0351 (2022 low) has completed. Decisive break of trend line support (now at 1.2824) will solidify this case and target 38.2% retracement of 1.0351 to 1.3787 at 1.2474 next. Meanwhile, in case of another rise, strong resistance should emerge below 1.4248 (2021 high) to cap upside to preserve the long term down trend.
USD/CHF Daily Outlook
Daily Pivots: (S1) 0.7941; (P) 0.7953; (R1) 0.7975; More…
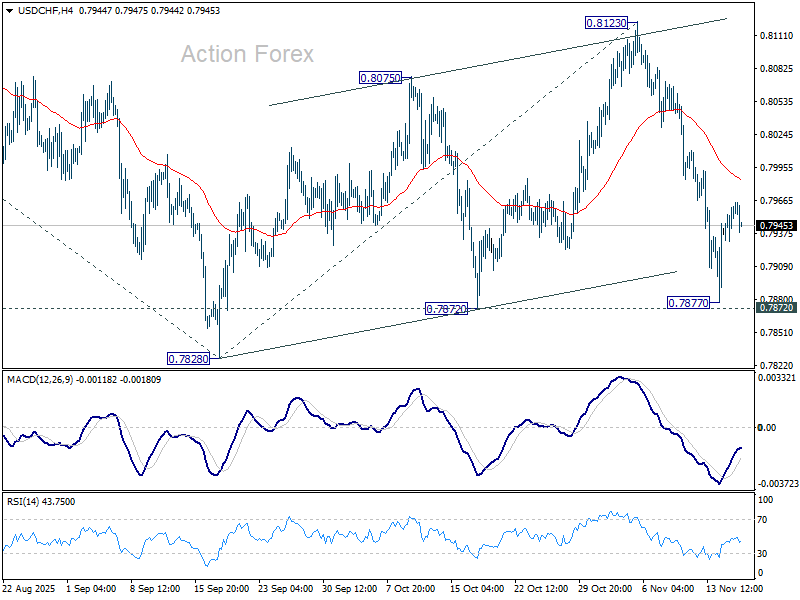
No change in USD/CHF's outlook and intraday bias in USD/CHF stays neutral for consolidations above 0.7877. As noted before, corrective rebound from 0.7828 could have completed with three waves up to 0.8123. Break of 0.7872 support will pave the way through 0.7828 to resume the larger down trend. Next near term target is 38.2% projection of 0.9200 to 0.7828 from 0.8123 at 0.7599. However, sustained break of 55 4H EMA (now at 0.7984) will mix up the outlook.
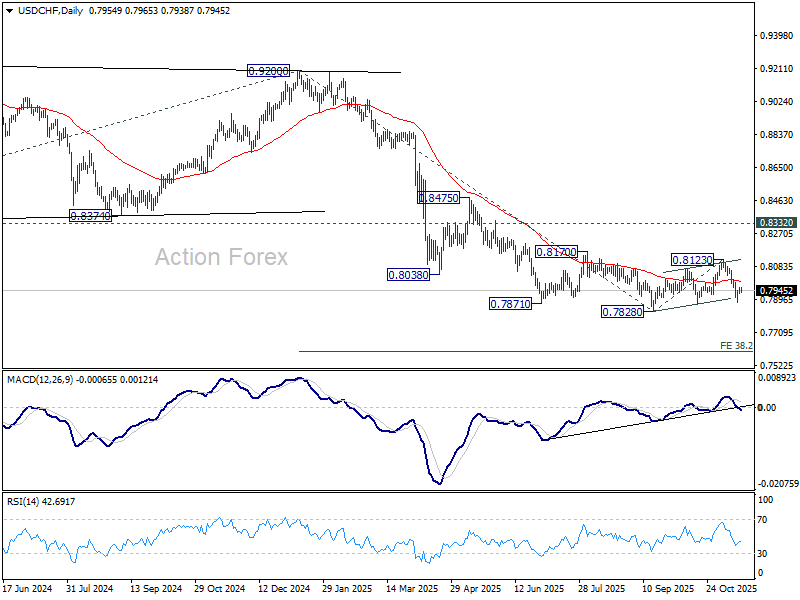
In the bigger picture, long term down trend from 1.0342 (2017 high) is still in progress. Next target is 100% projection of 1.0146 (2022 high) to 0.8332 from 0.9200 at 0.7382. In any case, outlook will stay bearish as long as 0.8332 support turned resistance holds (2023 low).
USD/JPY Daily Outlook
Daily Pivots: (S1) 154.43; (P) 154.86; (R1) 155.70; More...
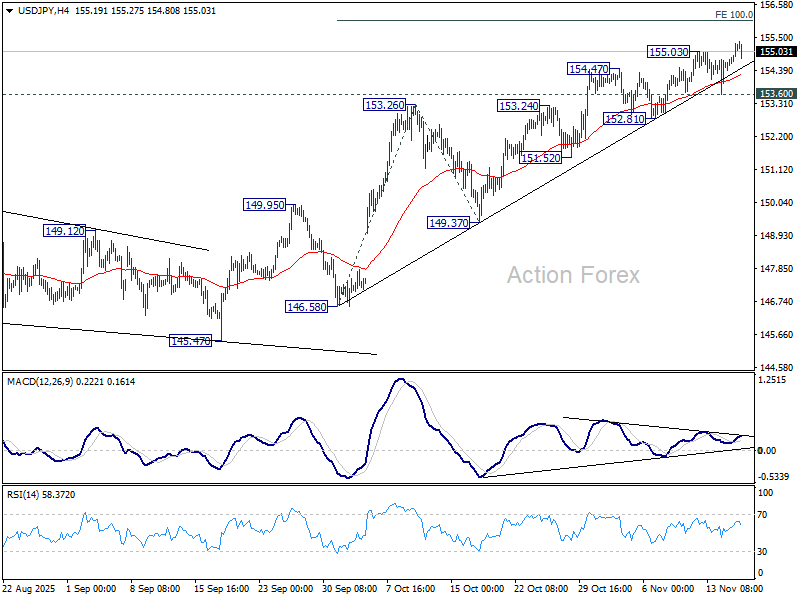
USD/JPY's rise resumed by breaking through 155.03 temporary top and intraday bias is back on the upside. Current rally from 139.87 should now target 100% projection of 146.58 to 153.26 from 149.37 at 156.05. Break there will pave the way to 158.85 key structural resistance. However, considering bearish divergence condition in 4H MACD, firm break of 153.60 support will indicate short term topping, and bring deeper pullback to 55 D EMA (now at 151.45).
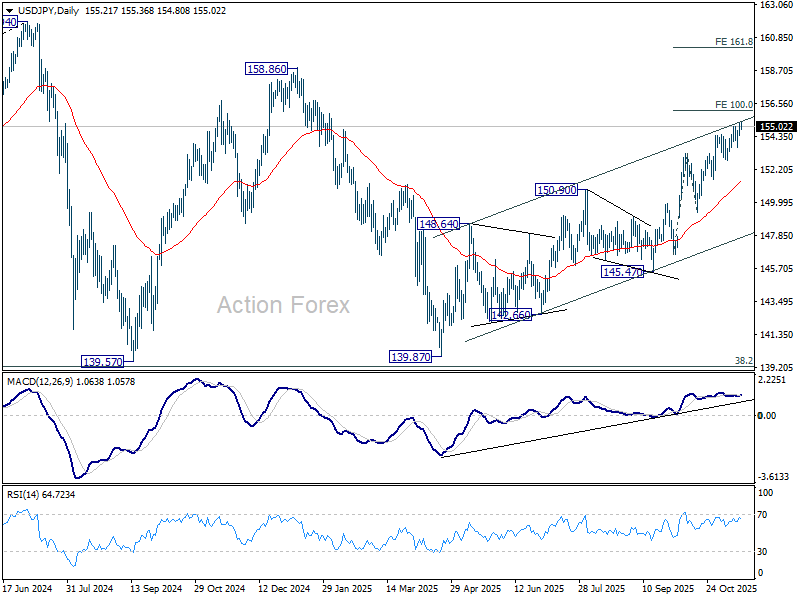
In the bigger picture, current development suggests that corrective pattern from 161.94 (2024 high) has completed with three waves at 139.87. Larger up trend from 102.58 (2021 low) could be ready to resume through 161.94 high. On the downside, break of 149.37 support will dampen this bullish view and extend the corrective pattern with another falling leg.
Risk-Off Strikes Again, Yen Awaits Signals from Takaichi–Ueda Meeting
Swiss Franc and Yen led the forex board in Asian session today, buoyed by a fresh wave of risk aversion. U.S. equities closed notably lower overnight, with pressure concentrated once again in AI-linked megacaps. The weakness spilled quickly into Asia, lifting traditional safe havens and putting renewed strain on high-beta currencies.
Nvidia fell around 2% ahead of Wednesday’s third-quarter earnings report, a release that traders are treating as a barometer of whether the AI-driven equity rally still has structural momentum. The company sits at the center of the debate over whether this year’s surge in AI valuations is still fundamentally sound or dangerously dependent on narrow market leadership. With concerns growing about weak breadth and stretched pricing, traders reduced risk heading into a heavy U.S. data week, including September NFP.
Yen also drew some support from Tokyo’s stepped-up verbal intervention efforts. Japan’s Finance Minister Satsuki Katayama intensified her warnings as USD/JPY crossed 155, describing the latest moves as “extremely one-sided and rapid,” and expressing “deep concern.” The comments helped stabilize the currency intraday, though traders remain skeptical about how far verbal guidance alone can go without policy action.
Indeed, expectations surrounding BoJ policy tightening—not ad hoc remarks—remain the primary driver of Yen’s underlying direction. And on that front, markets are looking to a key meeting today: the first direct discussion between Prime Minister Sanae Takaichi and BoJ Governor Kazuo Ueda. Reports suggest Takaichi is preparing a larger-than-expected economic stimulus package and is unlikely to welcome early or aggressive rate hikes.
The messaging after the meeting could meaningfully shape expectations for whether the next BoJ move comes in December, January, or even later. Any signal that the government prefers policy patience could blunt the impact of today’s intervention rhetoric and leave Yen vulnerable unless risk-off sentiment intensifies.
Risk appetite itself is the Yen’s other major swing factor, and today it is clearly leaning toward caution. Asian equities are deep in the red at the time of writing, with Nikkei down -2.90%, HSI down -1.62%, Shanghai SSE down -0.71%, and STI down -0.45%. Overnight U.S. Indexes also closed lower, with DOW -1.18%, S&P 500 -0.92%, NASDAQ -0.84%, and U.S. 10-year yield slipping -0.015 to 4.133.
Across FX markets, Swiss Franc remains the strongest by a wide margin, followed by Yen and then Euro. At the bottom sits Aussie, despite a relatively hawkish set of RBA minutes. Kiwi is the next weakest, followed by Dollar, while Loonie and Sterling sit squarely in the middle of the pack.
RBA minutes show no clear bias toward next move
RBA minutes from the November 3–4 meeting underscored a Board that sees the economy as “broadly in balance” and saw no justification to adjust the cash rate at this stage. While the central projection remains aligned with the RBA’s employment and inflation objectives, policymakers stressed that the next move in rates is not predetermined. Members agreed it was “not yet possible to be confident” about whether holding steady or easing further would become the more likely scenario.
The minutes outlined several conditions that could support keeping policy unchanged. One is a stronger-than-expected recovery in "demand" that lifts employment. Another is if incoming data suggest the economy’s "supply capacity" is weaker than previously assessed — potentially due to persistently high inflation or softer-than-expected productivity growth. A third is a reassessment of whether monetary policy is still "slightly restrictive". Any of these outcomes, the RBA said, would "limit the scope for further easing".
But the Board also detailed circumstances that could justify another rate cut. A material weakening in the labor market remains the clearest trigger. A second downside risk is if GDP growth disappoints — for example, if households turn "more cautious about spending" than currently assumed. In these cases, excess capacity would likely reappear, cooling inflation and warranting additional support.
Overall, the minutes confirm a central bank in wait-and-see mode. The RBA is not ruling out further easing, but neither is it leaning strongly toward it. The next several months of data — particularly on productivity, inflation persistence, and household spending — will be crucial in determining whether the Board holds steady or reopens the easing path in 2026.
Fed’s Waller backs December cut, Jefferson urges slow approach
Fed Governor Christopher Waller struck a notably dovish tone in a speech overnight, arguing that inflation risks have diminished and that weakening labor conditions now deserve greater attention.
Waller said he is “not worried about inflation accelerating”, adding that after months of cooling job data, it is unlikely that this week’s September employment report—or any incoming releases—would alter his view that “another cut is in order.” He warned that restrictive monetary policy is weighing disproportionately on lower- and middle-income consumers, reinforcing the case for easing.
Waller said a December cut would offer “additional insurance” against further deterioration in the labor market and help move policy closer to a neutral setting.
Separately, Vice Chair Philip Jefferson offered a more balanced perspective in his speech, acknowledging that policy has already been guided closer to neutral rate. He added, "The evolving balance of risks underscores the need to proceed slowly as we approach the neutral rate."
Bitcoin eyes temporary support at 92k; broader downside risks stretch to 84k or even 70k
Bitcoin’s downturn has accelerated last week, dragging the cryptocurrency back toward levels last seen at the end of 2024. The retreat is striking: despite surging to a fresh record above 126k earlier this year, the entire advance has now been unwound.
For now, the pace of selloff has slowed, and some signs of stabilization are emerging. Bitcoin is approaching potential technical support near 92k, a level that aligns with measured projection of the current decline. Still, the broader technical picture suggests that this latest leg lower may be part of a correction within a much larger, multi-year uptrend rather than a simple dip to be bought.
History also matters, and a deeper drop could change behavior quickly. Bitcoin has repeatedly seen corrections of more than 50% during major down cycles, and any renewed acceleration lower may reawaken those memories among investors. Panic selling is an unmistakable risk if the decline extends sharply from here, especially given how quickly sentiment has turned since the October peak.
This downturn is not happening in isolation. The slide from the record high has been driven by a confluence of factors: widespread profit-taking by long-term holders, steady institutional outflows, and the forced liquidation of leveraged longs. Adding to the pressure, broader market sentiment has softened as uncertainty over a December Fed rate cut lingers. That policy hesitation has weighed on risk assets broadly, cryptocurrencies included.
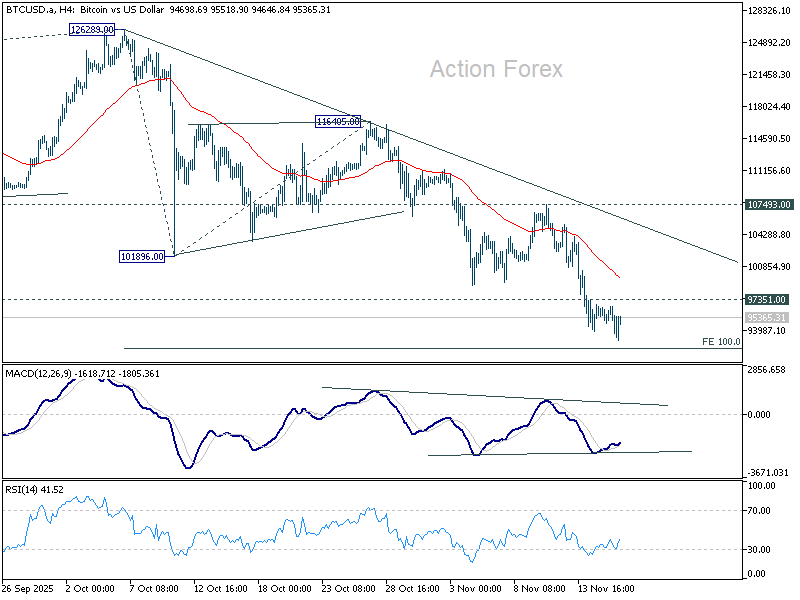
Technically, short-term indicators reflect loss of downside momentum. 4H MACD is showing early signs of stabilization, and Bitcoin may find a floor near 100% projection of 126,289 to 101,896 from 116,405 at 92,012. Break of 97,351 minor resistance would signal near-term bottoming and allow for consolidation. However, any rebound is likely to be capped below 10,7493 resistance, keeping the bias tilted toward another decline.
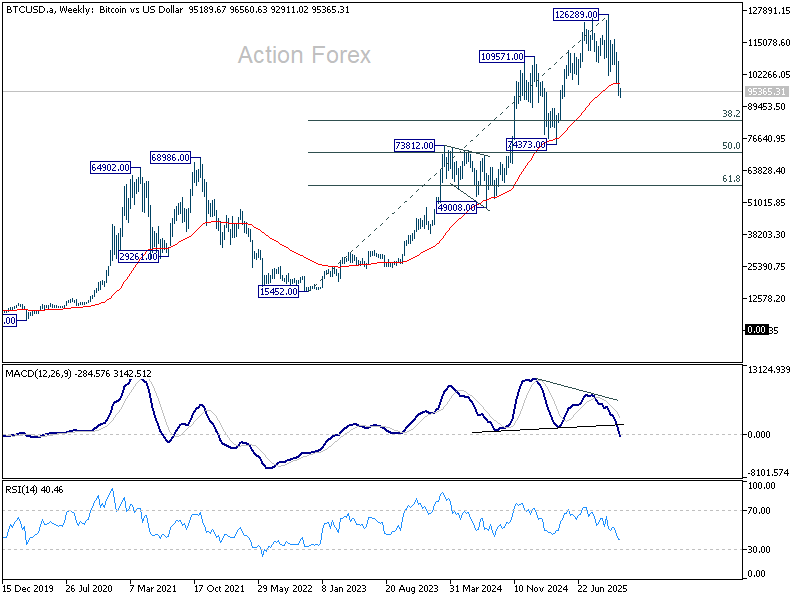
The longer-term chart carries deeper implications. The entire uptrend from 15,452 (2022 low) may have completed as a five-wave rise to 126,289. Bearish divergence in W MACD supports this interpretation, and last week’s break below 55 W EMA (now at 98,483) reinforces the prospect of a broader correction.
From a structural perspective, 38.2% retracement of 15,452 to 126,289 at 83,949 is the minimum medium term downside target for the correction. However, given the combination of momentum loss and macro headwinds, a deeper decline toward 50% level at 70,870 — where a notable support cluster sits — cannot be ruled out.
USD/JPY Daily Outlook
Daily Pivots: (S1) 154.43; (P) 154.86; (R1) 155.70; More...
USD/JPY's rise resumed by breaking through 155.03 temporary top and intraday bias is back on the upside. Current rally from 139.87 should now target 100% projection of 146.58 to 153.26 from 149.37 at 156.05. Break there will pave the way to 158.85 key structural resistance. However, considering bearish divergence condition in 4H MACD, firm break of 153.60 support will indicate short term topping, and bring deeper pullback to 55 D EMA (now at 151.45).
In the bigger picture, current development suggests that corrective pattern from 161.94 (2024 high) has completed with three waves at 139.87. Larger up trend from 102.58 (2021 low) could be ready to resume through 161.94 high. On the downside, break of 149.37 support will dampen this bullish view and extend the corrective pattern with another falling leg.
Bitcoin eyes temporary support at 92k; broader downside risks stretch to 84k or even 70k
Bitcoin’s downturn has accelerated last week, dragging the cryptocurrency back toward levels last seen at the end of 2024. The retreat is striking: despite surging to a fresh record above 126k earlier this year, the entire advance has now been unwound.
For now, the pace of selloff has slowed, and some signs of stabilization are emerging. Bitcoin is approaching potential technical support near 92k, a level that aligns with measured projection of the current decline. Still, the broader technical picture suggests that this latest leg lower may be part of a correction within a much larger, multi-year uptrend rather than a simple dip to be bought.
History also matters, and a deeper drop could change behavior quickly. Bitcoin has repeatedly seen corrections of more than 50% during major down cycles, and any renewed acceleration lower may reawaken those memories among investors. Panic selling is an unmistakable risk if the decline extends sharply from here, especially given how quickly sentiment has turned since the October peak.
This downturn is not happening in isolation. The slide from the record high has been driven by a confluence of factors: widespread profit-taking by long-term holders, steady institutional outflows, and the forced liquidation of leveraged longs. Adding to the pressure, broader market sentiment has softened as uncertainty over a December Fed rate cut lingers. That policy hesitation has weighed on risk assets broadly, cryptocurrencies included.
Technically, short-term indicators reflect loss of downside momentum. 4H MACD is showing early signs of stabilization, and Bitcoin may find a floor near 100% projection of 126,289 to 101,896 from 116,405 at 92,012. Break of 97,351 minor resistance would signal near-term bottoming and allow for consolidation. However, any rebound is likely to be capped below 10,7493 resistance, keeping the bias tilted toward another decline.
The longer-term chart carries deeper implications. The entire uptrend from 15,452 (2022 low) may have completed as a five-wave rise to 126,289. Bearish divergence in W MACD supports this interpretation, and last week’s break below 55 W EMA (now at 98,483) reinforces the prospect of a broader correction.
From a structural perspective, 38.2% retracement of 15,452 to 126,289 at 83,949 is the minimum medium term downside target for the correction. However, given the combination of momentum loss and macro headwinds, a deeper decline toward 50% level at 70,870 — where a notable support cluster sits — cannot be ruled out.