Sample Category Title
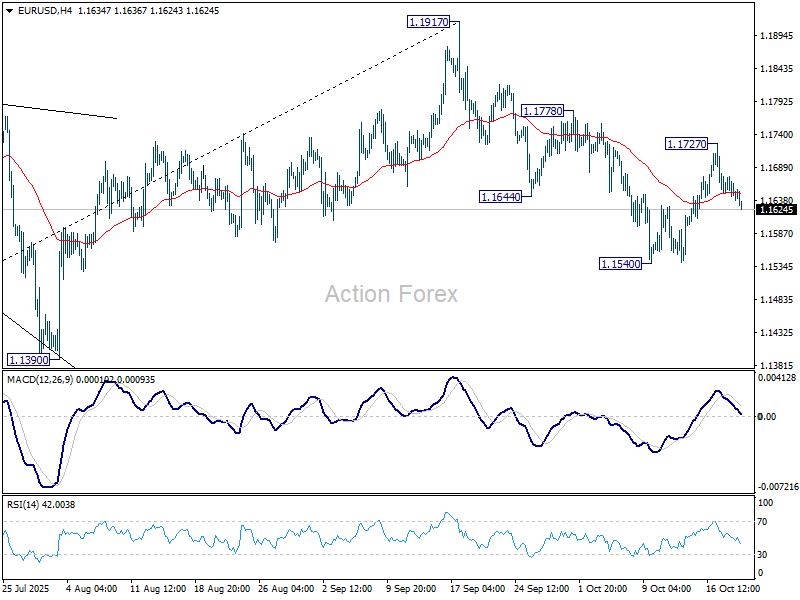
EUR/USD Daily Outlook
Daily Pivots: (S1) 1.1629; (P) 1.1652; (R1) 1.1666; More…
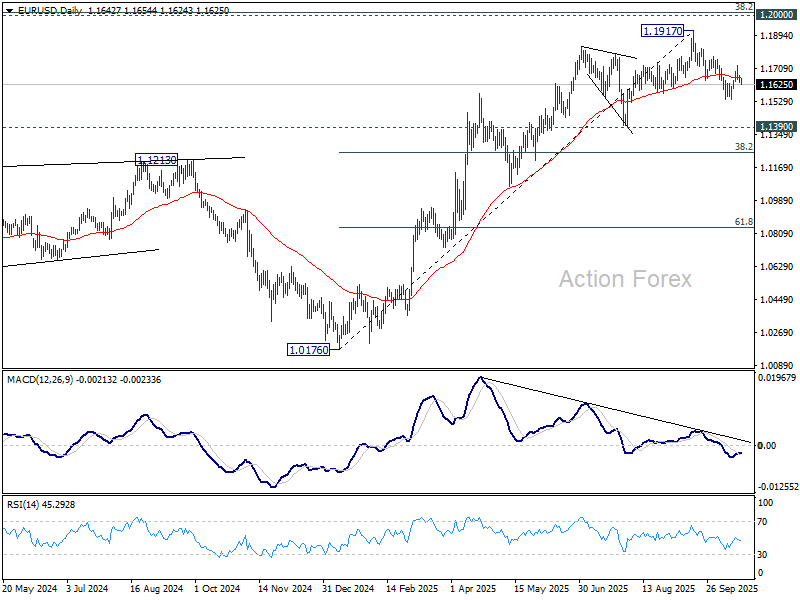
Intraday bias in EUR/USD remains neutral and further decline is in favor as long as 1.1778 resistance holds. Break of 1.1540 will resume the decline from 1.1917 and target 1.1390 support, or even further to 38.2% retracement of 1.0176 to 1.1917 at 1.1252. On the upside, through, break of 1.1778 will target retest of 1.1917 high instead.
In the bigger picture, considering bearish divergence condition in D MACD, a medium term top is likely in place at 1.1917, just ahead of 1.2 key psychological level. As long as 55 W EMA (now at 1.1290) holds, the up trend from 0.9534 (2022 low) is still expected to continue. Decisive break of 1.2000 will carry larger bullish implications. However, sustained trading below 55 W EMA will argue that rise from 0.9534 has completed as a three wave corrective bounce, and keep outlook bearish.
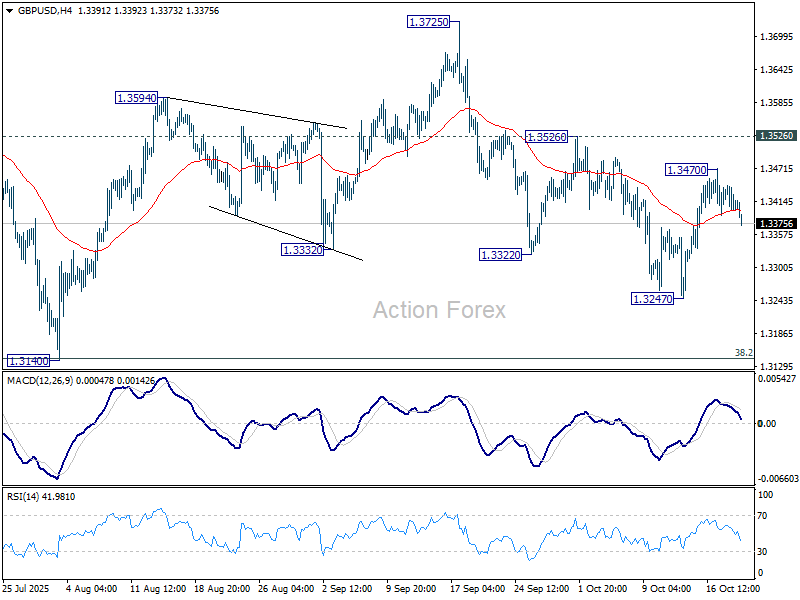
GBP/USD Daily Outlook
Daily Pivots: (S1) 1.3389; (P) 1.3416; (R1) 1.3432; More...
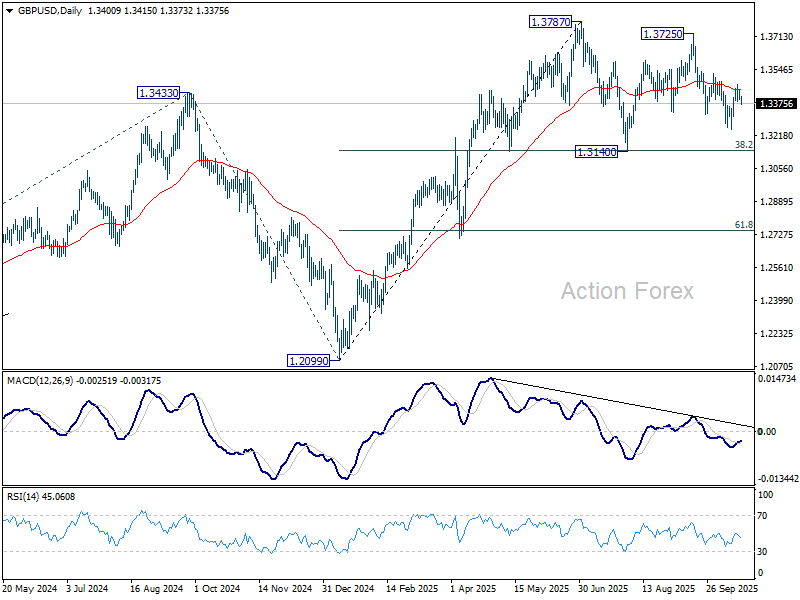
Intraday bias in GBP/USD stays neutral and another fall is mildly in favor as long as 1.3526 resistance holds. Break of 1.3247 will target 1.3140 cluster (38.2% retracement of 1.2099 to 1.3787 at 1.3142). Strong support is expected there to contain downside to complete the corrective pattern from 1.3787. On the upside, break of 1.3526 will target 1.3725/87 resistance zone.
In the bigger picture, rise from 1.0351 (2022 low) is still seen as a corrective move. Further rally could be seen to 61.8% projection of 1.0351 to 1.3433 (2024 high) from 1.2099 (2025 low) at 1.4004. But strong resistance could emerge from 1.4248 (2021 high) to limit upside. Sustained break of 55 W EMA (now at 1.3191) will argue that a medium term top has already formed and bring deeper fall back to 1.2099.
USD/CHF Daily Outlook
Daily Pivots: (S1) 0.7907; (P) 0.7925; (R1) 0.7945; More…
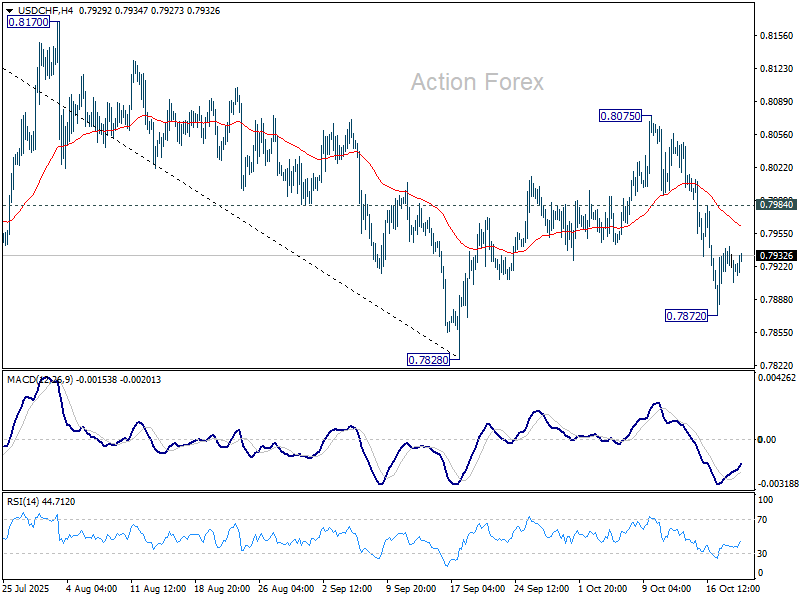
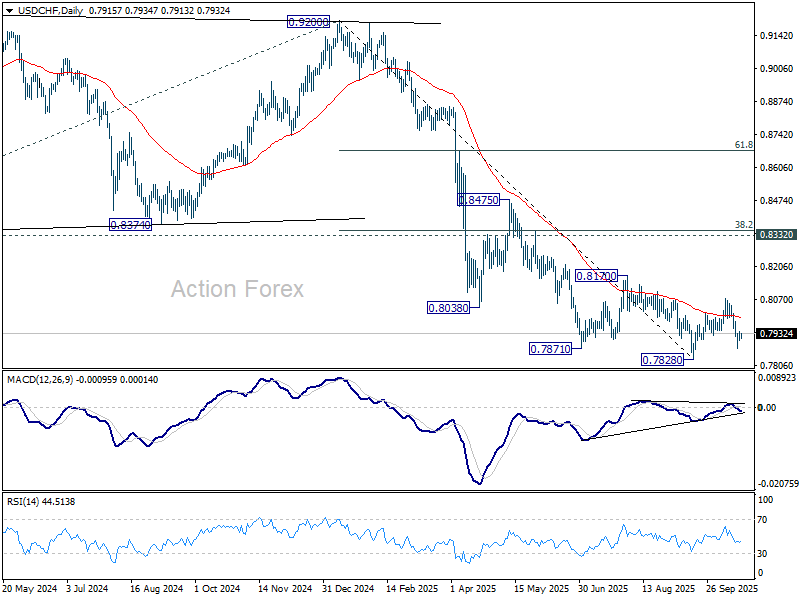
No change in USD/CHF's outlook and intraday bias stays neutral. Further decline is expected as long as 0.7984 resistance holds. On the downside, below 0.7872 will bring retest of 0.7828. Firm break there will resume larger down trend. However, break of 0.7984 will suggest that corrective pattern from 0.7828 is extending with another rising leg, and target 0.8075 again.
In the bigger picture, long term down trend from 1.0342 (2017 high) is still in progress. Next target is 100% projection of 1.0146 (2022 high) to 0.8332 from 0.9200 at 0.7382. In any case, outlook will stay bearish as long as 0.8332 support turned resistance holds (2023 low).
Asian Stocks Hit Records as Takaichi Win and Trade Deals Boost Confidence
Risk appetite swept across Asian markets today, lifting equities to fresh records as political clarity in Japan and trade optimism across the region buoyed investor confidence. Nikkei 225 surged to another all-time high after the Liberal Democratic Party’s Sanae Takaichi won 237 of 465 votes in the lower house, securing her position as Japan’s next prime minister. Her victory — comfortably exceeding the 233 needed for a majority — will see her confirmed by the upper house later today and sworn in as Japan’s 104th leader, marking a historic milestone as the nation’s first female premier.
Markets welcomed the outcome as a stabilizing force after weeks of political speculation. Investors see Takaichi as pro-stimulus and business-friendly, supportive of both monetary easing and fiscal investment. That policy outlook, combined with a weaker Yen, drove renewed buying across sectors.
In South Korea, KOSPI also hit its sixth straight record high, propelled by mounting optimism over an impending U.S.–Korea trade agreement. Stocks extended last week’s rally after U.S. Treasury Secretary Scott Bessent said negotiations were “about to finish up.” A finalized deal could ease tariff burdens and boost industrial exports, further cementing Korea’s trade position amid a recovering global supply chain.
Australia joined the regional rally, with ASX posting another intraday record. Shares in major critical minerals and rare earth companies surged following Monday’s announcement of an USD 8.5B minerals deal between Washington and Canberra. The agreement, signed by U.S. President Donald Trump and Prime Minister Anthony Albanese, will channel funding into multiple projects aimed at strengthening defense manufacturing and energy security — key areas of long-term strategic alignment between the two allies.
The flurry of positive regional developments reinforced a broader sense of stability after months of volatility driven by global trade and policy uncertainty. Asian equities benefited from a synchronized wave of optimism that extended from Tokyo to Sydney, with traders rotating back into cyclical and export-linked sectors.
In the currency markets, moves were more contained. Yen is currently the weakest performer this week, while Sterling and Loonie follow, while Aussie outperforms, as Swiss Franc and Kiwi also are firm. Dollar and Euro trade mid-pack. Most major currency pairs and crosses are still locked within last week’s ranges, awaiting fresh catalysts for breakout. However, based on current momentum, there is potential for Dollar to climb up the ladder in the coming sessions.
In Asia, at the time of writing, Nikkei is up 0.67%. Hong Kong HSI is up 1.61%. China Shanghai SSE is up 1.25%. Singapore Strait Times is up 1.31%. Japan 10-year JGB yield is down -0.011 at 1.658. Overnight, DOW rose 1.12%. S&P 500 rose 1.07%. NASDAQ rose 1.37%. 10-year yield fell -0.021 to 3.896.
New Zealand trade deficit widens NZD -14B despite strong 19% export growth
New Zealand recorded another sizeable trade deficit in September 2025, as import growth outstripped exports despite solid overseas demand. Statistics NZ data showed goods exports rose 19% yoy to NZD 5.8B. Imports increased 1.6% yoy to NZD 7.2B. The result was a monthly deficit of NZD -1.4B, versus expectation of NZD -6B and prior month's NZD -1.2B.
Export strength was broad-based, led by double-digit gains to all major partners. Shipments to China jumped 24% yoy, Australia 28%, and Japan 23%, while sales to the U.S. and EU rose 10% and 15%, respectively.
On the import side, purchases from China climbed 16% yoy, while inflows from the EU and Australia rose 7.3% and 6.4%. Offsetting that, imports from the U.S. slumped -30%, and South Korea fell -4.8%.
WTI oil to find floor near 55 as oversupply mostly priced in
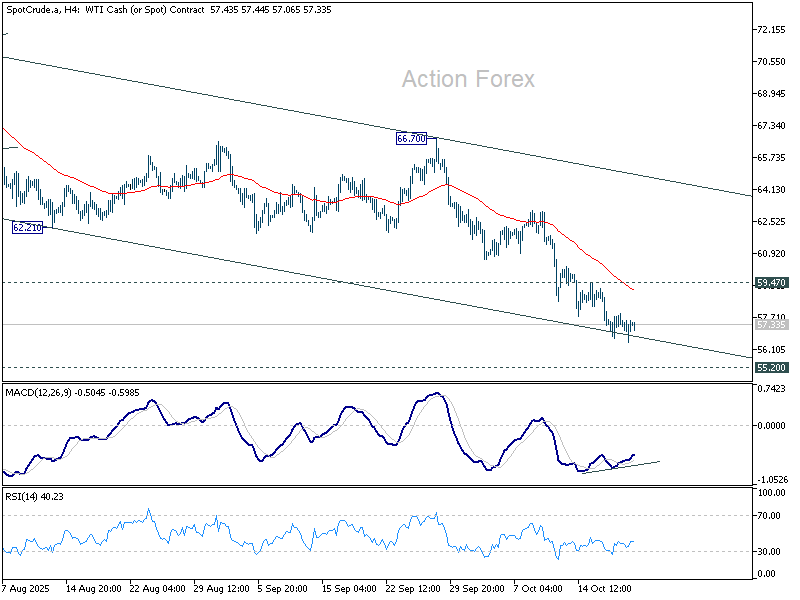
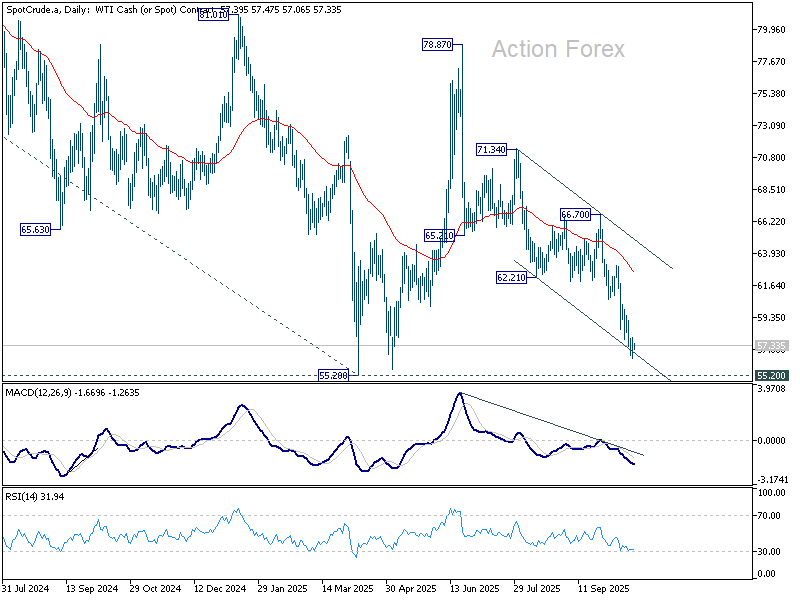
Oil prices continued to drift lower this week but signs are emerging that the pace of decline is easing. With much of the supply glut now likely reflected in prices, there is potential for WTI crude to stabilize around 55 handle, even if near-term weakness extends.
The downtrend persisted since OPEC and its allies started expanding production earlier in the year, and major institutions warn that oversupply may persist well into next year. Last week’s IEA forecast reinforced bearish sentiment, warning that the global oil market could swing into a 4 million barrel-per-day surplus by in. The agency cited sustained output growth and sluggish demand as key drivers.
At the same time, geopolitical backdrop has also turned calmer. Ceasefire between Israel and Hamas helped reduce the Middle East risk premium, dampening prices further as fears of supply disruption fade.
Technically, however, downside momentum in WTI is fading. Bullish convergence is starting to appear in 4H MACD, while WTI is pressing the lower boundary of its near-term descending channel. The 55.20 key support, marking this year’s low from April, may offer strong support and turn WTI into sideway consolidations. Nevertheless, break of 59.47 resistance is needed to indicate short term bottoming, or risk will remain on the downside.
USD/JPY Daily Outlook
Daily Pivots: (S1) 150.29; (P) 150.75; (R1) 151.21; More...
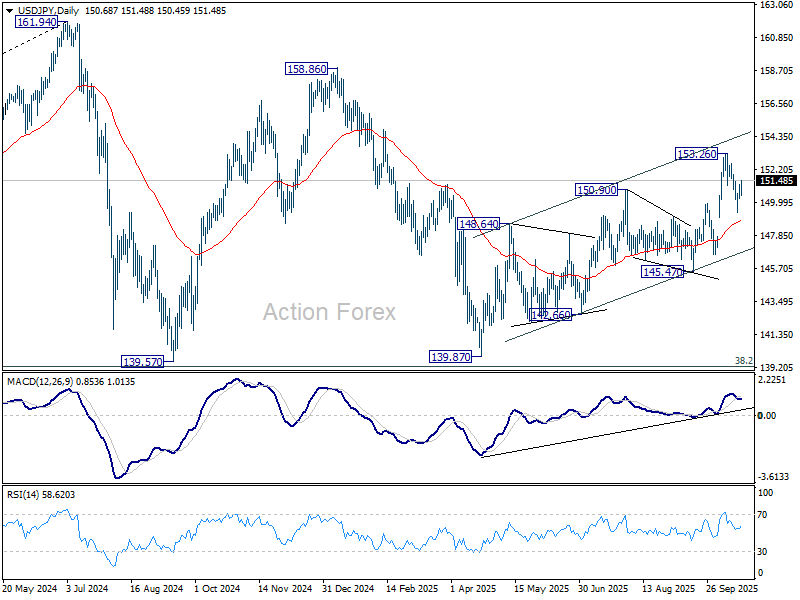
USD/JPY's break of 151.38 minor resistance suggests that corrective pullback form 153.26 has completed at 149.37 already. Intraday bias is back on the upside for retesting 153.26 resistance first. Firm break there will resume whole rise from 139.8y towards 158.86 resistance. On the downside, however, below 149.37 will target 55 D EMA (now at 148.78) instead.
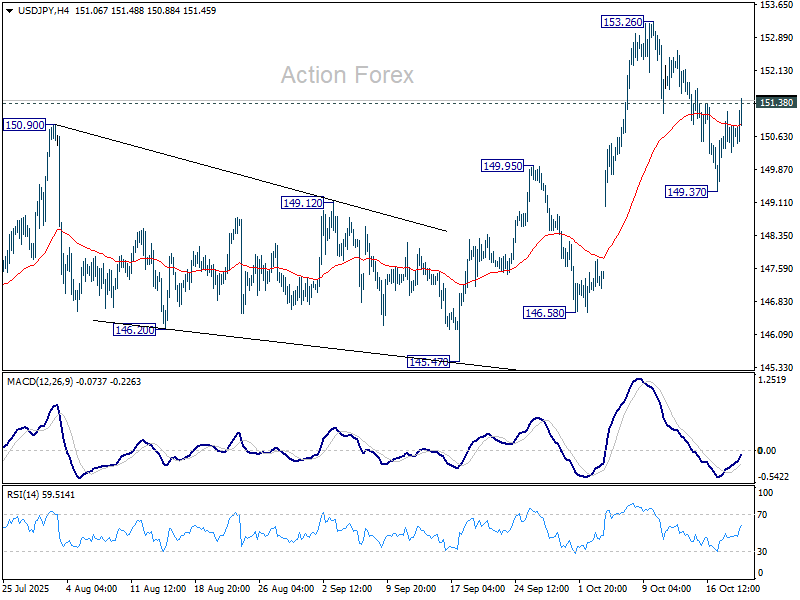
In the bigger picture, current development suggests that corrective pattern from 161.94 (2024 high) has completed with three waves at 139.87. Larger up trend from 102.58 (2021 low) could be ready to resume through 161.94 high. On the downside, break of 145.47 support will dampen this bullish view and extend the corrective pattern with another falling leg.
USD/JPY Daily Outlook
Daily Pivots: (S1) 150.29; (P) 150.75; (R1) 151.21; More...
USD/JPY's break of 151.38 minor resistance suggests that corrective pullback form 153.26 has completed at 149.37 already. Intraday bias is back on the upside for retesting 153.26 resistance first. Firm break there will resume whole rise from 139.8y towards 158.86 resistance. On the downside, however, below 149.37 will target 55 D EMA (now at 148.78) instead.
In the bigger picture, current development suggests that corrective pattern from 161.94 (2024 high) has completed with three waves at 139.87. Larger up trend from 102.58 (2021 low) could be ready to resume through 161.94 high. On the downside, break of 145.47 support will dampen this bullish view and extend the corrective pattern with another falling leg.
AUD/USD Daily Report
Daily Pivots: (S1) 0.6492; (P) 0.6506; (R1) 0.6528; More...
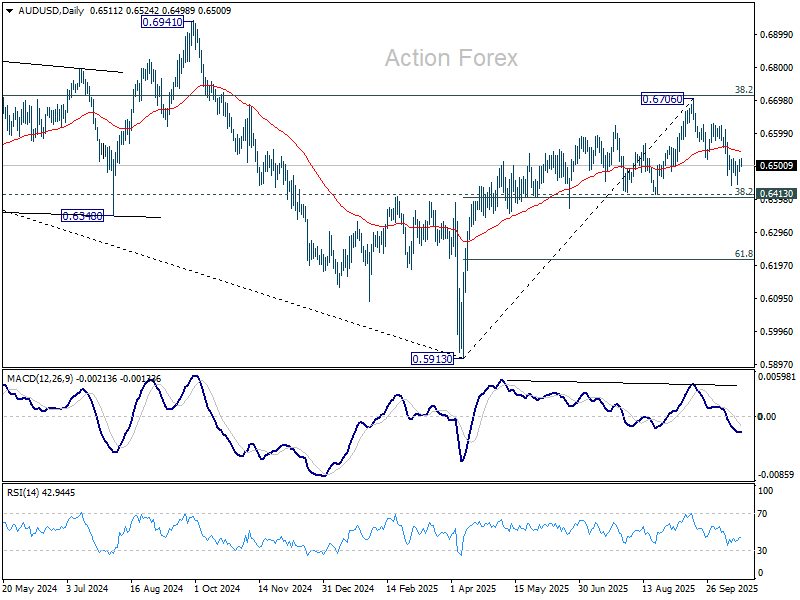
AUD/USD is staying in consolidations above 0.6439 and intraday bias remains neutral. Further decline is in favor as long as 55 D EMA (now at 0.6542) holds. Below 0.6439 will target 0.6413 cluster support (38.2% retracement of 0.5913 to 0.6706 at 0.6403. Decisive break there will indicate bearish reversal after rejection by 0.6713 fibonacci level. Nevertheless, sustained trading above 55 D EMA will keep the rise from 0.5913 intact, and bring retest of 0.6706 high.
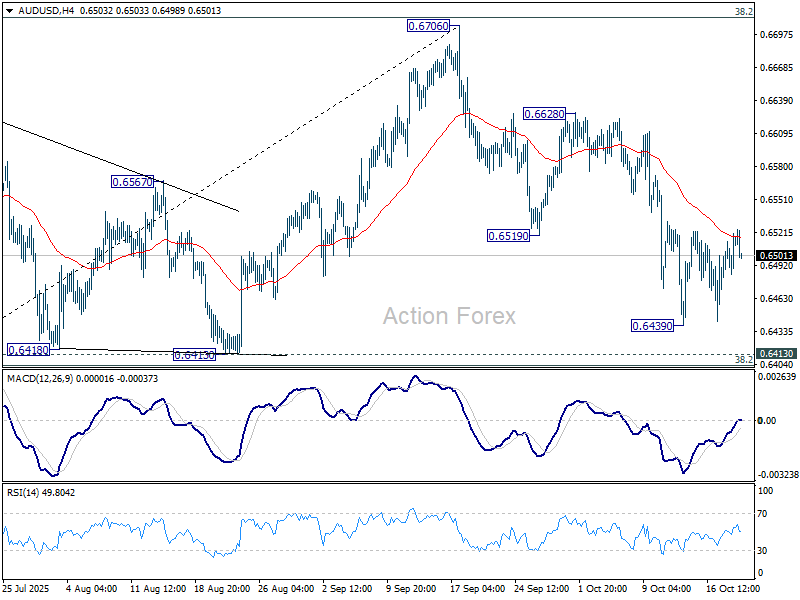
In the bigger picture, there is no clear sign that down trend from 0.8006 (2021 high) has completed. Rebound from 0.5913 is seen as a corrective move. Outlook will remain bearish as long as 38.2% retracement of 0.8006 to 0.5913 at 0.6713 holds. Nevertheless, considering bullish convergence condition in W MACD, sustained break of 0.6713 will be a strong sign of bullish trend reversal, and pave the way to 0.6941 structural resistance for confirmation.
USD/CAD Daily Outlook
Daily Pivots: (S1) 1.4014; (P) 1.4032; (R1) 1.4059; More...
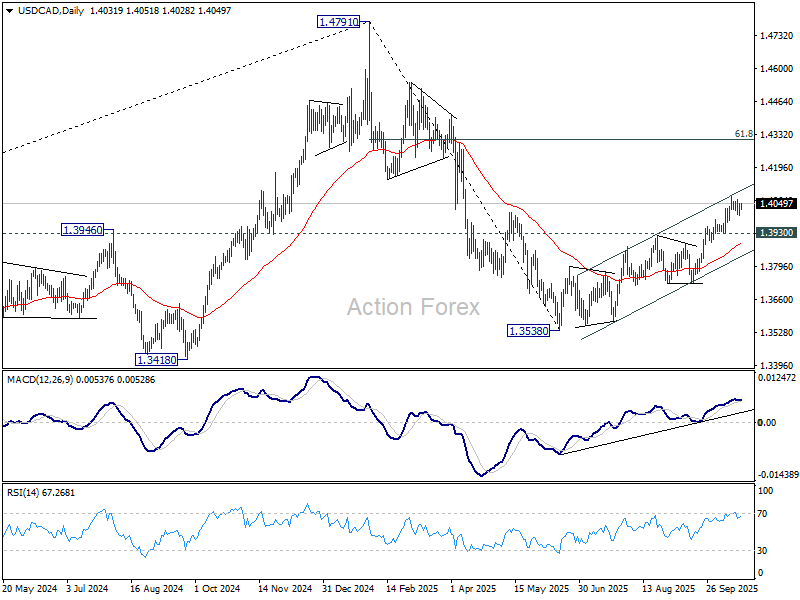
USD/CAD is still extending consolidations below 1.4078 and intraday bias stays neutral. Further rally is expected as long as 1.3930 support holds. Current development suggest that rise from 1.3538 is reversing whole fall from 1.4791. Above 1.4078 will target 61.8% retracement of 1.4791 to 1.3538 at 1.4312.
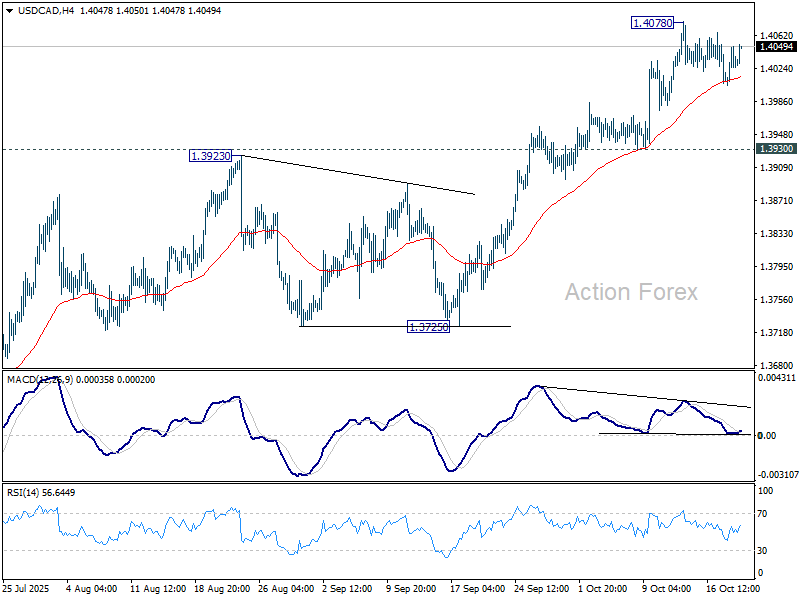
In the bigger picture, price actions from 1.4791 medium term top is likely just unfolding as a correction to up trend from 1.2005 (2021 low). Based on current momentum, rise from 1.3538 is the second leg, and a third leg should follow before up trend resumption. That is, range trading is set to extend for the medium term. For now, this will remain the favored case as long as 1.3725 support holds.
GBP/JPY Daily Outlook
Daily Pivots: (S1) 201.58; (P) 202.35; (R1) 202.86; More...
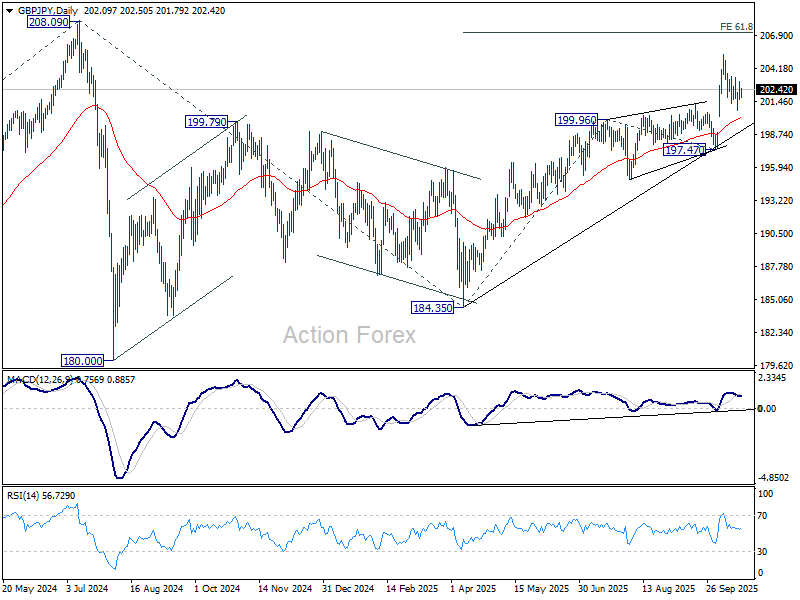
Outlook in GBP/JPY is unchanged and intraday bias stays neutral. On the upside, above 203.41 will suggest that pullback from 205.30 has completed, and bring retest of this high. Firm break there will resume larger rally to 61.8% projection of 184.35 to 199.96 from 197.47 at 207.11. However, break of 200.67 and sustained trading below 201.24 resistance turned support will raise the chance of bearish reversal, and bring deeper decline to 197.47 instead.
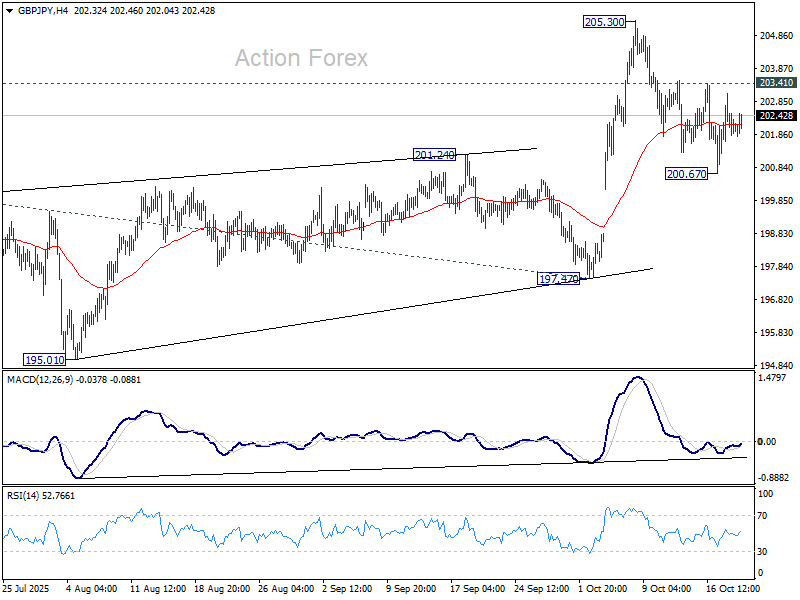
In the bigger picture, price actions from 208.09 (2024 high) are seen as a corrective pattern which might have completed at 184.35. Firm break of 208.09 high will resume the up trend from 123.94 (2020 low). Next target is 61.8% projection of 148.93 to 208.09 from 184.35 at 220.90. However, decisive break of 197.47 will dampen this view and could extend the corrective pattern with another fall.
EUR/JPY Daily Outlook
Daily Pivots: (S1) 175.07; (P) 175.72; (R1) 176.19; More...
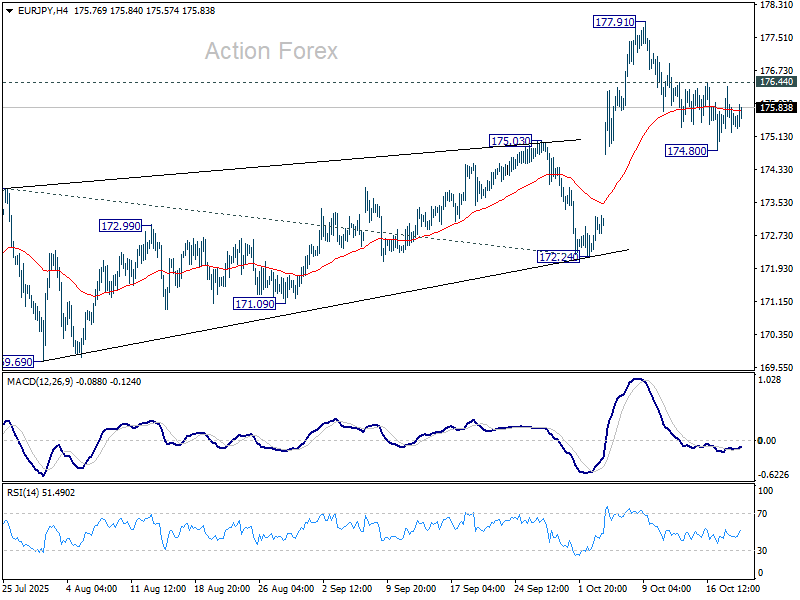
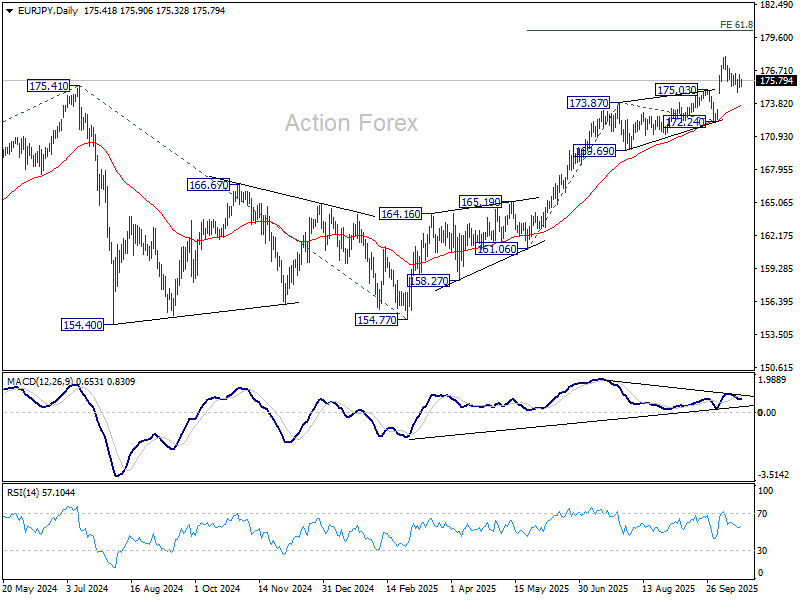
No change in EUR/JPY's outlook and intraday bias stays neutral. On the upside, break of 176.44 resistance will suggest that pullback from 177.91 has completed, and bring retest of this high. Further break of 177.91 will resume larger up trend to 61.8% projection of 161.06 to 173.87 from 172.24 at 180.15 next. However, break of 174.80 and sustained trading below 175.03 resistance turned support will indicate that it's already in a larger scale correction, and target 172.24 support.
In the bigger picture, up trend from 114.42 (2020 low) is in progress and should target 61.8% projection of 124.37 to 175.41 from 154.77 at 186.31. Firm break of 172.24 support will suggests that it has turned into consolidations again. But still, outlook will continue to stay bullish as long as 55 W EMA (now at 167.43) holds, even in case of deep pullback.
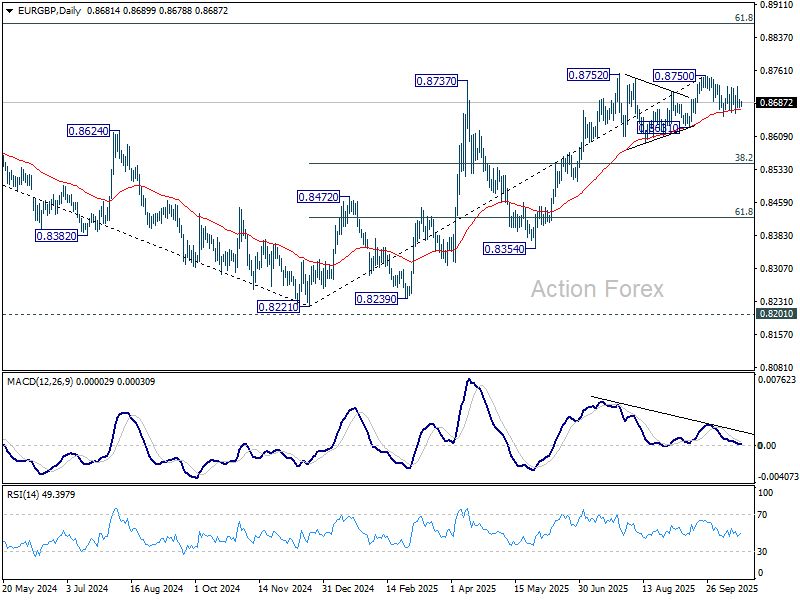
EUR/GBP Daily Outlook
Daily Pivots: (S1) 0.8676; (P) 0.8686; (R1) 0.8695; More…
Intraday bias in EUR/GBP remains neutral as sideway trading continues. On the downside, break of 0.8654 will resume the fall from 0.8750. Decisive break there will indicate bearish reversal and target 38.2% retracement of 0.8221 to 0.8750 at 0.8548. Nevertheless, on the upside, break of 0.8750/2 will resume the rise from 0.8221 towards 0.8867 fibonacci level.
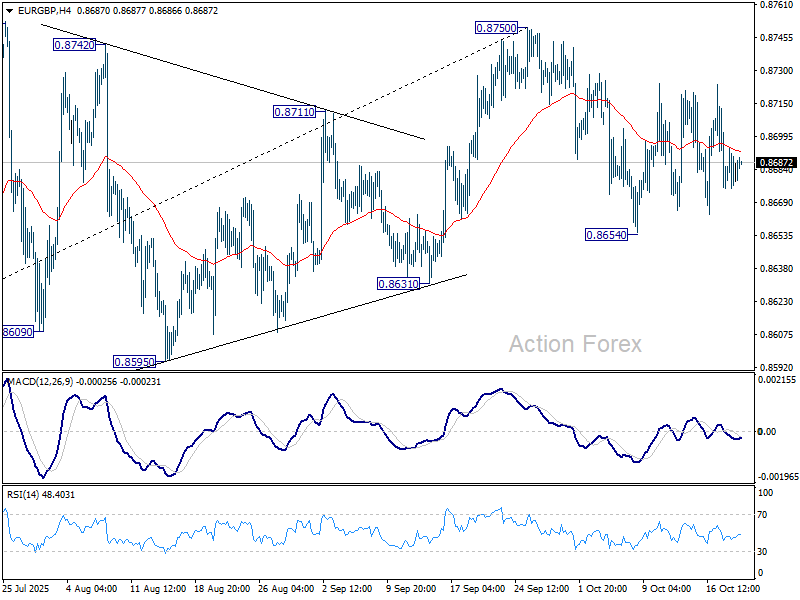
In the bigger picture, rise from 0.8221 medium term bottom is seen as a corrective move. While further rally cannot be ruled out, upside should be limited by 61.8% retracement of 0.9267 to 0.8221 at 0.8867. Considering bearish divergence condition in D MACD, firm break of 0.8631 support will be the first sign that this corrective bounce has completed. Sustained trading below 55 W EMA (now at 0.8549) will confirm, and bring retest of 0.8221 low.