
Sample Category Title
Stronger Canada CPI Narrows Odds of Back-to-Back BoC Easing
Canadian Dollar climbed across the board as markets enter into U.S. session, leading major currencies higher after domestic inflation data came in hotter than expected. Combined with this month’s firm employment figures, the data have made the case for a rate cut at the October 29 meeting a close call.
While the BoC maintain an easing bias and markets still expect more cuts ahead, the latest figures may prompt the BoC to pause this month and reserve ammunition for December, especially with signs that the domestic economy remains more resilient than feared.
Meanwhile, Yen stayed under sustained selling pressure. In a landmark parliamentary vote, Sanae Takaichi, leader of the ruling Liberal Democratic Party, was formally elected as Japan’s first female prime minister. The LDP’s new coalition partner, the Japan Innovation Party, helped deliver a comfortable win as opposition parties failed to field a unified challenger.
Takaichi swiftly unveiled her new Cabinet, naming Ryosei Akazawa, Japan’s chief tariff negotiator with the U.S., as trade minister to maintain momentum in bilateral talks. The new administration faces an immediate diplomatic challenge — the upcoming visit by U.S. President Donald Trump, which will test Japan’s approach to the ongoing tariff discussions and its broader defense cooperation with Washington.
Trade tensions between the U.S. and China remain another focal point. Chinese customs data showed rare earth magnet exports to the U.S. fell -28.7% mom in September to 420.5 tonnes — nearly 30% below last year’s levels. Reports suggest China tightened licensing procedures for rare earth exports in September, ahead of a broader regulatory expansion implemented in October. The move underscores Beijing’s intention to use resource controls as leverage in trade disputes, while Washington continues to forge strategic mineral alliances with partners such as Australia.
In currency markets, Loonie stands out as the day’s top performer, followed by Dollar and Sterling. Yen remains the weakest, trailed by the Swiss franc and Kiwi. Aussie and Euro trade in the middle of the pack.
In Europe, at the time of writing, FTSE is up 0.31%. DAX is up 0.17%. CAC is up 0.44%. UK 10-year yield is down -0.022 at 4.492. Germany 10-year yield is down -0.007 at 2.573. Earlier in Asia, Nikkei rose 0.27%. Hong Kong HSI rose 0.65%. China Shanghai SSE rose 1.36%. Singapore Strait Times rose 1.20%. Japan 10-year JGB yield fell -0.006 to 1.663.
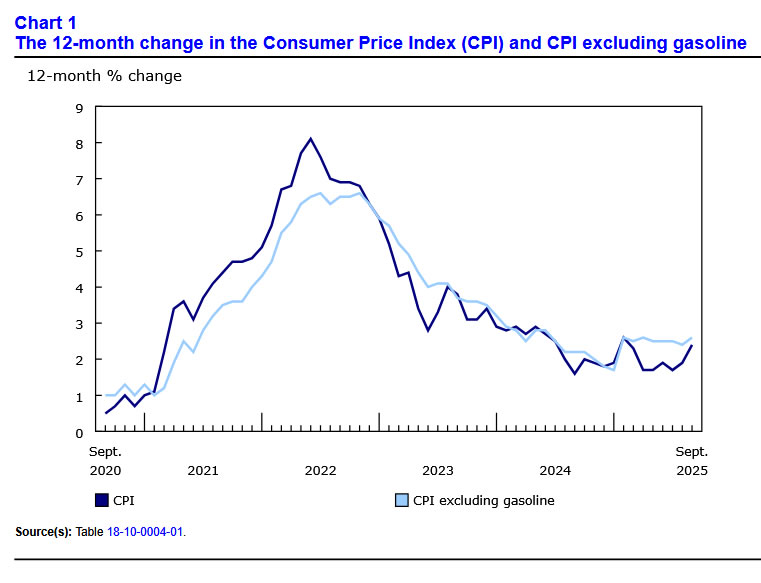
Canada CPI surges to 2.4% in September, core measures accelerate too
Canada’s consumer prices accelerated more than expected in September. Headline CPI rose 2.4% yoy, up sharply from 1.9% in August and above consensus of 2.3%. The rebound was largely driven by a smaller year-ago decline in gasoline prices — down -4.1% compared with -12.7% in August — which created a notable base effect in the annual calculation.
Even so, underlying inflation momentum also firmed. Excluding gasoline, CPI rose 2.6% yoy, up from 2.4% in the previous month, signaling broader price pressures beyond energy. All three core inflation measures came in hotter than anticipated. CPI median held steady at 3.2%, beating expectations of 3.0%. CPI trimmed ticked up from 3.0% to 3.1%. CPI common accelerated from 2.5% yoy to 2.7%.
New Zealand trade deficit widens NZD -14B despite strong 19% export growth
New Zealand recorded another sizeable trade deficit in September 2025, as import growth outstripped exports despite solid overseas demand. Statistics NZ data showed goods exports rose 19% yoy to NZD 5.8B. Imports increased 1.6% yoy to NZD 7.2B. The result was a monthly deficit of NZD -1.4B, versus expectation of NZD -6B and prior month's NZD -1.2B.
Export strength was broad-based, led by double-digit gains to all major partners. Shipments to China jumped 24% yoy, Australia 28%, and Japan 23%, while sales to the U.S. and EU rose 10% and 15%, respectively.
On the import side, purchases from China climbed 16% yoy, while inflows from the EU and Australia rose 7.3% and 6.4%. Offsetting that, imports from the U.S. slumped -30%, and South Korea fell -4.8%.
USD/CAD Mid-Day Outlook
Daily Pivots: (S1) 1.4014; (P) 1.4032; (R1) 1.4059; More...
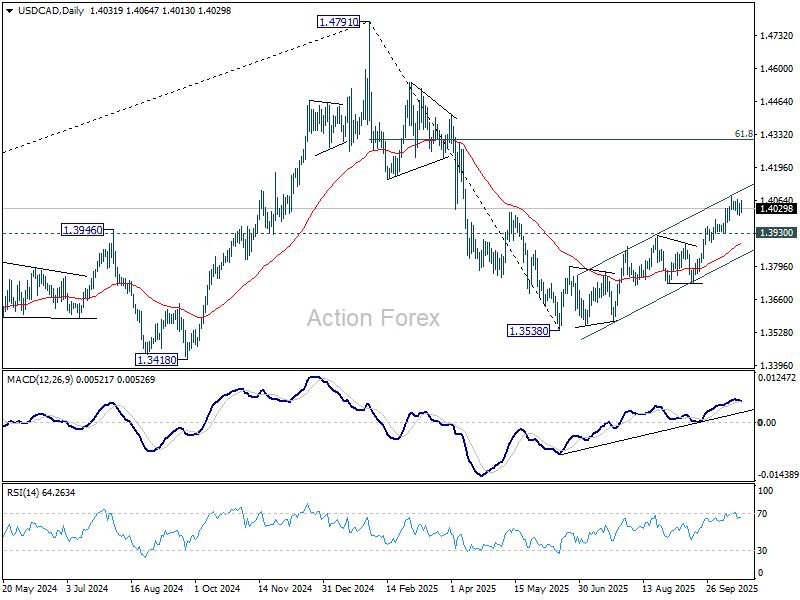
USD/CAD dips mildly in early US session, but stays well above 1.3930. Intraday bias remains neutral for more consolidations below 1.4078. But further rally is still expected as long as 1.3930 support holds. Current development suggest that rise from 1.3538 is reversing whole fall from 1.4791. Above 1.4078 will target 61.8% retracement of 1.4791 to 1.3538 at 1.4312.
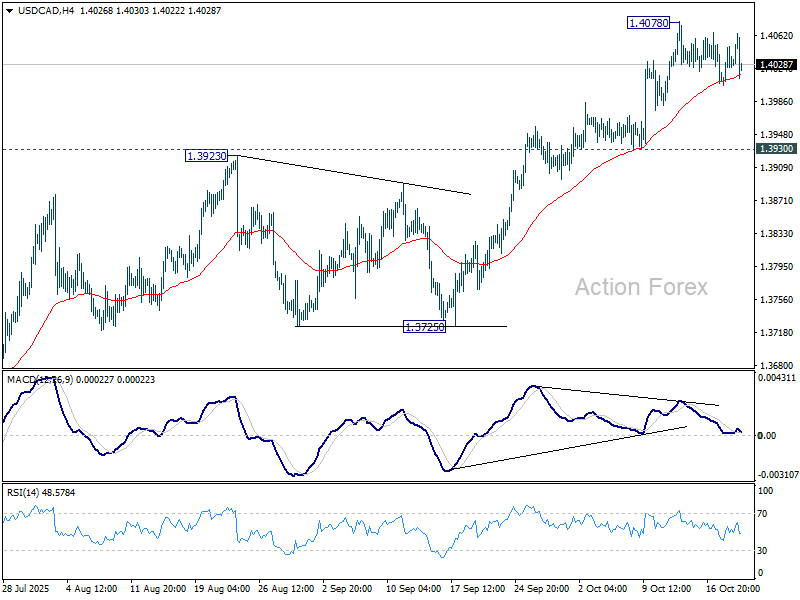
In the bigger picture, price actions from 1.4791 medium term top is likely just unfolding as a correction to up trend from 1.2005 (2021 low). Based on current momentum, rise from 1.3538 is the second leg, and a third leg should follow before up trend resumption. That is, range trading is set to extend for the medium term. For now, this will remain the favored case as long as 1.3725 support holds.
Canada CPI surges to 2.4% in September, core measures accelerate too
Canada’s consumer prices accelerated more than expected in September. Headline CPI rose 2.4% yoy, up sharply from 1.9% in August and above consensus of 2.3%. The rebound was largely driven by a smaller year-ago decline in gasoline prices — down -4.1% compared with -12.7% in August — which created a notable base effect in the annual calculation.
Even so, underlying inflation momentum also firmed. Excluding gasoline, CPI rose 2.6% yoy, up from 2.4% in the previous month, signaling broader price pressures beyond energy. All three core inflation measures came in hotter than anticipated. CPI median held steady at 3.2%, beating expectations of 3.0%. CPI trimmed ticked up from 3.0% to 3.1%. CPI common accelerated from 2.5% yoy to 2.7%.
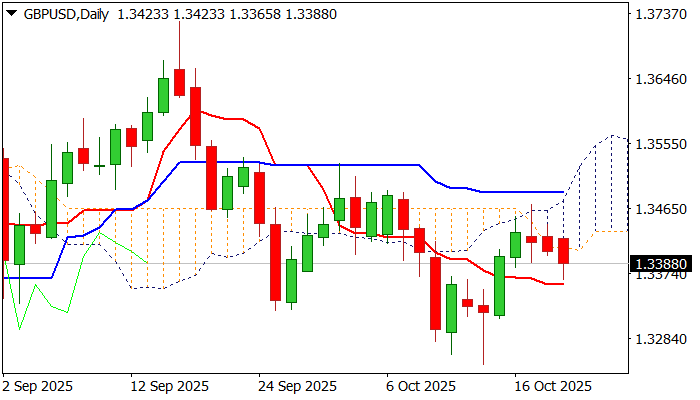
GBPUSD – Biased Lower While Below Thickening Daily Cloud
Cable remains in red for the third straight day with fresh weakness on Tuesday, pointing to negative signals developing on daily chart.
Friday’s false break above daily cloud, left Doji candle with longer upper shadow and subsequent drop returned below cloud base, adding to negative signals.
Fresh bears need repeated close below the cloud base as minimum requirement, with thickening cloud providing pressure.
Violation of daily Tenkan-sen (1.3360) to confirm and expose last week’s spike low at 1.3248.
Negative momentum studies on daily chart contribute to scenario.
Cloud base (1.3406) marks solid resistance, although return and close within the cloud would sideline downside prospects.
Dily Kijun-sen reinforces cloud top (1.3487) which marks upper trigger, break of which would bring bulls in play.
Res: 1.3406; 1.3471; 1.3487; 1.3527
Sup: 1.3360; 1.3323; 1.3311; 1.3261
EUR/USD Under Downward Pressure
The euro is facing sustained selling pressure, primarily driven by a robust US dollar. The greenback is being bolstered by rising Treasury yields and fading market expectations for an early start to the Federal Reserve’s easing cycle.
Further weighing on the single currency are disappointing macroeconomic releases from Germany, coupled with ongoing uncertainty over US–EU trade disputes, which have been reignited by new initiatives from the Trump administration.
Additionally, investors are beginning to price in fiscal risks within the eurozone, fuelled by budgetary disagreements involving Italy and France. Collectively, these factors create an unfavourable backdrop for the euro in the near term.
Technical Analysis: EUR/USD
H4 Chart:
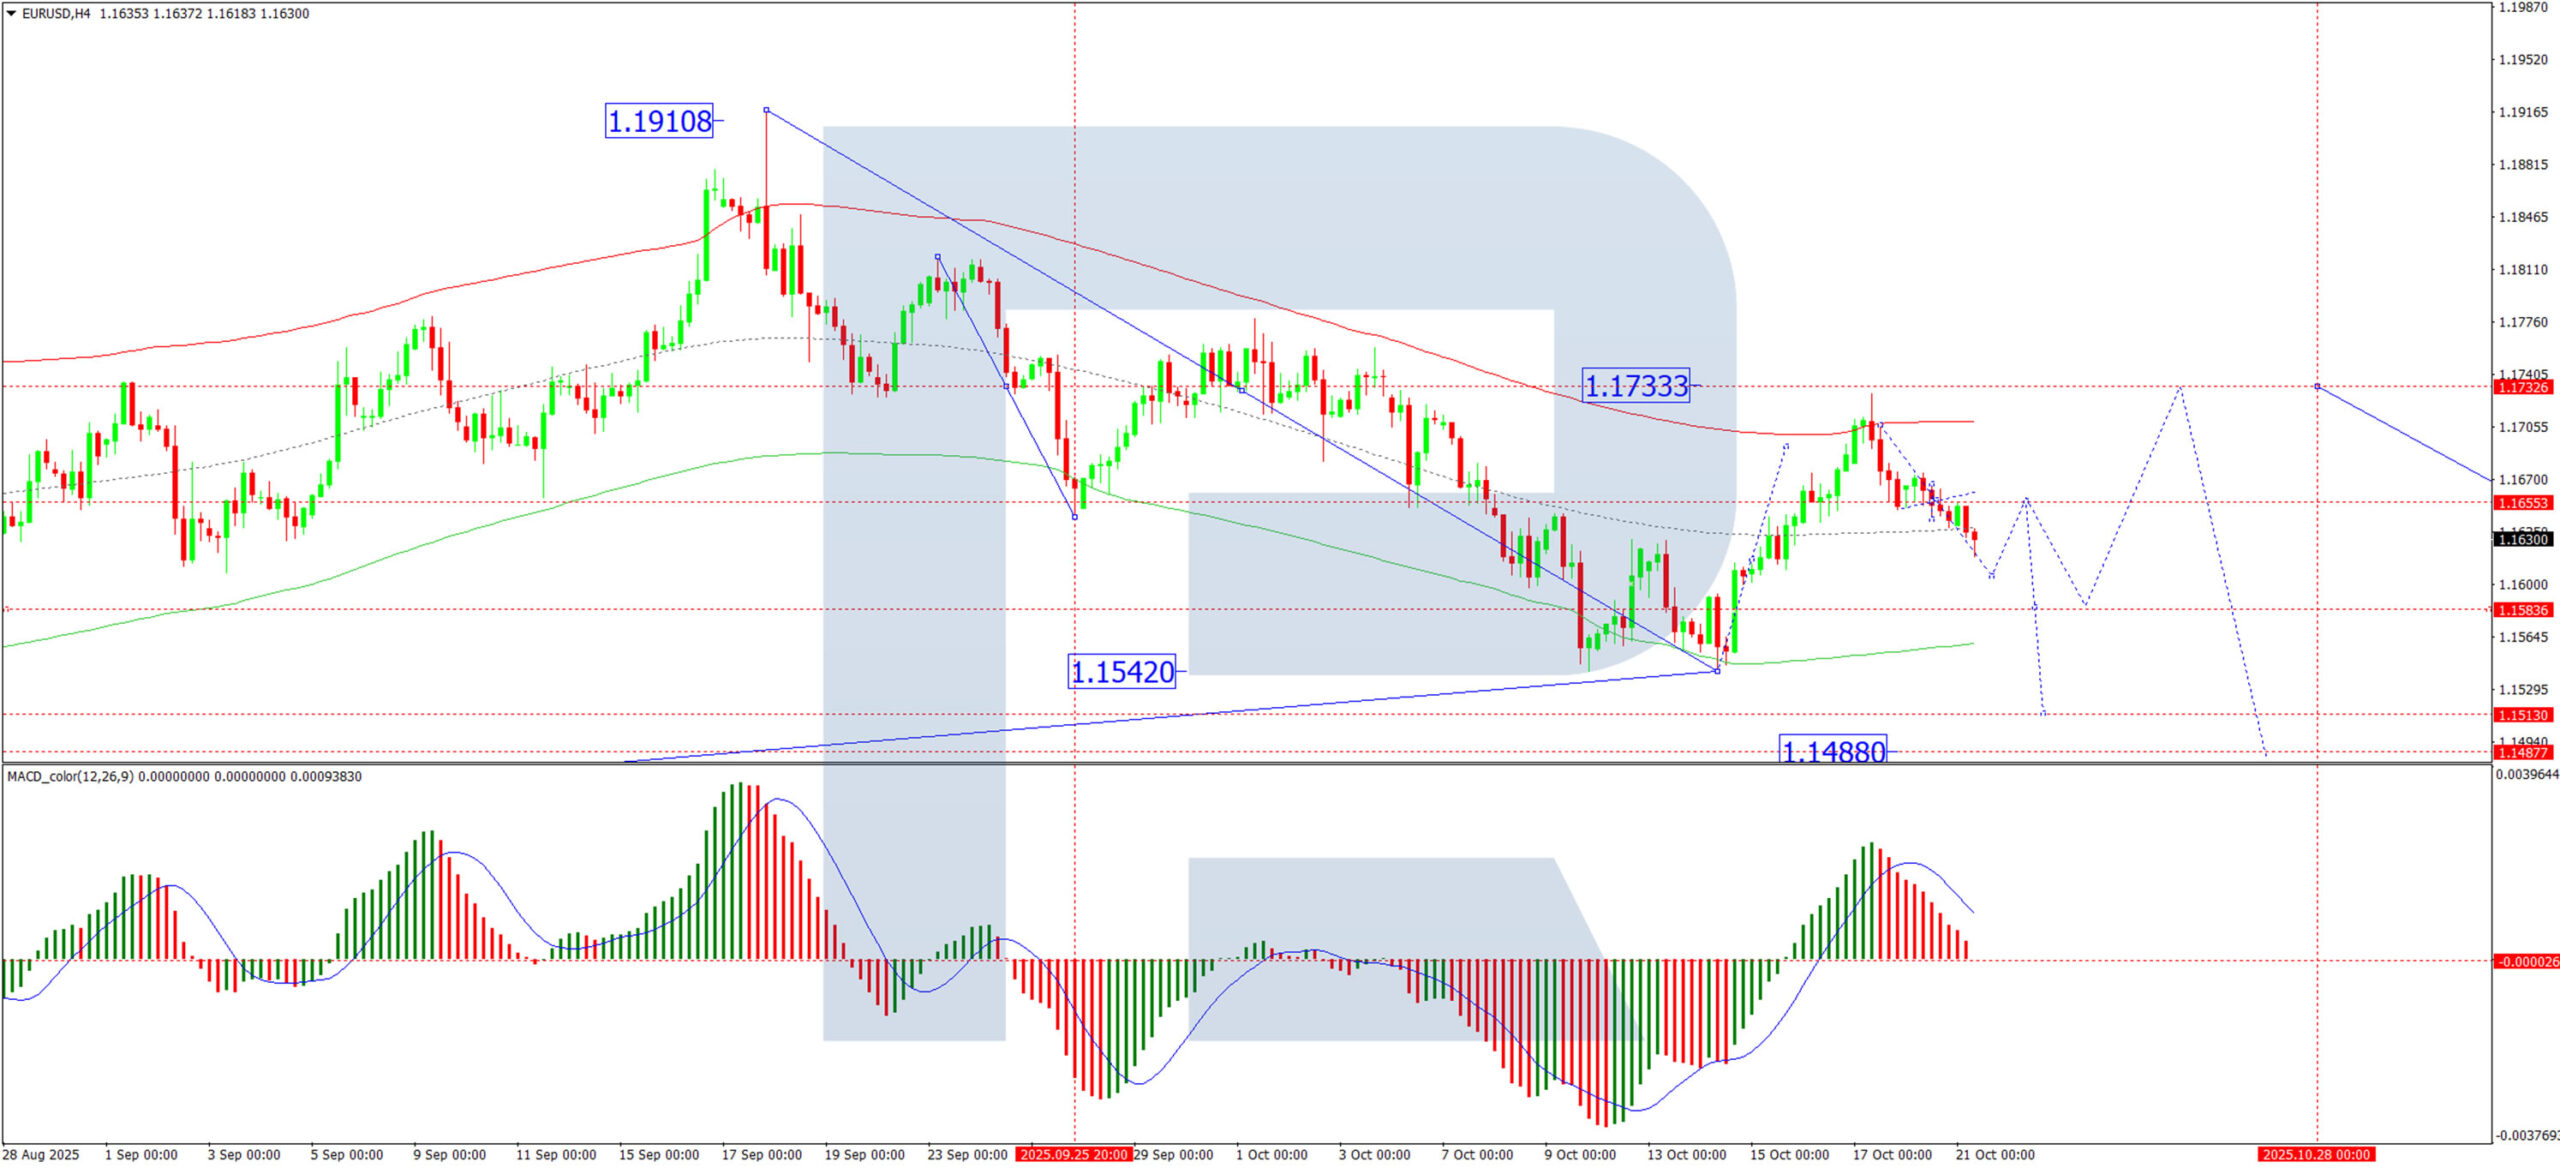
On the H4 chart, EUR/USD has been forming a broad consolidation range around the 1.1656 level. The pair is currently trading below this pivot, with initial bearish targets at 1.1606 and 1.1568. A retest of the range’s upper boundary towards 1.1733 remains a possibility. However, a decisive break below the current consolidation would open the potential for a deeper decline towards 1.1488, with a subsequent extension to 1.1400. This bearish technical picture is confirmed by the MACD indicator, whose signal line, while above zero, is pointing decisively downwards, indicating that bearish momentum is prevailing.
H1 Chart:
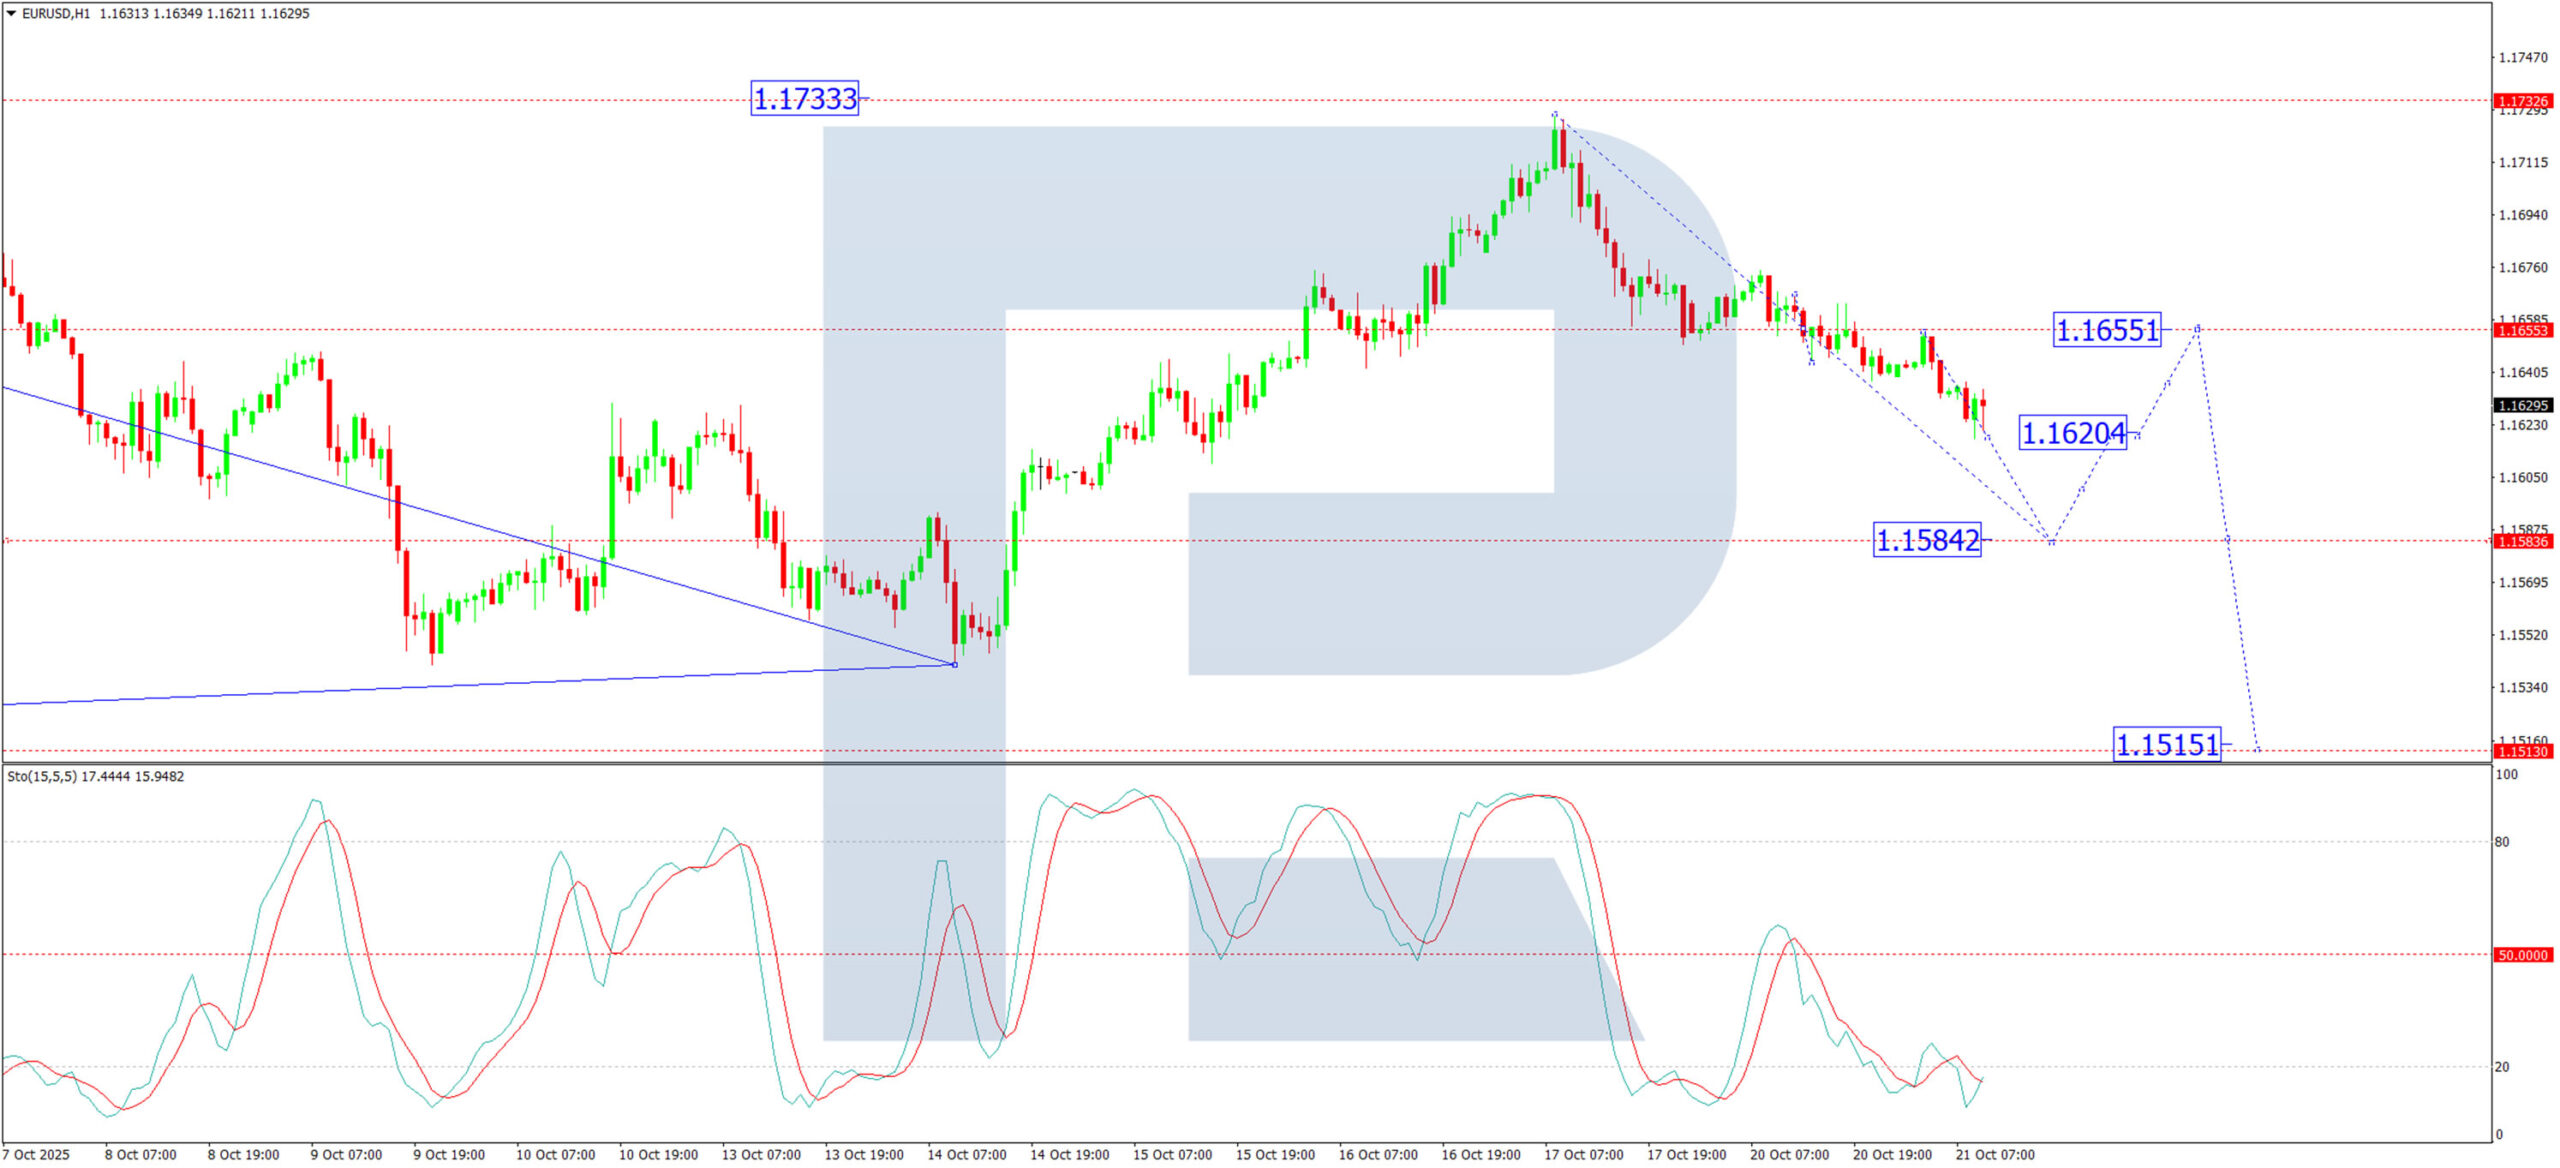
The H1 chart shows the pair breaking downwards from a tight consolidation around 1.1655. This move signals the likely completion of a corrective phase and the start of a fresh leg lower. The initial downside target is at least 1.1584. This view is supported by the Stochastic oscillator, whose signal line is below 50 and is holding near the 20 level, reflecting strong near-term bearish momentum.
Conclusion
The fundamental and technical outlook for EUR/USD both point to further downside. While a technical correction is always possible, the path of least resistance appears lower, with key support levels at 1.1584 and 1.1488 in focus.
Natural Gas: How Sellers Booked Profits Amid Imminent Resurgence
Hello traders. Welcome to another blog post where we discuss trade setups shared with Elliottwave_Forecast members. In this one, the spotlight will be on Natural Gas.
On the weekly chart, Natural Gas completed the third wave of a long-term bearish cycle in March 2024, forming an impulse wave that started in August 2022. As a result, from the March 2024 low, a new long-term bullish cycle began. This cycle could last for several years and may push prices well above the $10 mark. However, while an impulse sequence is expected from March 2024, traders and investors should anticipate at least a three-wave bounce. The first sub-wave — an impulse structure — started at the March 2024 low and completed at the 2025 peak.
According to Elliott Wave Theory, a three-wave correction usually follows a five-wave advance. That’s exactly what is happening now. The pullback from the March 2025 top appears corrective and should end above the March 2024 low. Therefore, our focus over the past few months has been on this corrective cycle from March 2025.
From our weekly and daily chart updates, we identified a double zigzag corrective pattern unfolding from the March 2025 high. Wave (W) ended in April 2025, and wave (X) ended in June 2025. Thus, we expect wave (Y) to extend toward 2.10–1.619 to complete the entire bearish cycle.
Wave A of (Y) ended with a five-wave structure below the April 2025 low (wave (W) low). Then, a corrective bounce followed. When that bounce began, we explained in the live trading room why we preferred to sell at the extreme for wave B of (Y). Once the bounce matured, we shared the H4 chart update on October 6, 2025.
Natural Gas Trade Setup – 10-06-2025
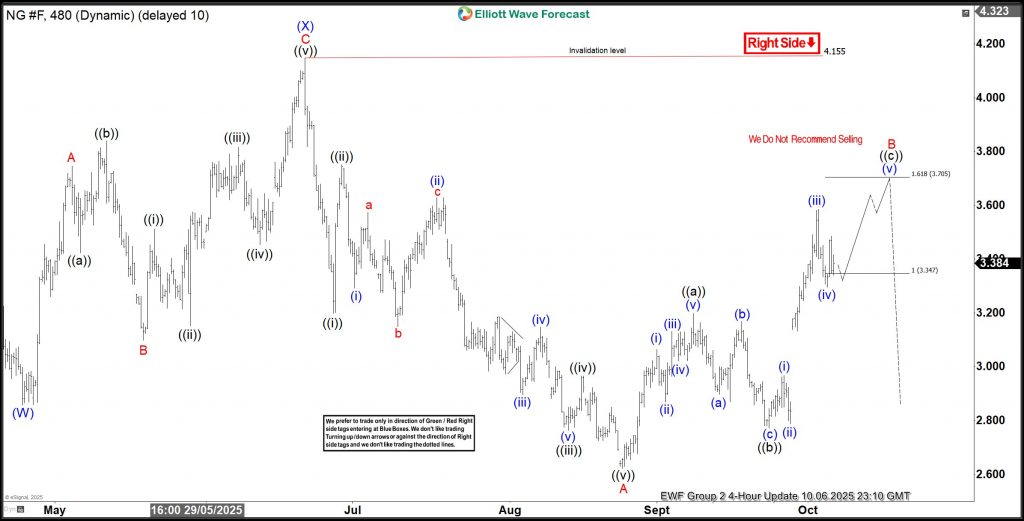
On 6th October, 2025, we shared the chart above. Wave B emerged higher as a simple 3-wave zigzag structure. We identify the extreme zone at 3.347-3.705 to members. In the live trading room and daily technical videos, we recommended to members to go short for a short term counter-trend trade (remember, NG is in a corrective phase).
Natural Gas Trade Setup – 10-16-2025
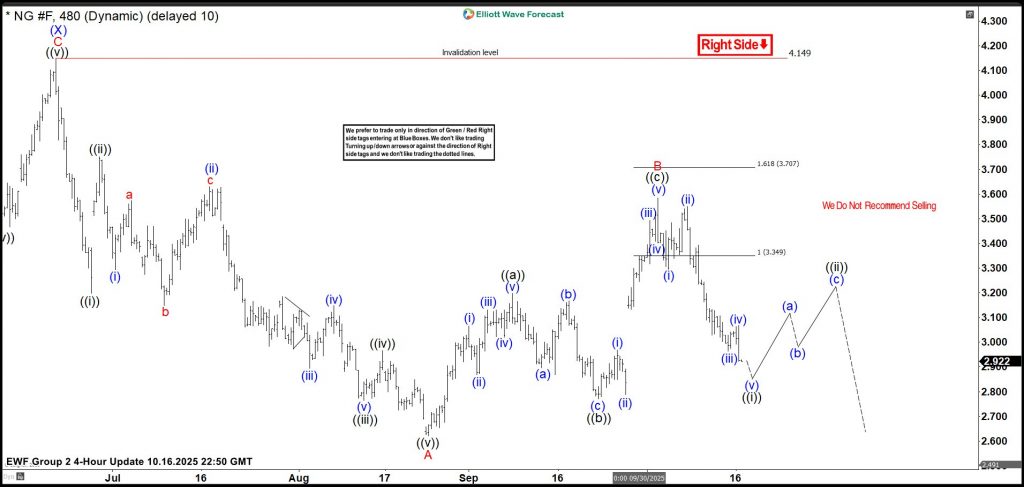
On October 16, 2025, we shared the chart above with members, showing a bearish reaction from the marked extreme zone. At that point, a five-wave decline was developing and nearing completion. Members in the live trading room had already taken partial profits at the first target and moved the rest of the position to breakeven. This step ensures a risk-free trade in case a strong bounce follows, as corrective markets can sometimes appear complete before extending further.
Bitcoin: Bull Market May Be in Final Stages
Market Overview
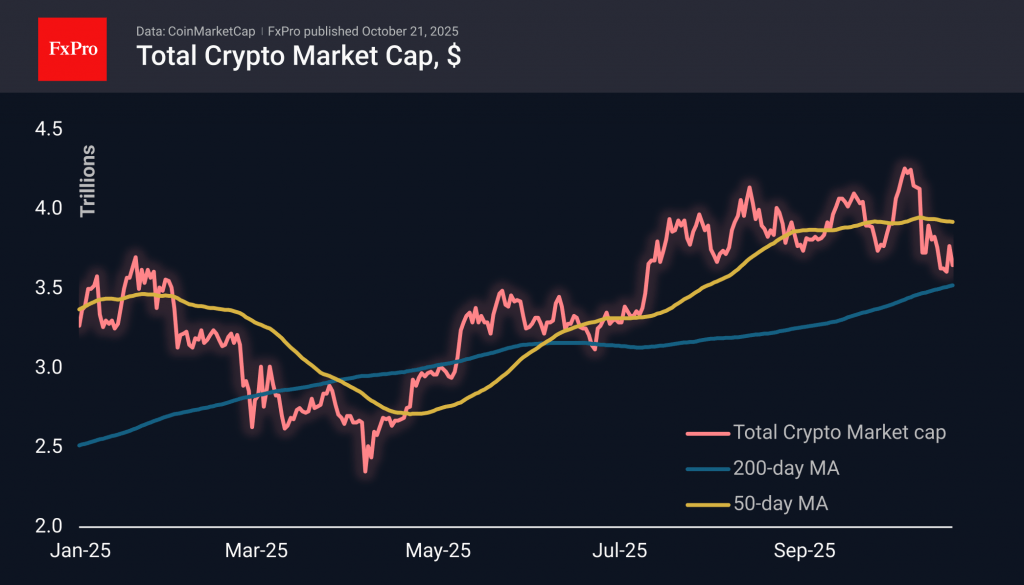
The crypto market capitalisation fell by 3.1% to $3.65 trillion during the day. The bulls failed to push the market above the recent highs of $3.95 trillion, and we are seeing the formation of an active short-term downtrend. This will be confirmed if the next local low is $3.35 trillion. These levels are already below the 200-day average, which will attract the attention of long-term sellers. So, we continue to closely monitor market dynamics near $3.5 trillion, where a meaningful moving average is located.
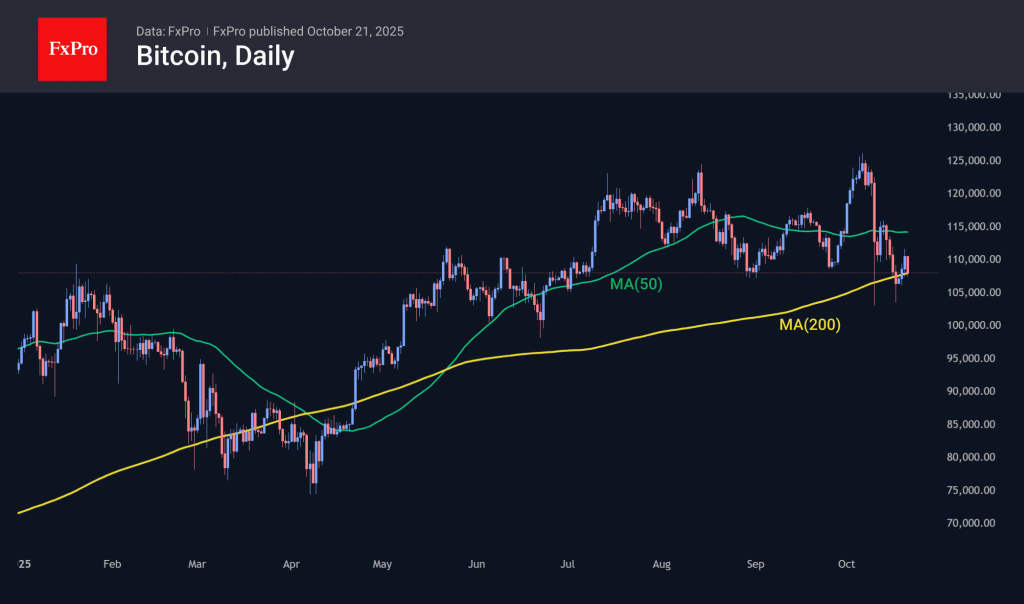
Bitcoin at $108K has again fallen to its 200-day moving average. It is pointing upwards and is now 30% higher than the levels seen in March-April, when BTC last dipped below it. The spring scenario of prolonged consolidation around a critical line and a further breakout now looks like a hopeful scenario for bulls. However, there are still risks that the first prerequisites for the next prolonged bear market are forming.
News Background
BTC’s rebound from its lows is encouraging, but the structure remains fragile. The decline in trading volumes on spot platforms and derivatives markets signals a decline in confidence and demand, according to Glassnode.
According to Galaxy Digital CEO Mike Novogratz, the recent sharp correction in the crypto market is unrelated to manipulation. According to him, the leading sellers were long-term investors and miners.
Sixty-seven per cent of institutional investors are optimistic about Bitcoin’s prospects for the next three to six months, according to a Coinbase Institutional survey of 124 respondents. At the same time, 45% of institutional investors believe the bull market is in its late stages.
Publicly traded companies continue to build up their crypto reserves. Strategy acquired 168 BTC over the past week. BitMine bought 203,826 ETH.
According to Jefferies, in September, the profitability of BTC mining fell by more than 7%, and the daily income per 1 EH/s of hash rate decreased from $56,000 to $52,000. In October, a sharp correction in the asset increased pressure on the economics of its mining.
USD/JPY Analysis: Yen May Stabilise Following Prime Minister’s Election
According to media reports, conservative politician Sanae Takaichi has been elected Japan’s first female Prime Minister. As we noted on 7 October, she is a supporter of former Prime Minister Shinzo Abe’s Abenomics strategy, aimed at stimulating the economy through aggressive fiscal spending and ultra-loose monetary policy — a factor that fuelled the sharp A→B rally to an eight-month high.
Meanwhile, the most likely candidate for the position of Finance Minister is Satsuki Katayama, a former Minister for Regional Revitalisation, who has previously expressed support for a stronger yen.
Fluctuations on the USD/JPY chart reflect the uncertainty traders currently face as they attempt to gauge the future direction of the Bank of Japan’s monetary policy.
Technical Analysis of the USD/JPY Chart
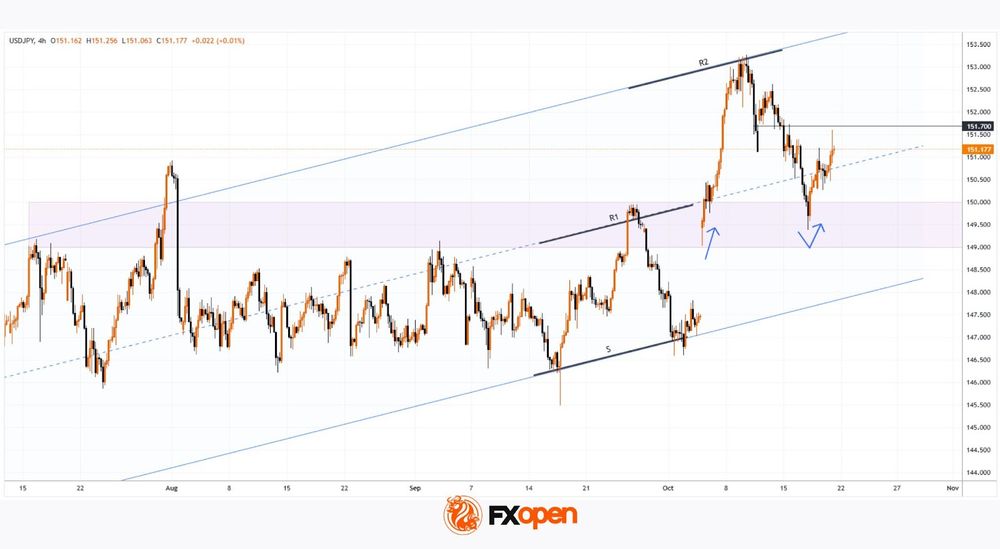
The yen’s sharp weakening, which began on 6 October, led to:
→ the formation of a bullish gap around the 147.5–149 area;
→ an expansion of the previously established R1–S channel to R2–S.
After reversing from the R2 resistance level, the pair fell back towards the R1 line, which now acts as the channel’s median — a zone where supply and demand tend to balance. This supports the view that USD/JPY could stabilise in the near term.
From a bullish perspective:
→ The key 149–150 area (highlighted in purple) has shifted from resistance to support (as shown by the blue arrows).
From a bearish perspective:
→ Price action between 15 and 21 October indicates that sellers remain in control near the 151.7 level.
In this context, reduced volatility and consolidation of USD/JPY around the ¥151 per dollar level appear to be the most likely scenario — though this could change abruptly in response to major political announcements regarding the new cabinet or the Bank of Japan’s policy stance.
Trade over 50 forex markets 24 hours a day with FXOpen. Take advantage of low commissions, deep liquidity, and spreads from 0.0 pips. Open your FXOpen account now or learn more about trading forex with FXOpen.
This article represents the opinion of the Companies operating under the FXOpen brand only. It is not to be construed as an offer, solicitation, or recommendation with respect to products and services provided by the Companies operating under the FXOpen brand, nor is it to be considered financial advice.
Nikkei Futures (NKD) Reach Historic Highs, Extending Bullish Rally
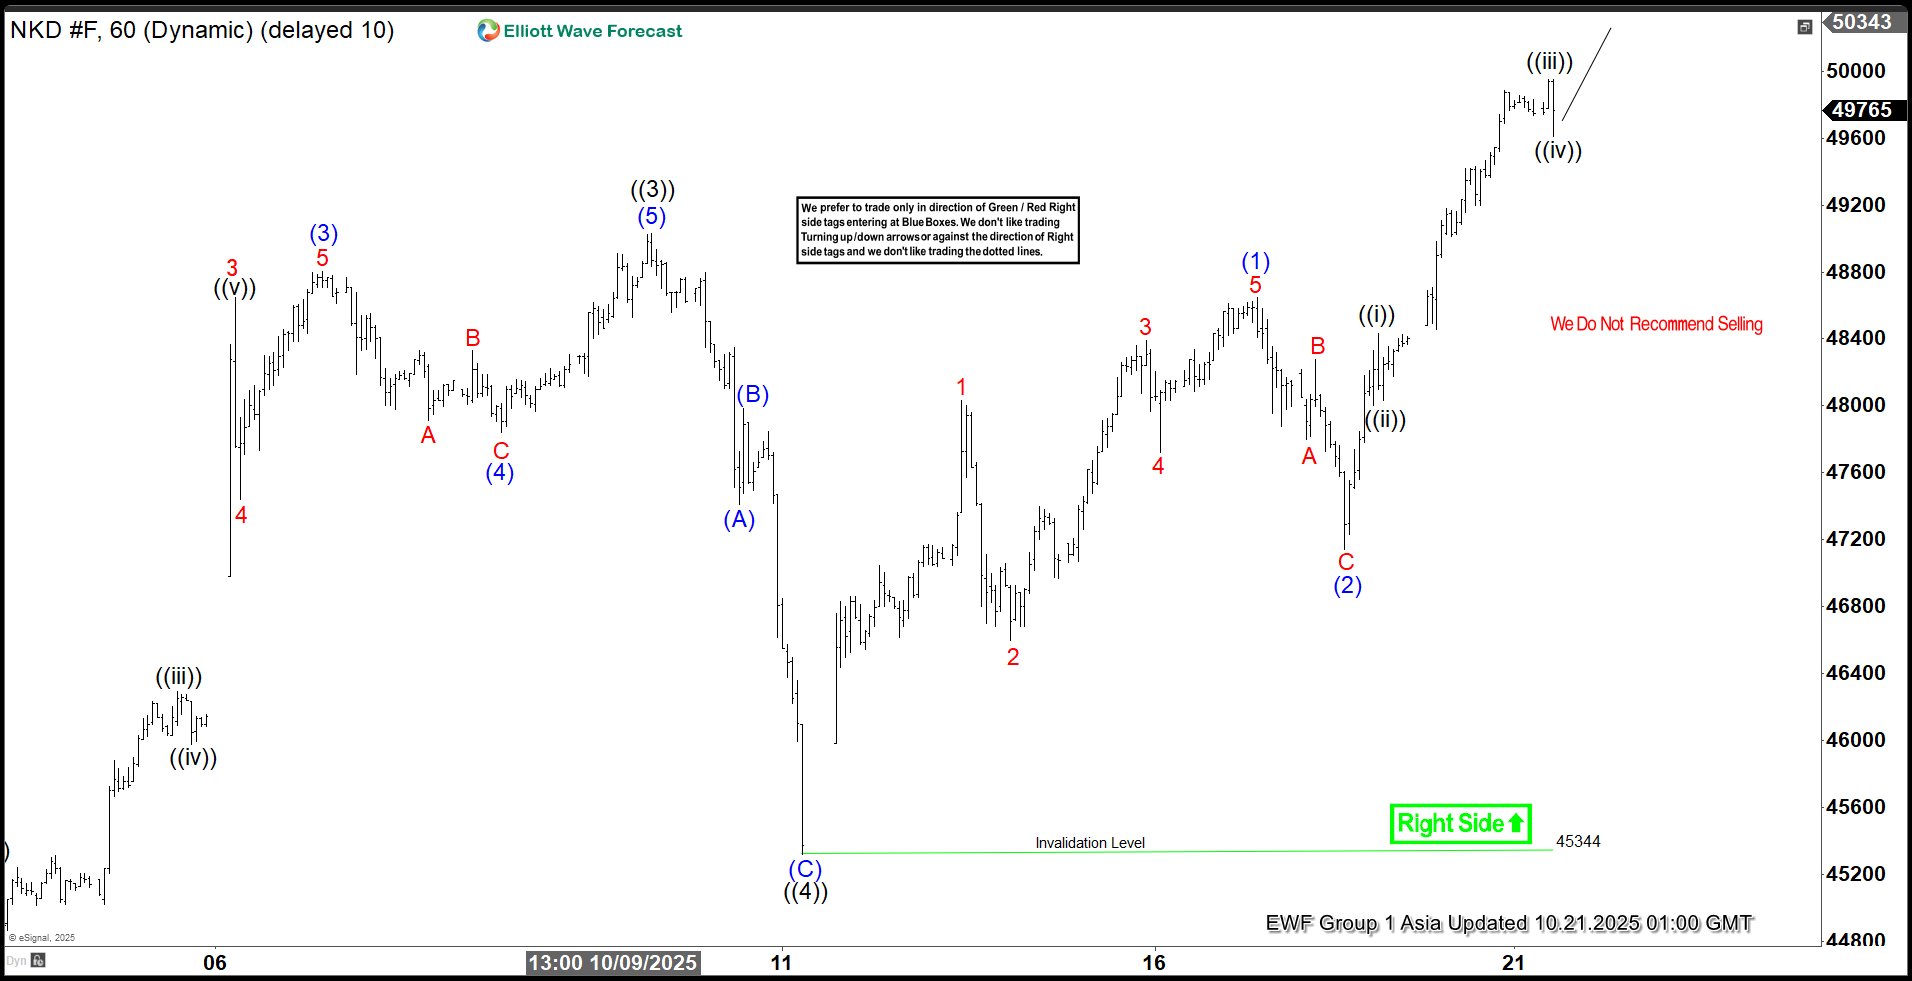
The short-term Elliott Wave analysis for Nikkei Futures (NKD) indicates a robust bullish trend, with the Index recently achieving a new all-time high. The rally to 49,030 marked the completion of wave ((3)), followed by a pullback to 45,344, which concluded wave ((4)). The internal structure of wave ((4)) developed as a zigzag Elliott Wave pattern. From the peak of wave ((3)), wave (A) declined to 47,410, followed by a wave (B) rally to 47,985. The Index then extended lower in wave (C), reaching 45,344, finalizing wave ((4)) in the larger degree.
The Index has since resumed its upward trajectory in wave ((5)). From the wave ((4)) low, wave 1 advanced to 48,030, with a subsequent wave 2 pullback concluding at 46,600. The Index then surged in wave 3 to 48,390, followed by a wave 4 dip to 47,720. The final leg, wave 5, reached 48,650, completing wave (1). A corrective wave (2) followed, ending at 47,145 in a zigzag structure. The Index has now resumed its ascent within wave (3). In the near term, as long as the pivot low at 45,344 holds, expect pullbacks to attract buyers in 3, 7, or 11 swings, supporting further upside in the Nikkei Futures.
Nikkei (NKD) Latest 1-Hour Elliott Wave Chart From 10.21.2025
NKD Elliott Wave Video:
https://www.youtube.com/watch?v=VlDXyMe00GE
Bank of Japan Officials in No Hurry to Raise Policy Rate Next Week
Markets
After a (brief) spike in risk-aversion/volatility over the previous 10-days, markets returned to an ‘easy going, low volatility environment’. Moves in core interest rates and FX were limited. Stocks thrived. Markets again turned more confident on a China-US trade deal after some comforting comments from US officials, including president Trump. For now, there is also no indication of additional worrisome credit losses as US banks report earnings. European markets reacted very orderly to the S&P’s credit downgrade of France. The Eurostoxx 50 (+1.31%) even touched an all-time record. The three major US indices added more than 1.0% and are also nearing record levels. German yields declined up to 1.0 bp across the curve. US yields in a bull flattening move ceded between 0.2 bps (2-y) and 3.6 bps (30-y). Fed governors don’t guide markets anymore (blackout period). Even so, markets consolidate last week’s (risk-off driven) easing, holding the view that the Fed will continue to give more weight to easing labour market conditions rather than to inflation. This interest rate positioning also supports equities, especially as potential risk factors are again moving to the background. On FX markets, technical trading still prevails. After some US-risk-off related losses last week, the dollar yesterday again found its composure and slightly outperformed the likes of the euro and the yen, but the moves were technically insignificant. DXY gained modestly (98.59 from 98.43 close on Friday). EUR/USD eased from 1.1655 to 1.1642. USD/JPY extended gains beyond the 150 barrier.
This morning, Asian equities still join yesterday’s risk rally. In Japan LDP leader Sanae Takaichi won de lower House vote to become the new Prime Minister of the country. While facing constrains, the new government is still seen as executing a growth supportive policy. At the same time, Bloomberg referring to people familiar with the matter, indicated that Bank of Japan officials are in no hurry to raise the policy rate next week even as the economy is making progress towards reaching the BOJ’s price stability target. The combination of the approval of Takaichi and ‘mild’ BOJ comments, causes some easing in short-term Japanese bond yields (+/- 2.0 bps in the 2y-10-y sector) and weighs on the yen. USD/JPY extends its rebound to 151.5.
Later today, the US and EMU eco calendar is again extremely thin. So, the focus might again be on equity markets and corporates earnings, today including the likes of Coca-cola, , Netflix, Haliburton, Western Alliance and others. In interesting to see whether the results will be able to further facilitate the low vol environment. Of course geo/trade politics are also still in play. Despite the risk-on, for now there is apparently little reason for market to leave there recent soft bias toward ECB and Fed policy, with US yields still struggling not fall below key support levels. The dollar gets the benefit of the doubt. UK ONS published monthly public finance data that were closer to expectations, compared to last month’s upward deficit surprise. Sterling is holding little changed near EUR/GBP 0.869.
News & Views
The US and Australia signed a pact which stipulates that both governments will jointly invest in a swathe of mines and processing projects Down Under to boost the production of rare earths and other key minerals. Australia’s PM Albanese said there’s $8.5bn of projects in the pipeline that are “ready to go”. The agreement offers the US alternatives in accessing the key components used in advanced technologies amid concerns of China tightening its grip on the global supply chain through export restrictions. Australia holds the world’s fourth-largest deposits of rare earths (after China, Brazil and India) and is the only producer of so called heavy rare earths outside China.
The Bank of Canada’s business outlook indicator improved marginally to -2.3 from -2.4 in the third quarter. They nevertheless remain below the long-term average. Firms’ outlooks and intentions “remain subdued”, the BoC noted, with “Expectations for growth in domestic export sales remain[ing] soft due to concerns about the broad economic effects of trade tensions.” The steel and aluminium sectors reported “especially weak outlooks”, the report revealed, with those sectors also reporting significant layoffs as a result. More generally, most businesses don’t expect to increase current staffing levels and few reported binding capacity constraints or labour shortages. Soft demand and uncertainty related to trade means firms are holding back investments. The US tariffs are expected to be passed through to selling prices although weak demand is limiting the ability to do so. One-year ahead inflation expectations are below the peak reached earlier in the trade conflict and are now only slightly above the late-2024 levels. Money markets raised bets for another BoC rate cut at the October 29 meeting to 75% after the quarterly survey was released. Canadian inflation numbers released today offer the final input.
Global Indices Rally — Gold Gains, But So Does Volatility
The week kicked off well on both sides of the Atlantic as investors collectively shrugged off fears over the escalating US-China trade war, deteriorating credit conditions, a US government shutdown, the French credit downgrade, a major outage at Amazon Web Services (the world’s largest cloud provider) that froze many online services globally, renewed fighting in Gaza over the weekend, and the not-so-great meeting between Zelensky and Trump. Instead, bad loan worries eased and market attention shifted to the possibility of yet another round of easing tensions between the US and China — and I found this hilarious — Trump told Fox News that his earlier threat of 100 % tariffs on China was “not sustainable”, anyway.
Consequently, the S&P 500 rose more than 1 % over the session and nearly 2 % over the past two sessions, led by a tech rally. Amazon — the company whose AWS problems caused widespread disruptions — gained 1.61 % as investors were reminded how integral AWS is to global business. Apple printed its first all-time high this year after reports emerged that iPhone 17 sales were 14 % higher than comparable launches of prior models — though this does nothing to change that Apple still lags in the AI race driving valuations elsewhere in Big Tech.
In Europe, defense stocks rebounded strongly after Friday’s dip amid Middle East risk and another unproductive meeting between Trump and Zelensky — the US Secretary Pete Hegseth wearing a tie that eerily resembled the Russian flag drew attention, underlining how awkward that meeting might have been. With ASML also up 2.66 %, the STOXX 600 approached record highs. The CAC 40 traded near its own highs despite upward pressure on borrowing costs following the S&P downgrade last Friday. In the UK, the FTSE 100 gained 0.52 %, led by defense and mining names. Energy lagged as crude continued to slip on fading geopolitical risk, with US oil consolidating below $60 per barrel. Fresnillo — one of the gold miners with a stand-out year — added 56 points to the index and is now up over 350 % year-to-date, outperforming both gold and Bitcoin.
Gold itself saw tight demand near record highs despite a risk-on environment, confirming again that the fundamental drivers behind gold have shifted. Since Trump reentered the White House, gold has rallied on both risk-on and risk-off days, and irrespective of whether US yields move up or down. Many investors now believe a $5’000/oz target for gold is plausible and might not be difficult to surpass. But there is a curious anomaly: volatility in gold is rising while the price is rising. That’s unusual — typically volatility compresses during sustained bullish trends and only spikes during panic selloffs. This divergence could suggest that risks to the gold rally are building beneath the surface. If a correction comes, history offers a cautionary precedent: in March 2022, gold’s volatility index reached similar levels, and the price of an ounce fell about 20% over the following four months. Not a guarantee of repetition, but worth keeping in mind.
In global indices, Asia posted another strong session: Korea’s KOSPI hit fresh highs and Chinese stocks recouped losses. Australia’s ASX is testing record territory this morning, as well, on news that the US and Australia have signed a deal to increase US access to Australian rare earth metals — lifting mining names there. Meanwhile, rare earth and critical metals names appear poised for further gains, aided by the West’s push to reduce dependence on China. In Japan, the Nikkei hit a fresh record today after Takaichi won a key vote to become Japan’s next Prime Minister. She will push for looser monetary policy and larger fiscal stimulus — if – of course - markets will let her. Because note that long-term Japanese yields are already near multi-decade highs, which suggests she and Abe (to whom she’s compared) do not share the same margin to maneuver.
In FX, the US dollar is slightly stronger this morning but remains under pressure from trade uncertainty, the looming US shutdown, and a dovish pivot in Federal Reserve (Fed) expectations. The USDJPY is surging on the Takaichi news: her likely softer BoJ stance suggests more convergence with the Fed, which could push the pair higher. The EURUSD is finding it hard to take further advantage of dollar weakness, as widening French-German yield spreads (amid domestic political stress in France) weigh on euro demand. Across the Channel, Cable remains under pressure, as well — but the news that British pension funds and insurers may consider regional investment opportunities probably in exchange for better conditions (which could include tax breaks and regulatory easing) offers a possible tailwind for UK assets. Don’t bet the house on it — yet.