
Sample Category Title
Dollar Gains from Its Peers’ Problems
The dollar is gaining, rebounding from its low point set at the last Fed meeting on 17 September. It is quite common for the dollar to rise, being the lesser evil for investors, rather than due to its own strength. The DXY gained 3% to 98.55 from its low of 95.83, set moments after the Fed cut rates and signalled further policy easing. The bearish event itself was a turning point, as we saw a whole series of factors undermining the value of other currencies to a greater extent.
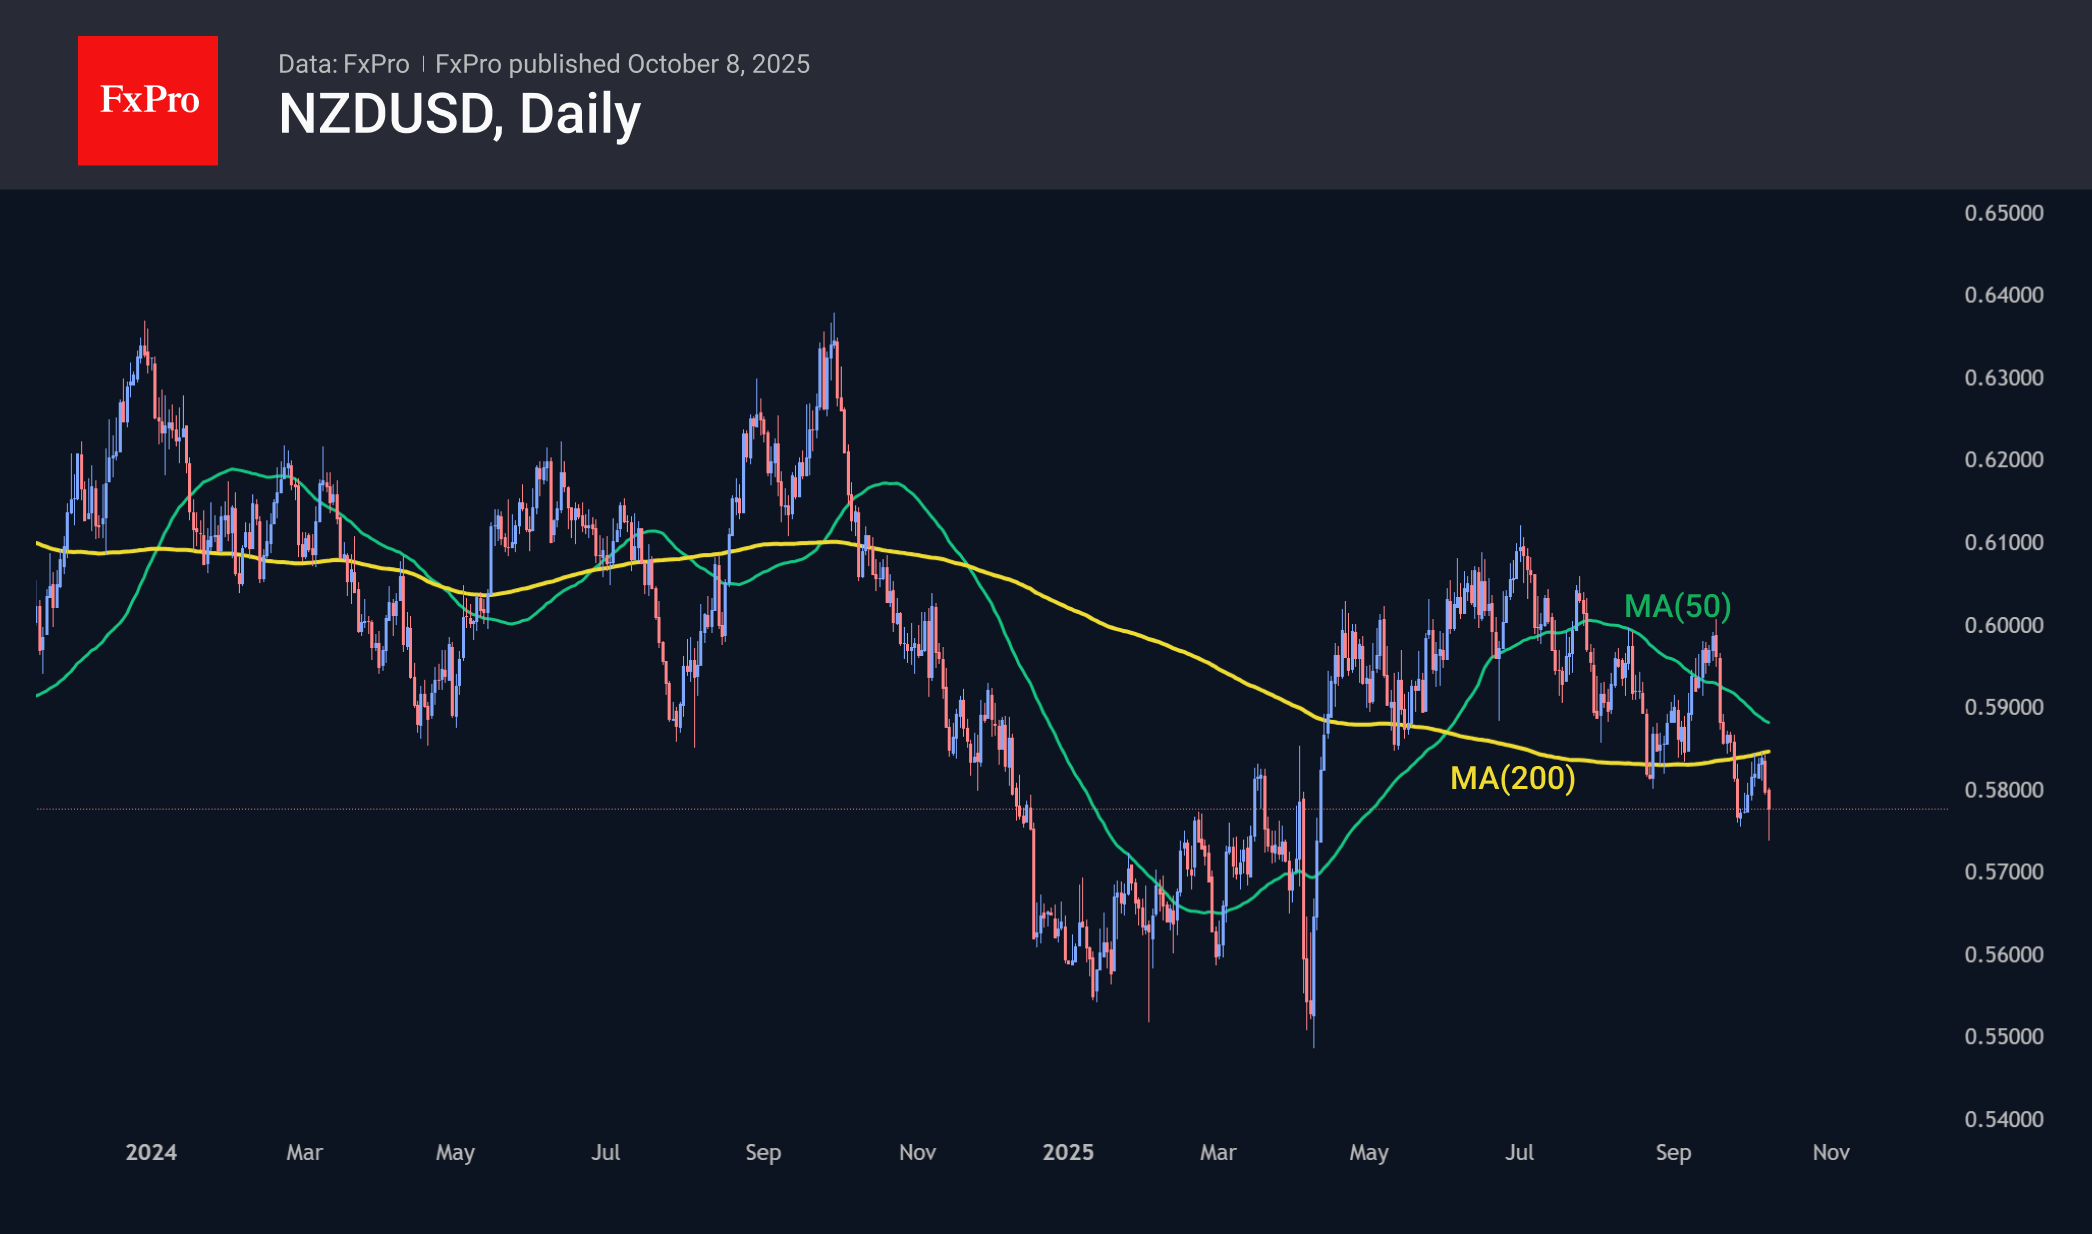
The latest news was a rather unexpected quarter-point cut in the RBNZ’s key rate, which took about 1% off the NZDUSD immediately after the decision was announced. Although the pair has now recovered about half of its initial losses, it has reached its six-month low, falling to 0.5730. A ‘death cross’ is forming in the pair, a bearish technical analysis signal, when the 50-day moving average falls below the 200-day moving average. This signal is reinforced by the fact that both curves are above the price. Such a signal is often followed by more intense selling. However, even without such a signal, the pair has been moving in a downward channel since the beginning of July, touching its lower boundary two weeks ago and today.
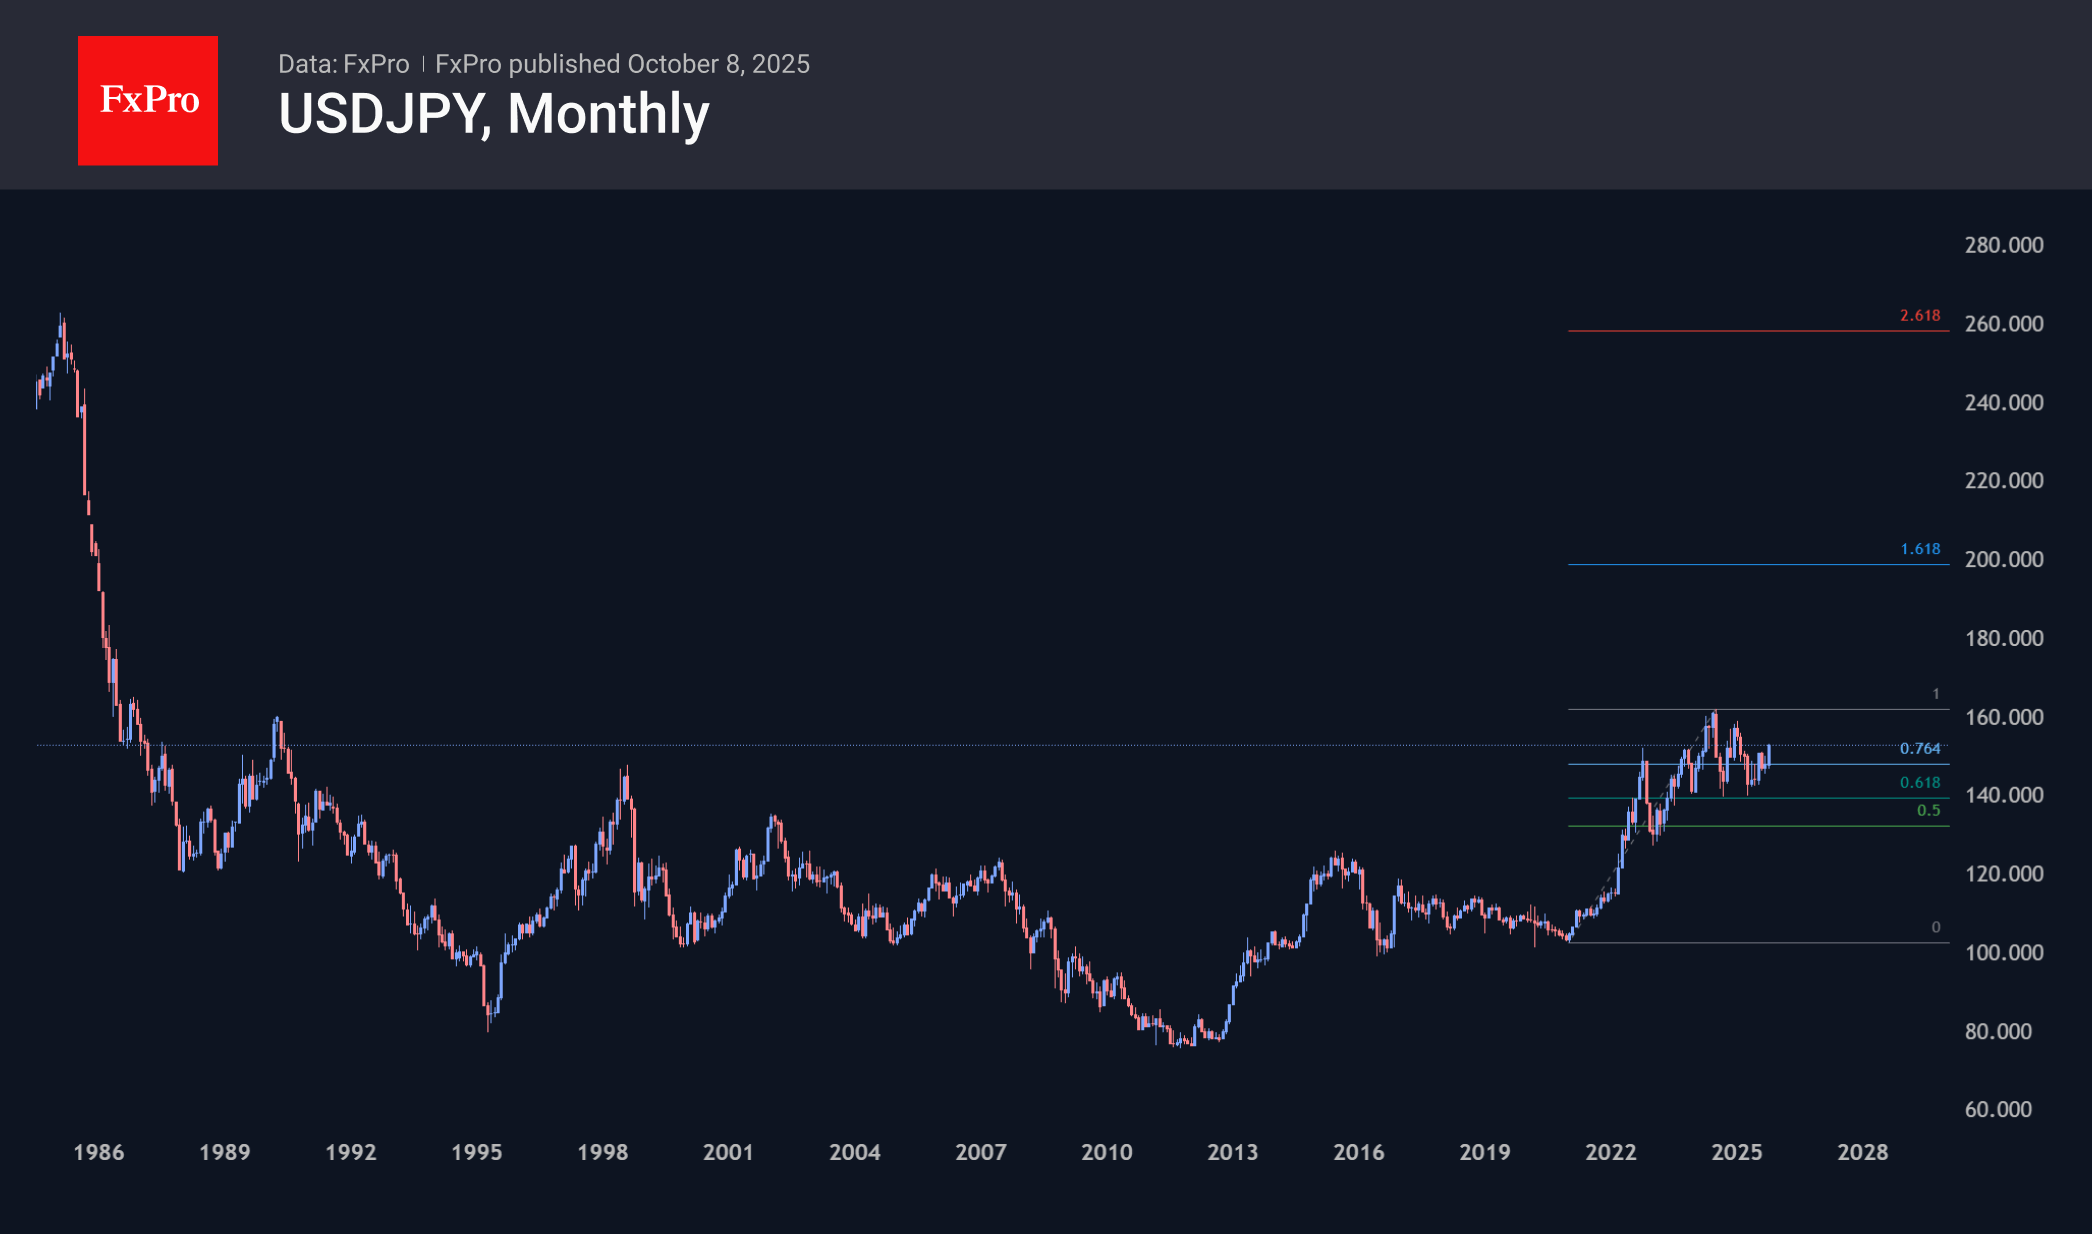
The change of leader of Japan’s largest party triggered a sell-off of the yen. The USDJPY has already added 4.5% to its lows at the end of last week, reaching 152.8, its highest level since February. Sanae Takaichi promises to stimulate the economy through government spending and soft monetary policy. As a result, long-term government bond yields are hitting historic highs, as investors anticipate an increase in placements and fear problems with servicing the national debt. The currency, as a natural stabiliser of such imbalances, tends to decline. We saw a similar impulse in 2022, which caused the USDJPY to rise by about a third in seven months. While we do not expect such a surge this time, we still anticipate growth up to the area of recent highs at 159-162, and the continuation of a similar policy in the long term could take the pair to 200.
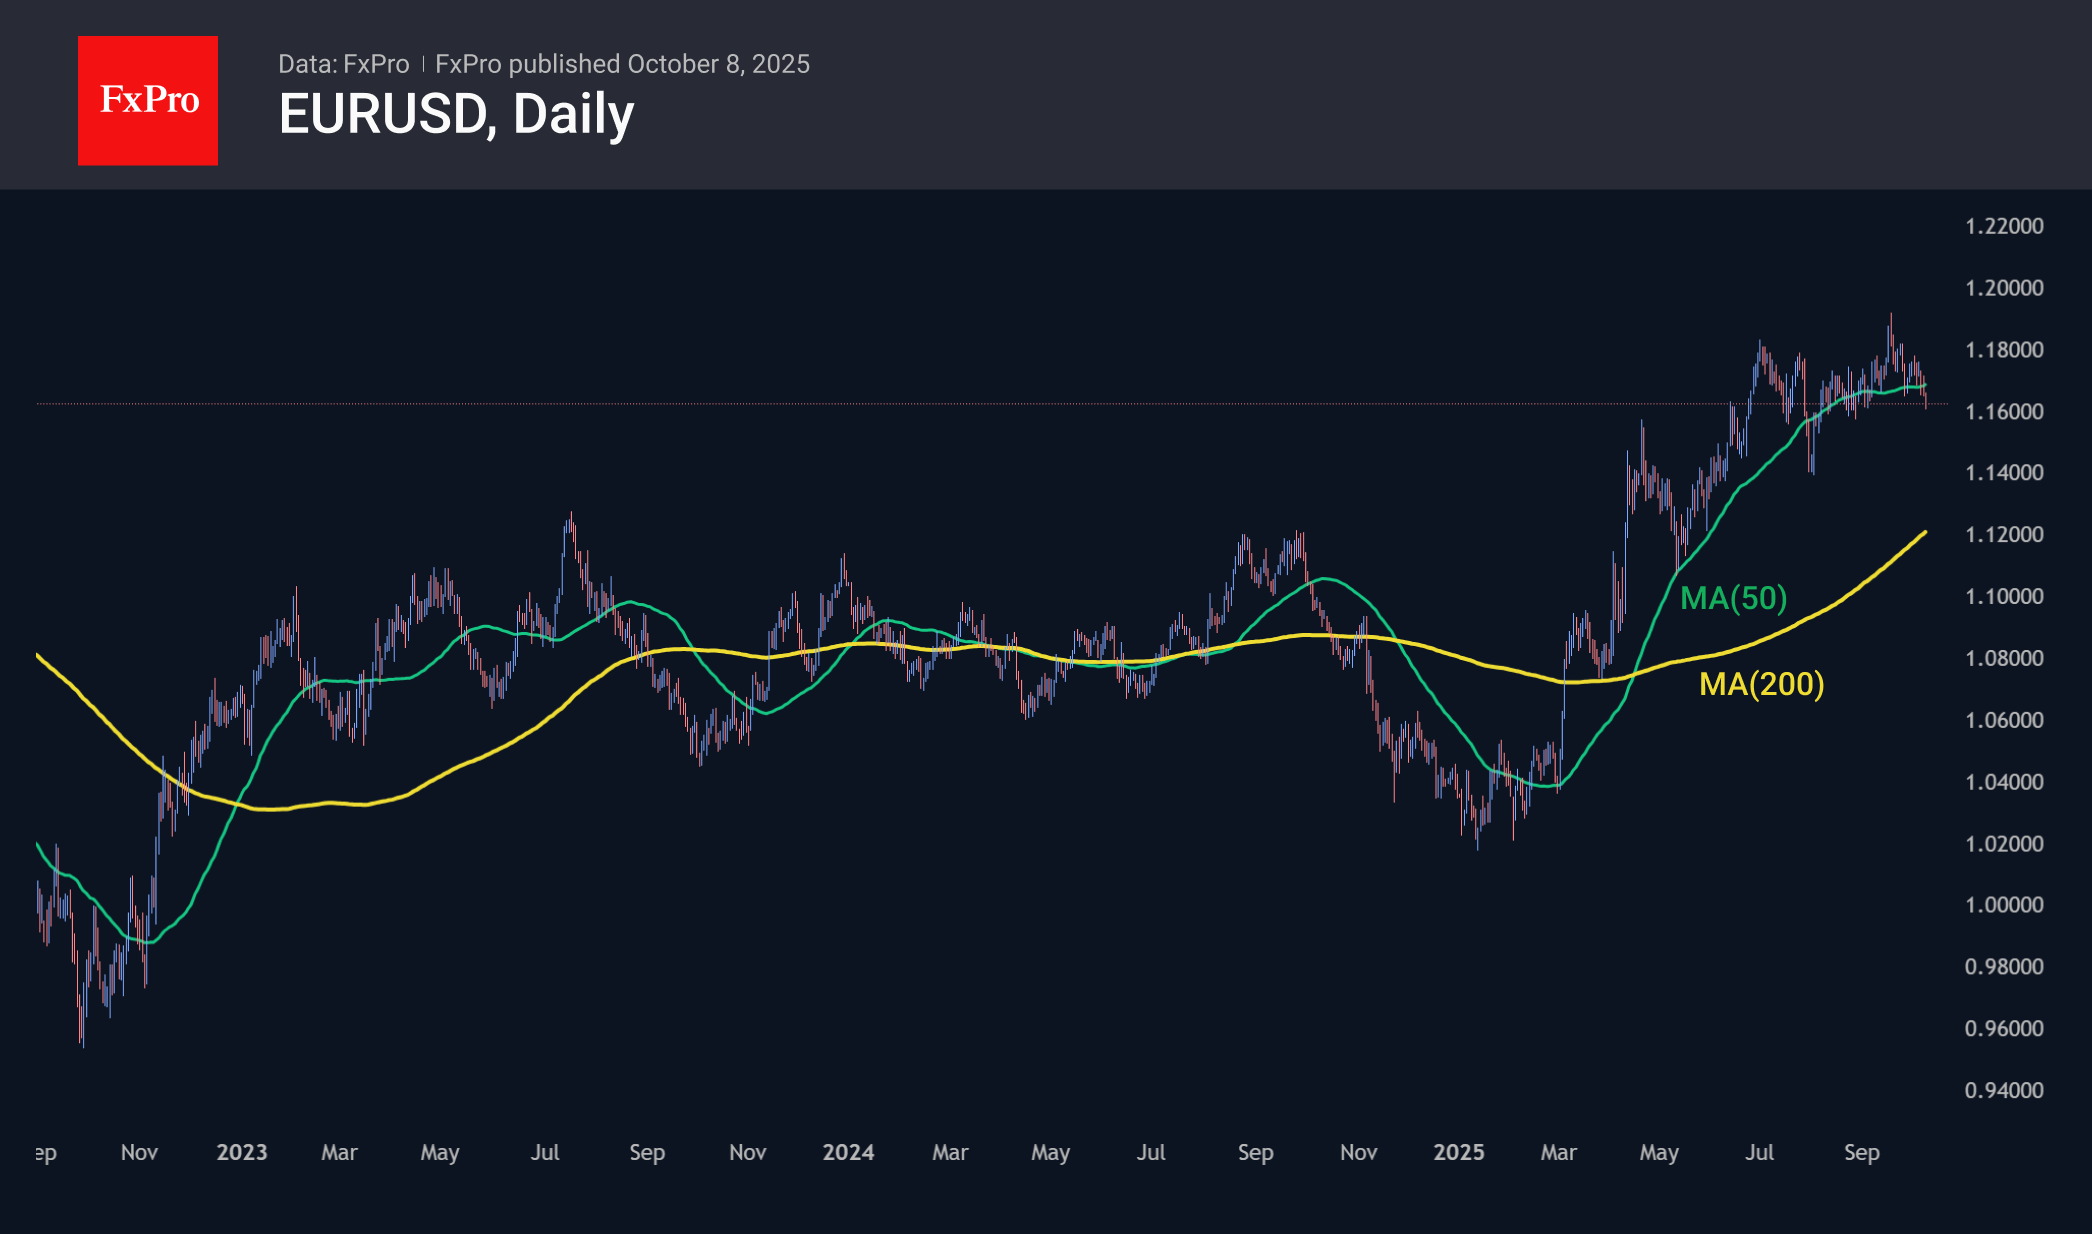
EURUSD has fallen 2.5% from its peak of 1.1919, testing support at 1.1600 in the middle of the week. The pair managed to do so in August, but the political crisis in France and growing difficulties in German industry are now working in favour of the bears. Although the ECB says it has ended its policy easing, the euro has a strong direct correlation with economic growth, forcing EURUSD to seek equilibrium at a lower level, possibly around 1.1000.
Who Said That USD and Gold Can’t Rally Together?
A new wave of an unusual trade has been unfolding: A steep rally in Gold, coinciding with a steep rally in the US Dollar.
Today’s piece will focus on the latter, but it is still an interesting subject that marks an essential functioning of markets: It’s all about what is priced in (and what is not).
You have probably seen the headlines, but Gold officially breached the $4,000 milestone overnight, propelled by a larger RBNZ Rate cut, weakening the Kiwi dollar and trouble in Japanese and European (French) politics.
A US Government Shutdown is also in the works. But wait, why is the Greenback also rallying?
Mentioned after the FOMC September press conference, a less dovish than expected FED with, despite weakening, still strong US Data is forcing a slower rate cut path ahead, providing a floor to the USD.
Also, US Dollar bearishness had been such a prominent theme throughout the first half of 2025 that things couldn’t get much worse except for an unpleasant tariff outcome and degrading diplomatic US relations.
A bad-looking Government deficit is also priced, but this is not just US-specific, and it is one of the core reasons why Gold loves this trend so much.
Hence, as these themes play out and things actually degrade elsewhere, relative strength comes in. And it is here that the US Dollar wins in the current picture.
Let's explore this in a Dollar Index technical review.
Dollar Index (DXY) Multi-timeframe technical analysis
Daily Chart
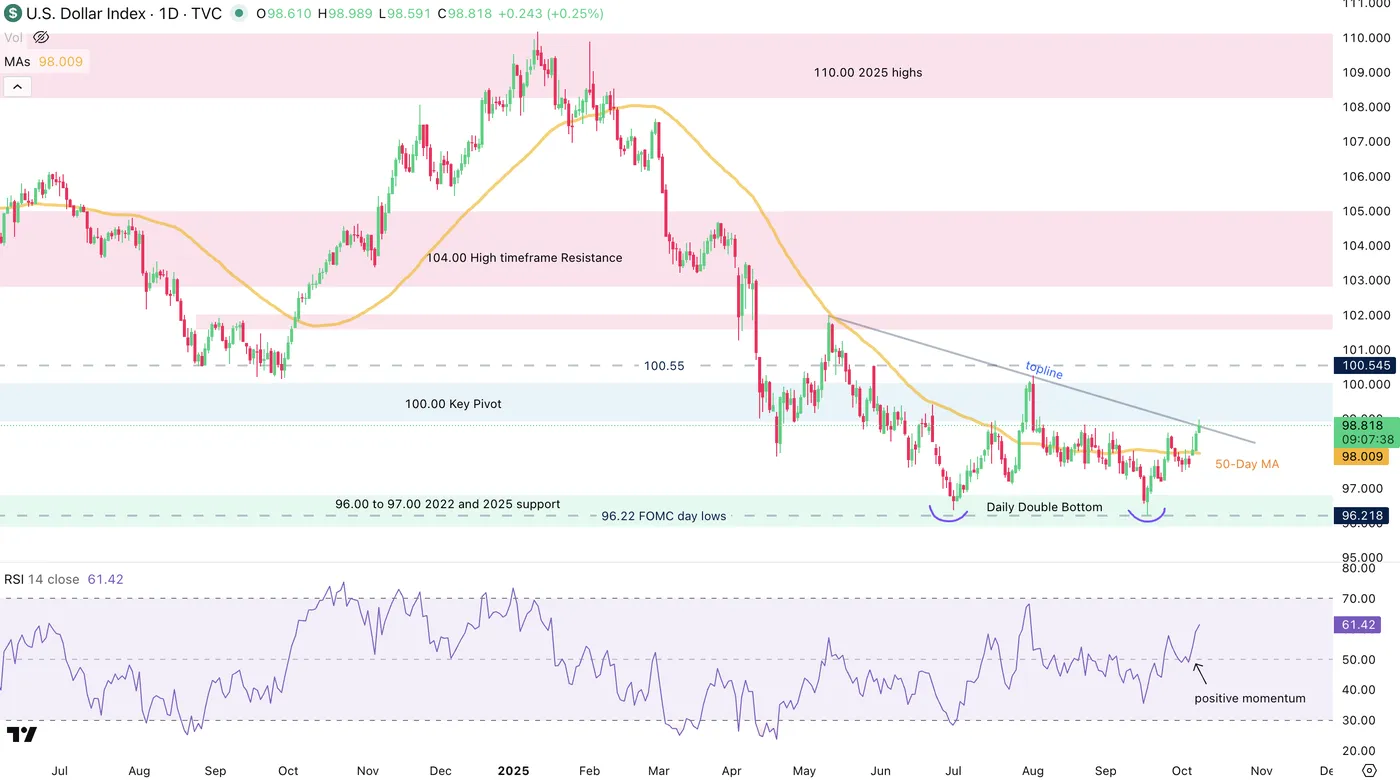
Dollar Index (DXY) Daily Chart, October 8, 2025 – Source: TradingView
The USD is attempting to break above the topline containing breakout attempts since early May 2025.
Fundamentals have changed a bit since: Tariffs are well-implemented, but they're not as harsh as they could have been on the economy.
So, the Economy is still fairly strong, hence less cuts are needed (and rates are still above 4%!).
This, combined with a daily double bottom at the yearly support, led to a strong technical bounce above the flat-lined 50-Day MA. With Momentum turning positive, a breakout could come into play.
Keep an eye on the Topline: A close above would confirm this outcome, while a rejection points to further sideways action.
4H Chart and levels
Dollar Index (DXY) 4H Chart, October 8, 2025 – Source: TradingView
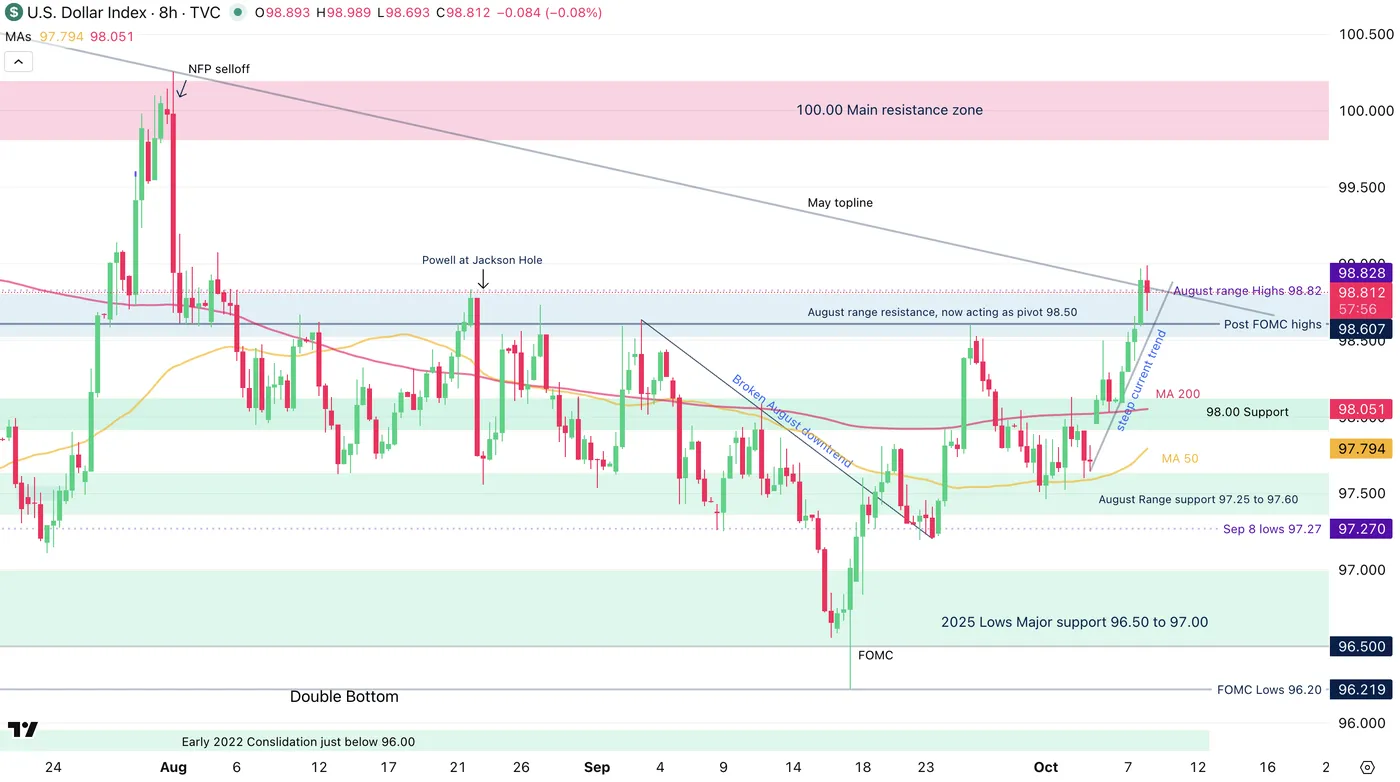
Zooming closer, we see Dollar bulls attempting to break the May topline, with the steep rally that started this week stalling a bit.
Nonetheless, the 4H MA 50 is starting to tilt upwards to catch up with prices and may cross above the flat MA 200, a bullish sign.
One thing to consider however is: How far could such a rally go with the current fundamentals?
A breakout in the US Dollar could point towards the 100.00 level, but cuts are still priced in for 2026, and the labor market is slowing.
This is why such a breakout would be more favorable for a repricing between 98.00 to 100.00 rather than a full return above the threshold. Of course, things may change as prices reach these levels and bulls still have to push higher.
Support Levels:
- August highs, Immediate pivot around 98.50
- 98.00 Support
- August Range support 97.25 to 97.60
- 2025 Lows Major support 96.50 to 97.00
Resistance Levels:
- session highs and May topline 98.99
- 99.40 June selling pivot
- 100.00 Main resistance zone
1H Chart
Dollar Index (DXY) 1H Chart, October 8, 2025 – Source: TradingView
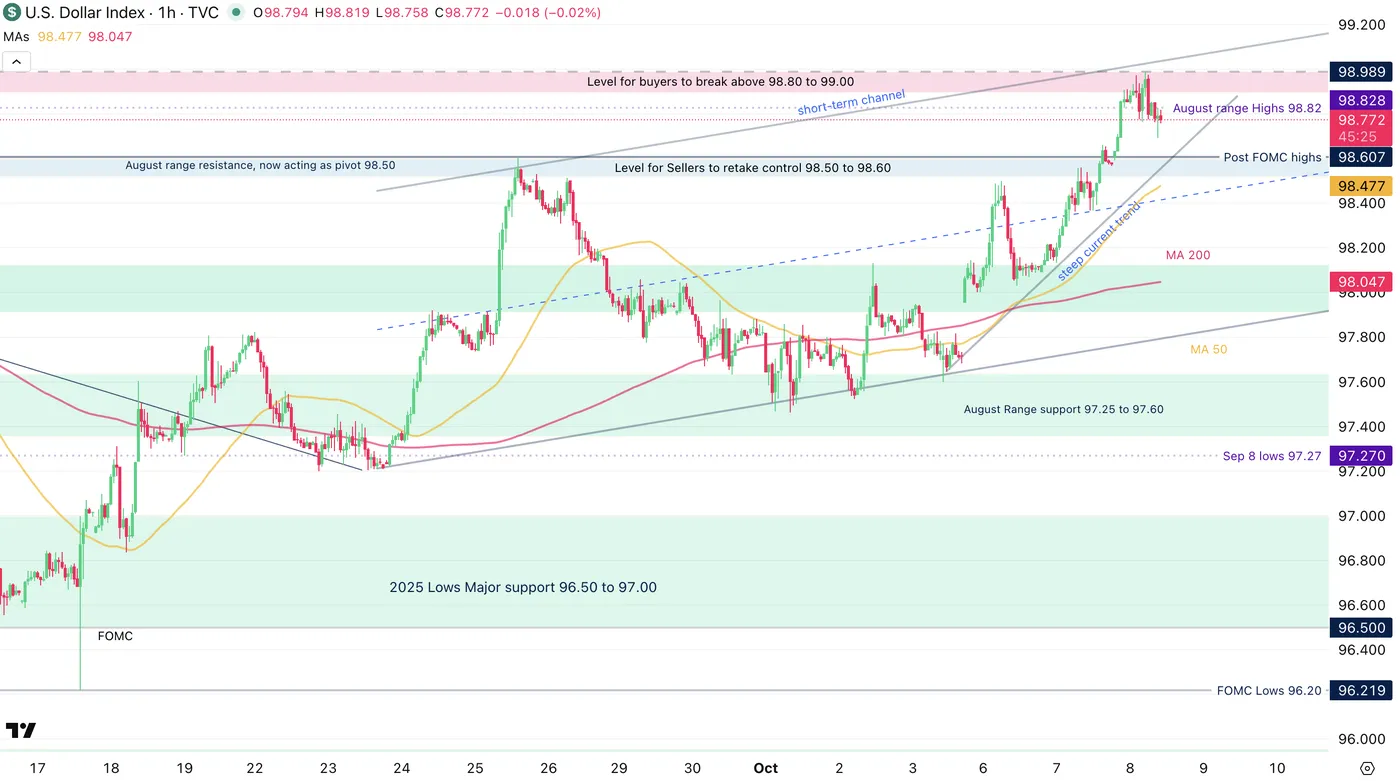
Buyers will have to break above the daily highs at 98.99 (a close above 99.00 may attract further attention).
On the other hand, sellers will want to defend that exact same level and push prices below the post-FOMC Sep 25 highs at 98.60 to retake the short-term advantage.
A short-term upward channel is also forming, watch for its support and resistance levels.
Safe Trades!
Sunset Market Commentary
Markets
The topic of fiscal sustainability for sure still has to role to play in the (near) future as markets are pondering an acceptable level for (sovereign) credit and other risk premia. However after the Japan/France driven stress over the previous days, the risk repositioning takes a breather. As a point in case, the Japanese 30-y yield today eased 14 bps (shorter maturities hardly changed). In Europe yields also eased. In France, the caretaker Prime Minister Lecornu indicated that there might still be a (admittedly) difficult road to finding a budget by the end of the year, reducing the chances of early elections. However for approving a budget, the socialist party apparently has set a higher price including a wealth tax and watering down/suspending the 2023 approved pensions reform. Even as this would only exacerbate the budgetary problems over time, Lecornu indicates that he still aims to reduce next year’s budget deficit below 5% of GDP. Whatever the final outcome, markets apparently again sees a somewhat bigger chance on some kind of muddling through scenario, rather than the outright chaos of new elections. The French 10-y spread vs Germany doesn’t widen any further (84 bps from 86 bps). At the same time, bond market conditions in EMU are easing a bit overall with German yields declining in a bull flattening move (2-y -2 bps; 30-y -3.5 bps). US yields follow this broader move in a session devoid of specific US eco news with yields ceding between 1.5 bps (2 y) and 3 bps (30-y). Later today, US investors still have a $ 39 bln 10-y Treasury auction and the Minutes of the September 17 meeting to look out for. The later might provide interesting insights of the internal FOMC debate, but the dots already suggested that there was absolutely no streamlined view on the Fed rate path going forward. Receding pressure from the fiscal sustainability topic/easier financial conditions also again supports equities after some hesitation over the previous sessions. The Eurostoxx 50 adds 0.4%. The CAC 40 even outperforms its European peers (1%). US indices open little changed.
On FX markets, the France-driven decline of the euro slows (EUR/USD 1.1635), but the picture remains fragile. The yen remains in de defensive (USD/JPY 152.50). Even so, recent moves in the yen already caused Fin Min Kato to warn that he will closely monitory excessive FX moves. At some point it also might support the case for the BOJ to still consider further policy tightening in October. For now the yen trend is still obvious, but some alert is warranted. To be continued.
News & Views
Hungarian inflation remained stable on a monthly basis for a second consecutive month in September. Food prices fell by 0.2% M/M and energy prices by 0.1%. They helped offset price increase in for example clothing and footwear (+1.5% M/M). The price of services decreased by 0.4% on average, within which recreational service prices – due to seasonal effects – lessened by 6.3%. Compared with September of 2024, price growth was unchanged compared to August as well at 4.3% Y/Y (vs 4.4% consensus). Energy prices are on average 10.6% higher, services became 5.9% more expensive, food prices are 4.7% higher and consumer durable prices were up by 2.5% Y/Y. The forint slightly recovers today from yesterday’s losses triggered by political pressure on the central bank to lower its policy rate from the current 6.5%.
The Bank of England published its quarterly financial stability update. Risks associated with geopolitical tensions, global fragmentation of trade and financial markets, and pressures on sovereign debt markets remain elevated. The risk of a sharp market correction has increased according the UK central bank. Despite persistent material uncertainty around the global macroeconomic outlook, risky asset valuations have increased and credit spreads have compressed. On a number of measures, equity market valuations appear stretched, particularly for technology companies focused on Artificial Intelligence (AI). There have been some notable credit defaults in the US automotive sector underscoring some of the risks around high leverage, weak underwriting standards, opacity, and complex structures. Term premia in sovereign bond markets have increased with some key jurisdictions having experienced political uncertainty over the level and pace of reforms to improve the fiscal outlooks. A sudden or significant change in perceptions of Federal Reserve credibility could result in a sharp re-pricing of US dollar assets.
EUR/USD Mid-Day Outlook
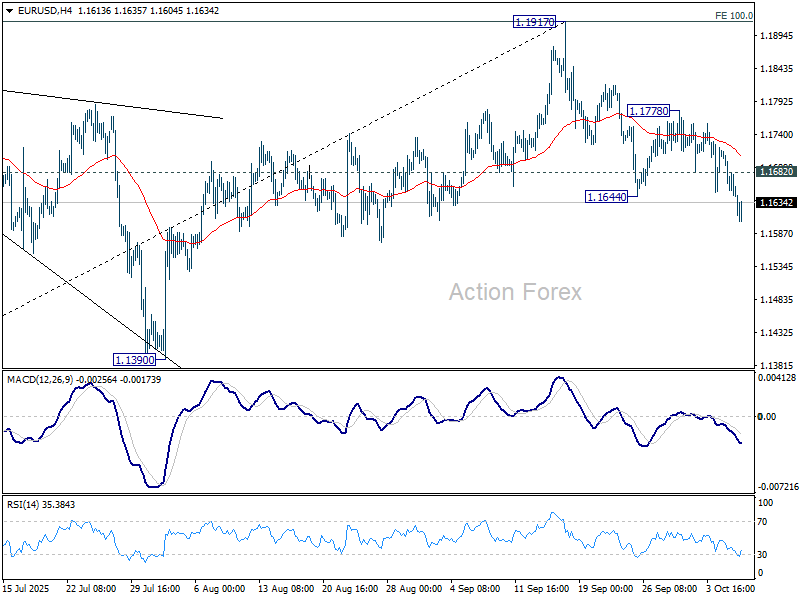
Daily Pivots: (S1) 1.1668; (P) 1.1699; (R1) 1.1747; More...
Intraday bias in EUR/USD remains on the downside for the moment. A medium term top is likely formed at 1.1917. Deeper fall should be seen to 1.1390 support, or even further to 38.2% retracement of 1.0176 to 1.1917 at 1.1252. On the upside, above 1.1682 minor resistance will turn intraday bias neutral first. But risk will stay on the downside as long as 1.1778 resistance holds, in case of recovery.
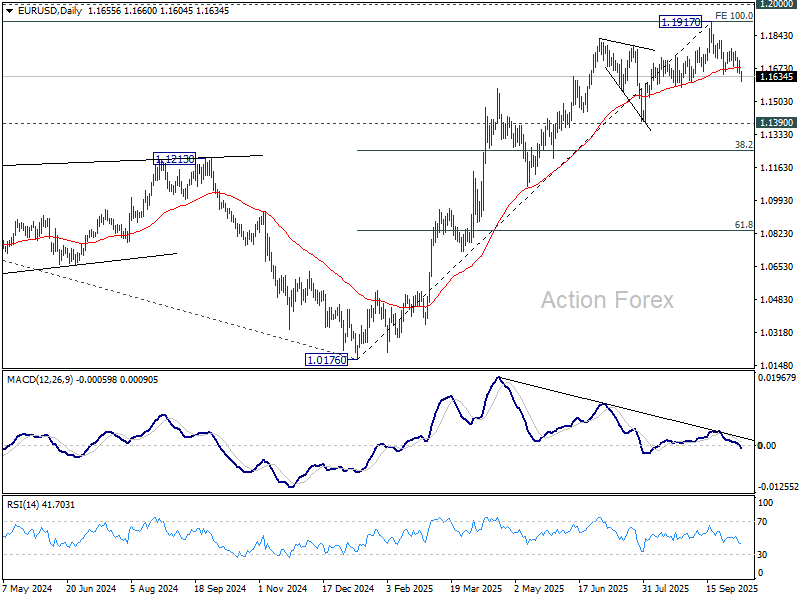
In the bigger picture, rise from 1.0176 (2025 low) is seen as the third leg of the pattern from 0.9534 (2022 low). 100% projection of 0.9534 to 1.1274 from 1.0176 at 1.1916 was already met. For now, further rally will remain in favor as long as 1.1390 support holds, and firm break of 1.2000 psychological level will carry larger bullish implications. However, firm break of 1.1390 will suggest that rise from 1.0176 has already completed and bring deeper fall to 55 W EMA (now at 1.1265) and below.
GBP/USD Mid-Day Outlook
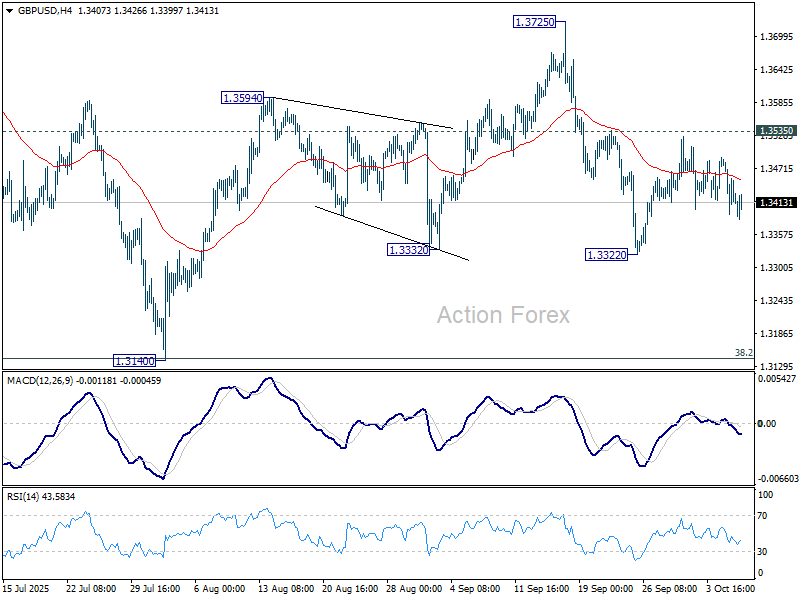
Daily Pivots: (S1) 1.3382; (P) 1.3435; (R1) 1.3478; More...
Range trading continues in GBP/USD and intraday bias stays neutral. With 1.3535 resistance intact, further decline is mildly in favor. On the downside, break of 1.3322 will resume the fall from 1.3725 to 1.3140 support. On the upside, though, firm break of 1.3535 will argue that pullback from 1.3725 has already completed, and bring stronger rise to retest 1.3725/87 key resistance zone.
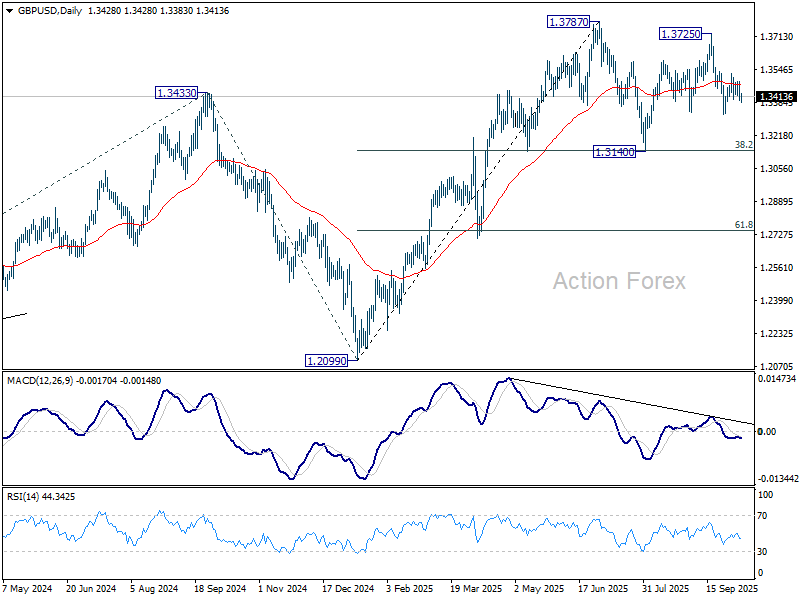
In the bigger picture, rise from 1.0351 (2022 low) is still seen as a corrective move. Further rally could be seen to 61.8% projection of 1.0351 to 1.3433 (2024 high) from 1.2099 (2025 low) at 1.4004. But strong resistance could be seen from 1.4248 (2021 high) to limit upside. Sustained break of 55 W EMA (now at 1.3176) will argue that a medium term top has already formed and bring deeper fall back to 1.2099.
USD/CHF Mid-Day Outlook
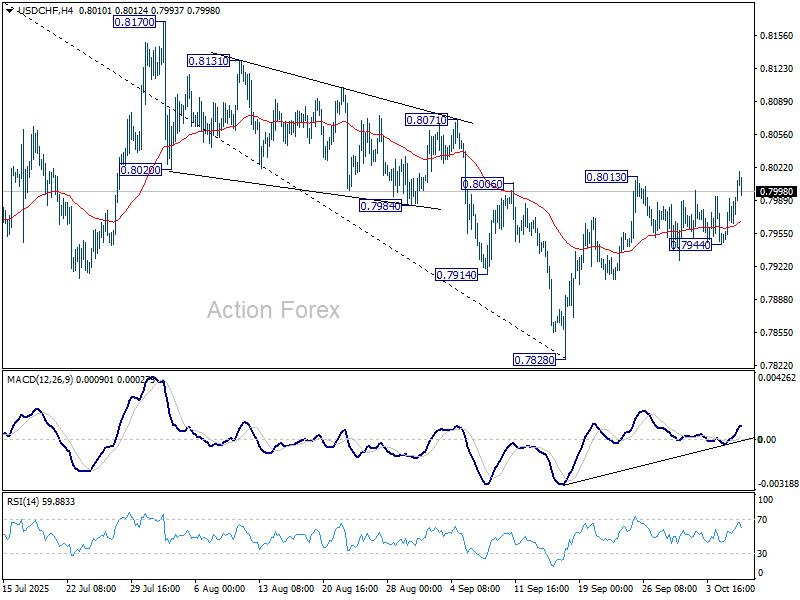
Daily Pivots: (S1) 0.7956; (P) 0.7974; (R1) 0.8000; More…
Intraday bias in USD/CHF stays on the upside at this point. Sustained trading above 55 D EMA (now at 0.8004) will suggest that rise from 0.7828 is already correcting whole fall from 0.9200. Further rise should the be seen to 0.8170 resistance and possibly above. For now, risk will stay on the upside as long as 0.7944 support holds, in case of retreat.
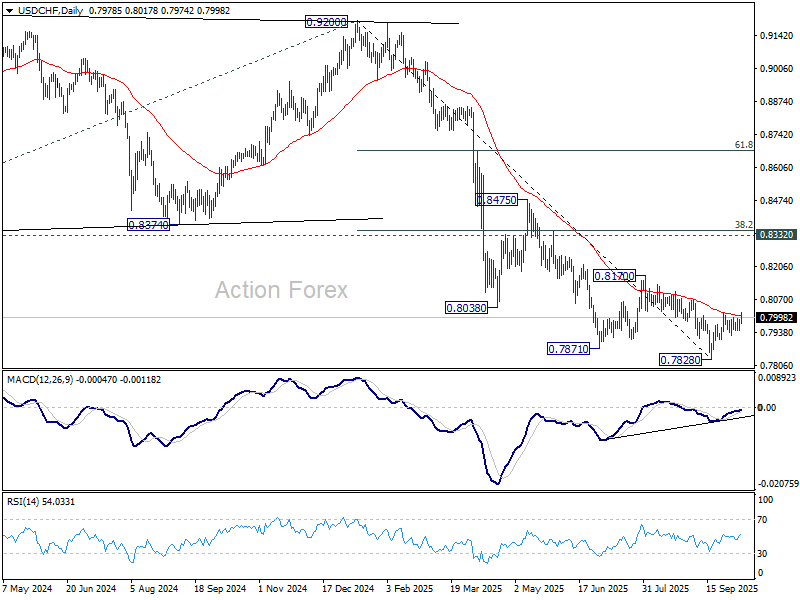
In the bigger picture, long term down trend from 1.0342 (2017 high) is still in progress. Next target is 100% projection of 1.0146 (2022 high) to 0.8332 from 0.9200 at 0.7382. In any case, outlook will stay bearish as long as 0.8332 support turned resistance holds (2023 low).
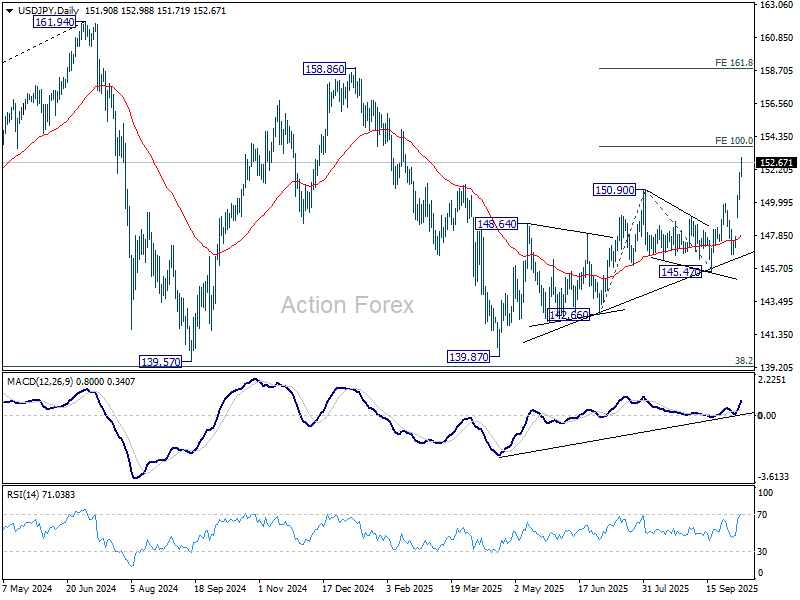
USD/JPY Mid-Day Outlook
Daily Pivots: (S1) 150.72; (P) 151.39; (R1) 152.55; More...
Intraday bias in USD/JPY stays on the upside for the moment, and further rally should be seen to 100% projection of 142.66 to 150.90 from 145.47 at 153.71. Firm break there will pave the way to 161.8% projection at 158.80. On the downside, below 151.71 minor support will turn bias neutral and bring consolidations first, before staging another rise.
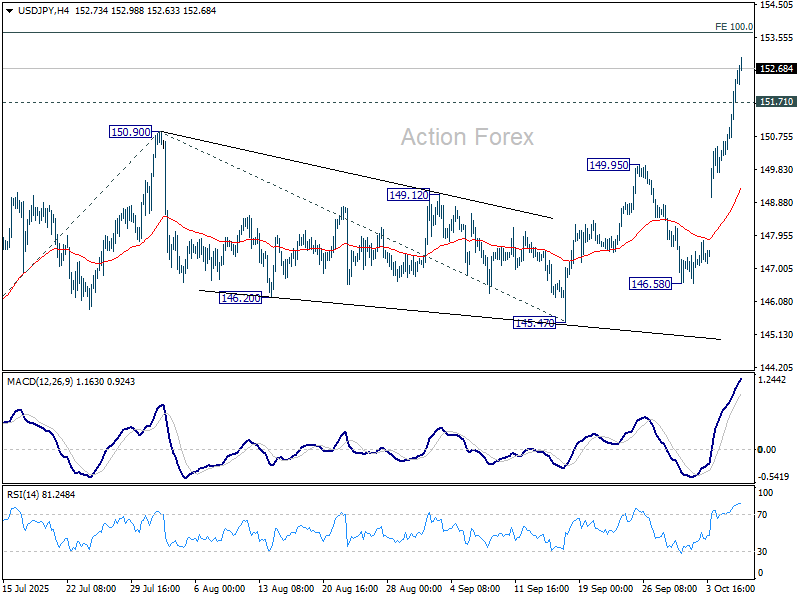
In the bigger picture, current development suggests that corrective pattern from 161.94 (2024 high) has completed with three waves at 139.87. Larger up trend from 102.58 (2021 low) could be ready to resume through 161.94 high. On the downside, break of 145.47 support will dampen this bullish view and extend the corrective pattern with another falling leg.
Gold Tops 4,000 as Investors Flock to Safety; Focus Turns to FOMC Minutes
Gold stole the spotlight in global markets today, surging past the 4,000 mark for the first time ever as investors poured into the metal amid mounting geopolitical risks and growing conviction that the Fed will deliver another rate cut later this month. The historic milestone marks another powerful leg in Gold’s multi-year rally.
The metal has now gained more than 50% year-to-date and has doubled in value over the past three years, outperforming most major asset classes. The rally has been powered by a potent combination of central bank buying, ETF inflows, and expectations of monetary easing, alongside a steady bid from investors seeking protection against global instability.
Still, questions remain about whether the metal can sustain its hold above 4,000, particularly as Dollar shows signs of rebound across currency markets. Technical indicators suggest conditions are stretched, and a short-term pullback could follow if profit-taking accelerates around the milestone level. But underlying momentum remains firmly bullish as long as expectations for rate cuts persist.
In Asia, Japanese prime minister-in-waiting Sanae Takaichi faces early headwinds from her ruling coalition partner Komeito. The socially liberal party, long a brake on the LDP’s hawkish tendencies, has criticized Takaichi’s rhetoric toward foreigners and her past visits to the Yasukuni Shrine, a move likely to strain relations within the alliance.
While Takaichi is still expected to secure parliamentary approval later this month to become Japan’s first female prime minister, LDP sources say the vote could be delayed beyond the original October 15 date as negotiations drag on. Komeito’s leader Tetsuo Saito said talks with Takaichi lasted 90 minutes without a resolution, with more discussions planned in the coming days.
Moving to the U.S., investors are watching for clues from the FOMC minutes and a series of Fed speeches later today. With the government shutdown stretching into its second week, many analysts believe the absence of key data will encourage policymakers to deliver another “insurance cut” at the October 29 meeting rather than risk policy overtightening. Market pricing reflects that conviction: Fed fund futures now imply a 95% probability of a 25bps cut this month.
For the week so far, Loonie leads gains, followed by Dollar and Aussie, while Yen, Kiwi, and Euro trail at the bottom. The Kiwi remains under pressure after the RBNZ’s dovish 50bps cut. Sterling and Swiss Franc trade quietly mid-pack.
In Europe, at the time of writing, FTSE is up 0.81%. DAX is up 0.58%. CAC is up 0.83%. UK 10-year yield is down 0.022 at 4.704. Germany 10-year yield is down -0.039 at 2.673. Earlier in Asia, Nikkei fell -0.45%. Hong Kong HSI fell -0.48%. China was still on holiday. Singapore Strait Times fell -0.36%. Japan 10-year JGB yield rose 0.023 to 1.704.
RBNZ delivers 50bps cut, signals readiness to ease further if needed
RBNZ delivered a larger 50 bps rate cut, lowering the Official Cash Rate (OCR) to 2.50% at today's meeting. The central bank maintained its easing bias, saying it “remains open to further reductions in the OCR” to ensure inflation returns sustainably to 2% over the medium term.
Minutes of the meeting showed the Monetary Policy Committee debated between a 25bps and 50bps move, with the majority favoring a bolder step to mitigate downside risks to medium-term growth and inflation. The Committee judged that prolonged spare capacity warranted a "clear signal" to support consumption and investment, helping anchor expectations amid a slowing economy.
While the Q2 GDP contraction was “considerably larger than expected,” the RBNZ attributed much of the weakness to temporary seasonal factors. It expects the distortion to reverse later in the year and said it does not see the short-term softness as materially altering the broader policy outlook.
The central bank noted that it had only marginally revised down its assessment of spare capacity but acknowledged “some downside risk” to activity. Inflation is projected to converge toward the 2% midpoint in the first half of next year, supported by easing tradables inflation and gradually moderating domestic cost pressures.
USD/JPY Mid-Day Outlook
Daily Pivots: (S1) 150.72; (P) 151.39; (R1) 152.55; More...
Intraday bias in USD/JPY stays on the upside for the moment, and further rally should be seen to 100% projection of 142.66 to 150.90 from 145.47 at 153.71. Firm break there will pave the way to 161.8% projection at 158.80. On the downside, below 151.71 minor support will turn bias neutral and bring consolidations first, before staging another rise.
In the bigger picture, current development suggests that corrective pattern from 161.94 (2024 high) has completed with three waves at 139.87. Larger up trend from 102.58 (2021 low) could be ready to resume through 161.94 high. On the downside, break of 145.47 support will dampen this bullish view and extend the corrective pattern with another falling leg.
XAG/USD Analysis: Silver Price Growth Slows
This morning, we reported that the price of gold has risen above $4,000 for the first time in history. The surge in this safe-haven asset has been driven by political uncertainty in the United States and other countries, as well as sustained demand from central banks.
Against this backdrop, the XAG/USD chart also draws attention, showing that silver prices are following a bullish trend — though not as confidently as gold. Technical analysis provides further important insights.
Technical Analysis of the XAG/USD Chart
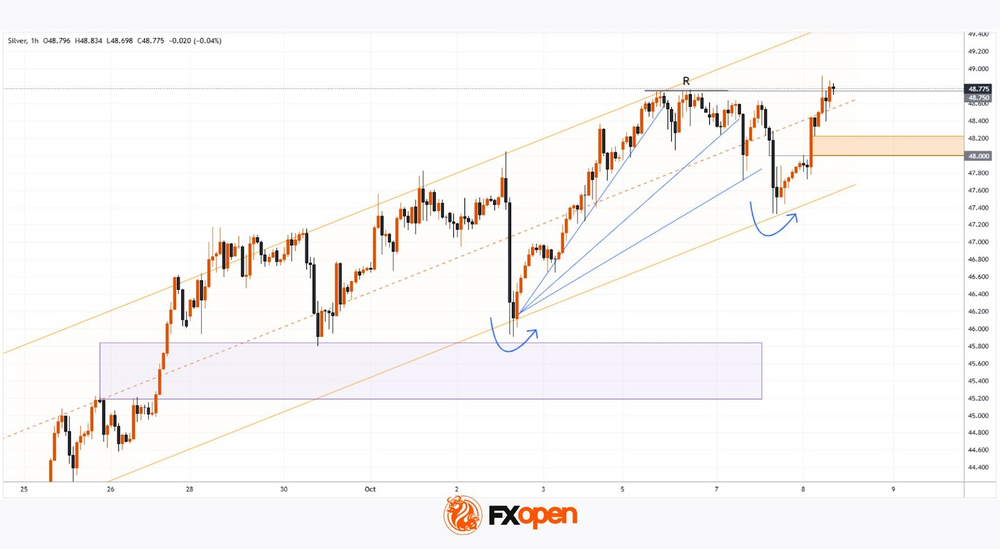
Seven days ago, when analysing the XAG/USD chart, we plotted a steep orange channel indicating an acceleration of growth and suggested that:
→ the market remained bullish;
→ a correction was possible — for example, towards the lower boundary of the orange channel (S2), reinforced by a bullish Fair Value Gap (FVG) shown as a purple imbalance zone favouring buyers.
Indeed, this scenario played out, and the reversal from the identified support block (as shown by the first arrow) occurred with notable momentum. The upward trend then continued, with silver prices remaining within the orange channel, which is still relevant today.
Key details to note:
→ as shown by the line marked R (Resistance), silver has struggled to gain traction around the 48.75 level;
→ as indicated by the blue lines (whose slope is decreasing), buying pressure may be weakening as bulls attempt to break through this level.
Following yesterday’s test of the lower boundary of the channel, the price (as shown by the second arrow) turned upwards — this can be interpreted as bulls having “shaken out” weak holders and regained strength to challenge the 48.75 (R) level.
On this move, they managed to:
→ overcome local resistance at 48.00;
→ form a bullish FVG zone (highlighted in orange);
→ climb into the upper half of the channel.
However, today’s move above 48.75 appears tentative — the XAG/USD chart shows no clear consolidation above this key level. That said, if political turbulence persists, new record highs in gold could well give fresh momentum to the “silver bulls.”
Start trading commodity CFDs with tight spreads. Open your trading account now or learn more about trading commodity CFDs with FXOpen.
This article represents the opinion of the Companies operating under the FXOpen brand only. It is not to be construed as an offer, solicitation, or recommendation with respect to products and services provided by the Companies operating under the FXOpen brand, nor is it to be considered financial advice.