Sample Category Title
GBP/USD Technical: Corrective Decline Ended, Potential Bullish Reversal in Progress for Sterling as NFP Looms
The price actions of the GBP/USD have shaped the expected minor corrective decline in the past two sessions to print an intraday low of 1.3333 on Wednesday, 3 September, just whiskers above the pre-defined 1.3315/1.3280 key medium-term pivotal support highlighted in our last publication.
Let’s now determine its next short-term (1 to 3 days) directional bias and key levels to watch as we await the key US labour data release: non-farm payrolls and unemployment rate for August at 1230 GMT today.
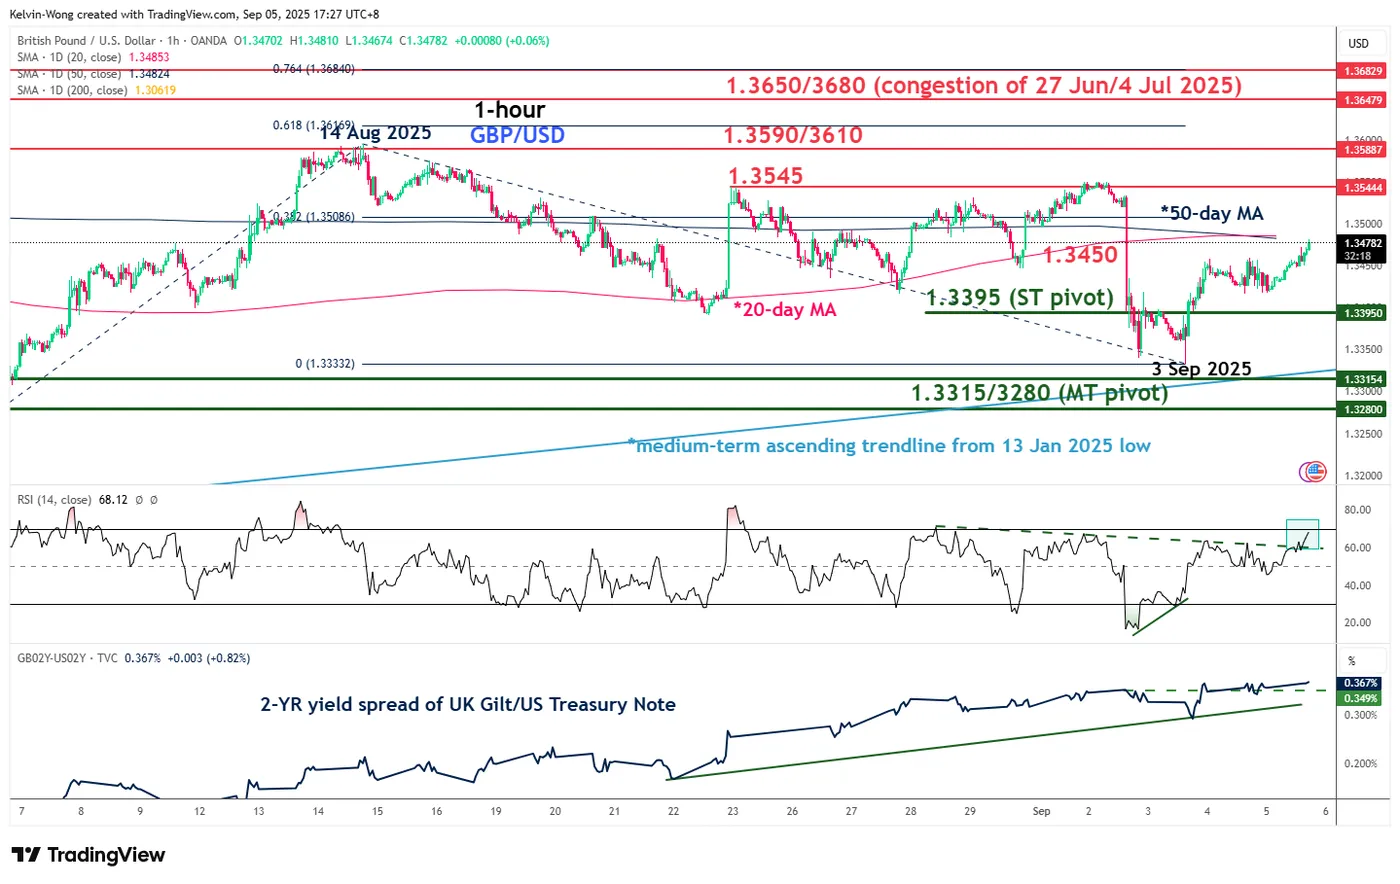
Fig. 1: GBP/USD minor trend as of 5 Sep 2025 (Source: TradingView)
Preferred trend bias (1-3 days)
The minor corrective decline of -1.9% (high to low) of the GBP/USD that spanned from 14 August 2025 high to 3 September 2025 low may have ended.
Bullish bias above 1.3395 key short-term pivotal for the next intermediate resistances to come in at 1.3545, 1.3590/1.3610, and 1.3650/1.3680.
Key elements
- The GBP/USD has shaped a minor bullish reversal right above the lower boundary of the medium-term ascending trendline in place since 13 January 2025 low on 3 September 2025.
- The hourly RSI momentum indicator of the GBP/USD has just staged a bullish breakout above a parallel descending resistance and flashed an earlier bullish divergence condition at its oversold region on 3 September 2025.
- The 1.3395 key short-term pivotal support is defined by a former minor swing high formed on 2 September 2025 during the US session and the 61.8% Fibonacci retracement of the ongoing minor rally from the 3 September 2025 low to the current intraday high of 5 September at the time of writing.
- The 2-year yield spread premium between the UK gilt and US Treasury note has continued to expand (inched higher) since the 3 September 2025 level of 0.29% to a current level of 0.37%. These observations suggest that short-term UK gilt is relatively more attractive than US Treasury notes in terms of yield differential, in turn, putting upside pressure on GBP/USD.
Alternative trend bias (1 to 3 days)
A break below 1.3395 in GBP/USD would invalidate the bullish outlook, opening the door to a minor corrective decline toward the key medium-term support zone at 1.3315/1.3280.
Canadian Dollar Eyes Canadian, US Jobs Data
The Canadian dollar has edged lower on Friday. In the European session, USD/CAD is trading at 1.3793, down 0.19% on the day. We could see stronger movement from the Canadian dollar later in the day, as Canada and the US release the August employment reports.
Canada's employment expected to rebound
Canada's labor market took a beating in July, with the loss of 40.8 thousand jobs, including 10 thousand job losses in manufacturing. The markets expect a rebound in August, with an estimate of 7.5 thousand new jobs. The unemployment rate is expected to tick up to 7.0% from 6.9%.
The weak July reading was directly attributable to the US tariffs, which have hurt the Canadian economy. The US has slapped 35% tariffs on many Canadian products and Canada ships some 75% of its export to its southern neighbor. The two sides are yet to reach a trade agreement but Canada can ill afford a protracted trade war with the US.
Markets brace for weak US NFP
All eyes are on today's US employment report. With inflation largely under control, nonfarm payrolls are closely monitored and could move the US dollar.
The markets are expecting virtually no change in nonfarm payrolls, with an estimate of 73 thousand for August after a gain of 75 thousand in July. The labor market is clearly cooling as employers remain cautious in an uncertain economic environment. The unemployment rate is expected to edge up to 4.3% from 4.2%, which would be the highest level since December 2021.
The Federal Reserve is virtually certain to lower rates at the September 17 meeting, but a weak nonfarm payrolls report would likely lead to calls for the Fed to respond with a jumbo half-point cut.
USD/CAD Technical
- USDCAD has pushed below support at 1.3798 and is testing 1.3798. Below, there is support at 1.3784
- There is resistance at 1.3819 and 1.3826
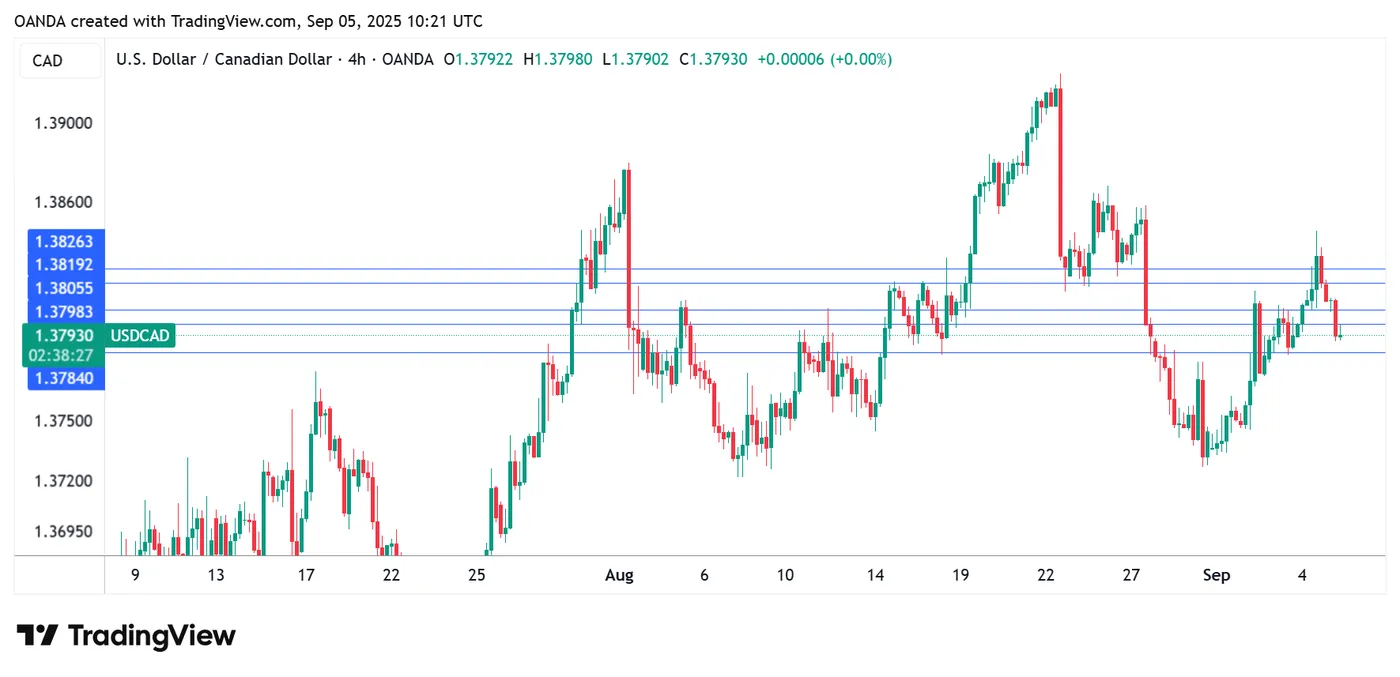
USDCAD 4-Hour Chart, September 5, 2025
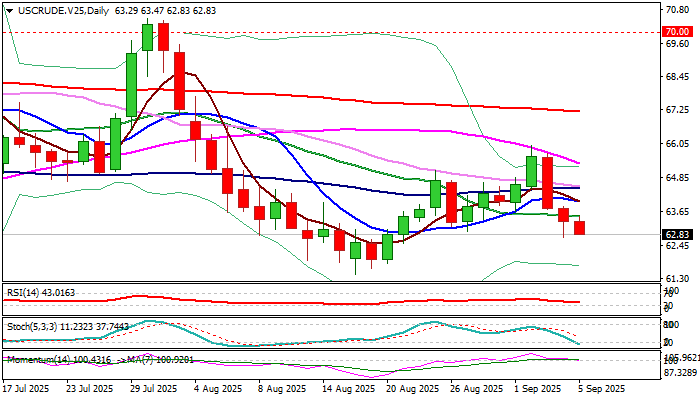
WTI: Crude Oil Remains Under Pressure from Higher Production
WTI oil remains in red for the third consecutive day and holding near two-week low on Friday, deflated by signals that OPEC+ will announce further production increase in its meeting over the weekend and unexpected rise in US crude inventories.
Lower demand as US summer driving season ends, also contributed to weaker near-term picture.
Oil is on track for a weekly loss after two weeks in green and probes again through cracked important Fibo support at $63.19 (61.8% of $61.44/$66.01 upleg), with firm break here to confirm fresh bearish signal for attack at $62.52 (Fibo 76.4%) and unmask key support at $61.44 (Aug 18 low).
Daily MA’s remain in full bearish setup, falling 14-d momentum is flirting with the centreline, which points to negative outlook, though some headwinds to be anticipated as Stochastic entered negative territory.
Broken 20DMA / 50% retracement $63.50/73 respectively) should ideally cap and keep immediate bears intact, also guarding first upper pivot at $64.38 (daily Tenkan-sen).
Res: 63.50; 63.73; 64.00; 64.48.
Sup: 62.52; 61.82; 61.44; 60.71.
Hang Seng Index Technical: Recent Sell-Off Overdone, Bullish Trend Remains Intact
The Hong Kong 33 CFD Index (a proxy for Hang Seng Index futures) delivered the anticipated bullish run between 13 and 25 August, reaching the short-term resistance level of 25,750 and posting an intraday high of 25,946 on 25 August.
Thereafter, its price actions have evolved into a choppy minor corrective decline sequence of -4.3% (high to low) within a medium-term uptrend phase from 25 August to 28 August, as short-term traders took profit due to fears of an overheated bull-run seen in the China “A” shares market towards the end of August
Margin financing in the Shanghai stocks rose to record highs in line with the Shanghai Stock Exchange Composite Index hitting a 10-year high, bringing the memories of the bursting of the 2015 stock market bubble in China that saw a massive decline of close to -50% in their respective benchmark stock indices.
Fundamentals continued to improve in the Chinese stock markets
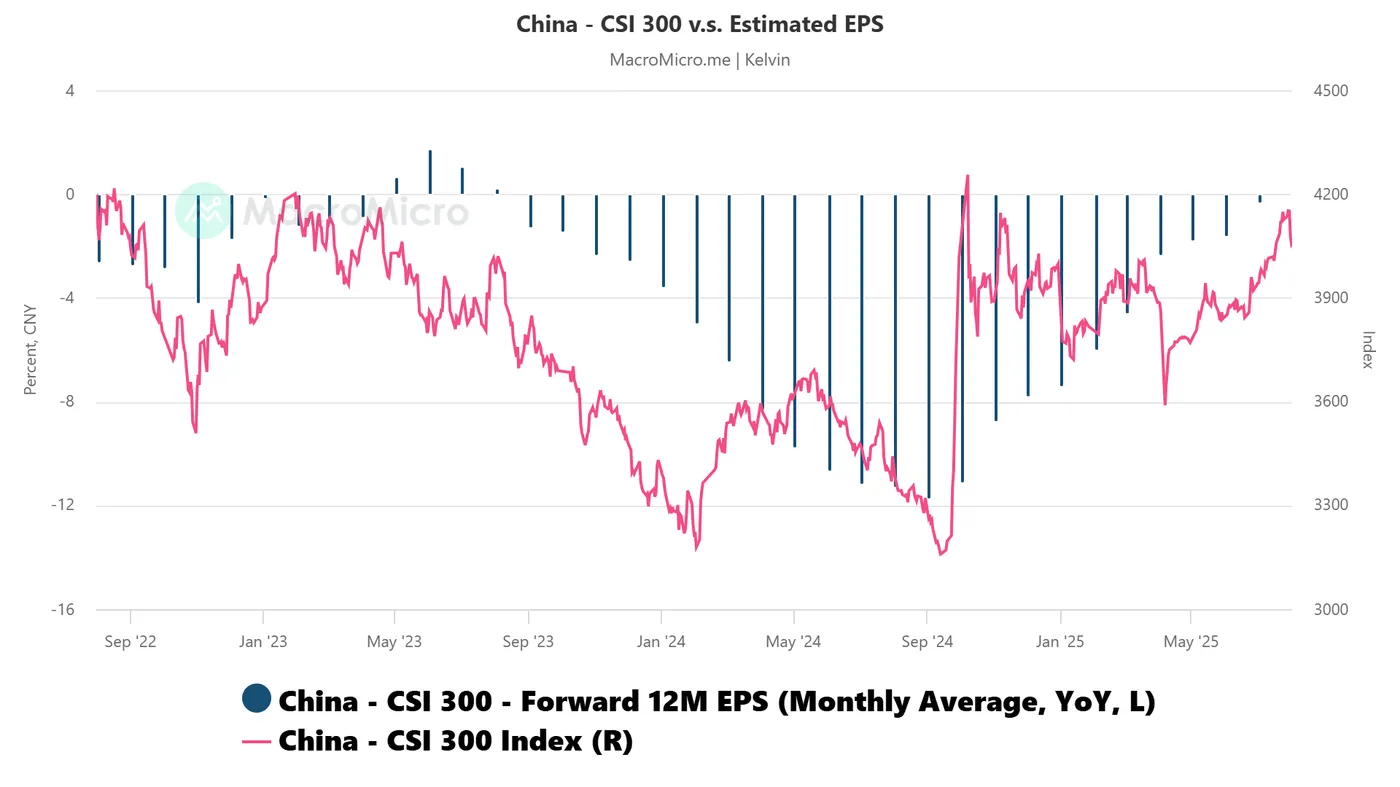
Fig. 1: China CSI 300 1-month forward EPS growth y/y as of Aug 2025 (Source: MacroMicro)
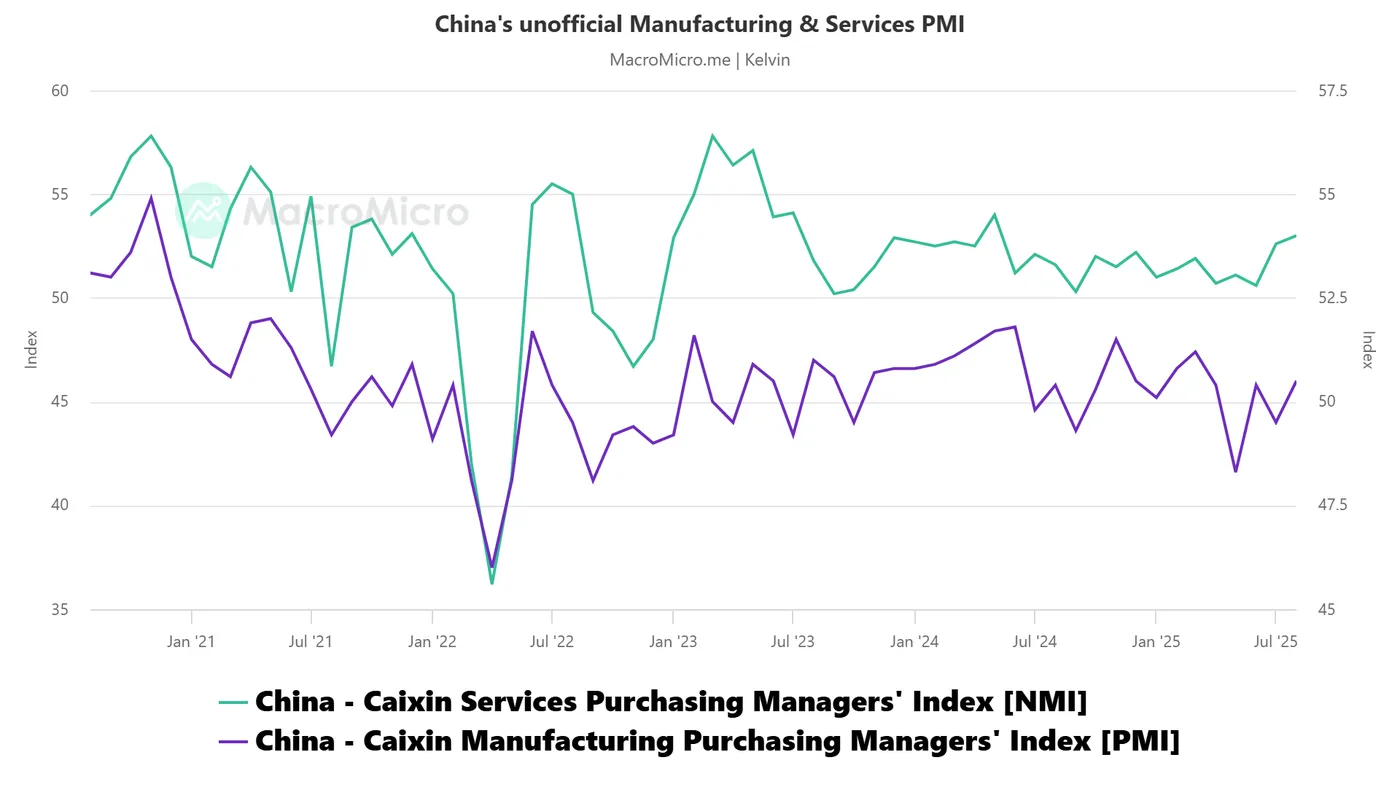
Fig. 2: China non-official Manufacturing & Services PMI as of Aug 2025 (Source: MacroMicro)
The monthly average of the 12-month forward earnings per share (EPS) growth for China’s CSI 300 (comprising component stocks from Shanghai and Shenzhen stock exchanges) has improved significantly in the past eight months; it rose from -7.4% y/y in January 2025 to -1.8% y/y in August 2025 (see Fig. 1).
The privately compiled (non-official) Manufacturing and Services PMIs, which track small and medium-sized enterprises in China, have returned to expansionary territory. The Manufacturing PMI rose to 50.5 in August 2025, recovering from a near three-year low of 48.3 in May. Similarly, the Services PMI strengthened to 53 in August, up from 50.6 in June (see Fig. 2).
These improvements in leading Chinese economic indicators suggest that deflation risks have eased, creating the potential for a positive feedback loop that could further support the Chinese stock market and, by extension, benefit Hong Kong equities.
Right now, let’s take a deep dive into the short-term (1 to 3 days) directional bias and key levels to watch on the Hong Kong 33 CFD Index.
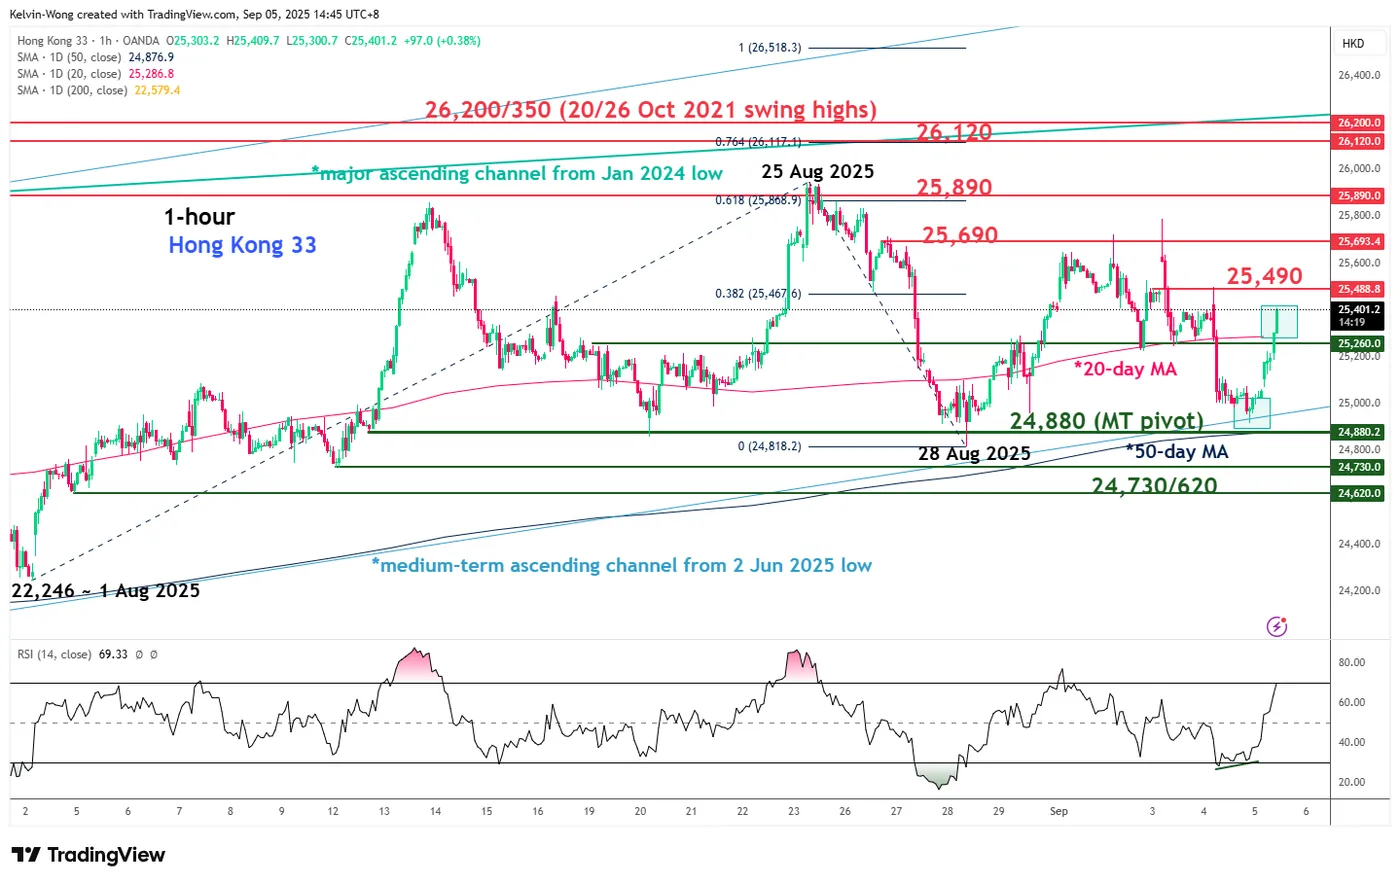
Fig. 3: Hong Kong 33 CFD Index minor trend as of 5 Sep 2025 (Source: TradingView)
Preferred trend bias (1-3 days)
The minor corrective decline from the 25 August 2025 high to the 28 August 2025 low of the Hong Kong 33 CFD Index is likely to have ended where a potential fresh bullish impulsive up move is in progress.
Bullish bias above 24,880 key medium-term pivotal support for the Hong Kong 33 CFD Index. A clearance above 25,490 intermediate resistances sees the next resistances coming in at 25,690, 25,890, and 26,120 in the first step (see Fig. 3).
Key elements
- The 24,880 key medium-term pivotal support on the Hong Kong 33 CFD Index is defined by the rising 50-day moving average, the lower boundary of the medium-term ascending channel from 2 June 2025 low, and the 61.8% Fibonacci retracement of the prior short-term bullish impulsive up move sequence from 1 August 2025 low to 25 August 2025 high.
- Today’s price actions of the Hong Kong 33 CFD Index have reintegrated back above the 20-day moving average, now acting as an intermediate support at 25,260.
- The hourly RSI momentum indicator of the Hong Kong 33 CFD Index has flashed out a bullish divergence condition at its oversold zone seen on Thursday’s US session, 4 September.
Alternative trend bias (1 to 3 days)
A break below the 24,880 key support jeopardizes the medium-term uptrend phase of the Hong Kong 33 CFD Index for an extension of the corrective decline to expose the next support zone of 24,730/24,620 in the first step.
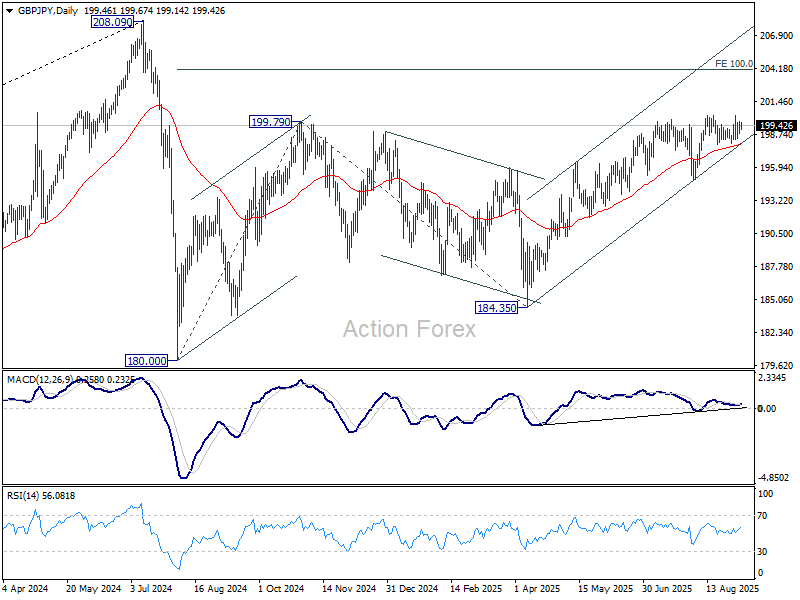
GBP/JPY Daily Outlook
Daily Pivots: (S1) 198.88; (P) 199.36; (R1) 199.95; More...
Intraday bias in GBP/JPY remains neutral as sideway trading continues. With 197.84 support intact, further rise is in favor. Firm break of 200.26 will confirm resumption of whole rise from 184.35, and that from 180.00. Further rally should then be seen to 100% projection of 180.00 to 199.79 from 184.35 at 204.14. On the downside, however, break of 197.93 support should confirm short term topping, and turn bias to the downside for 195.01 support next.
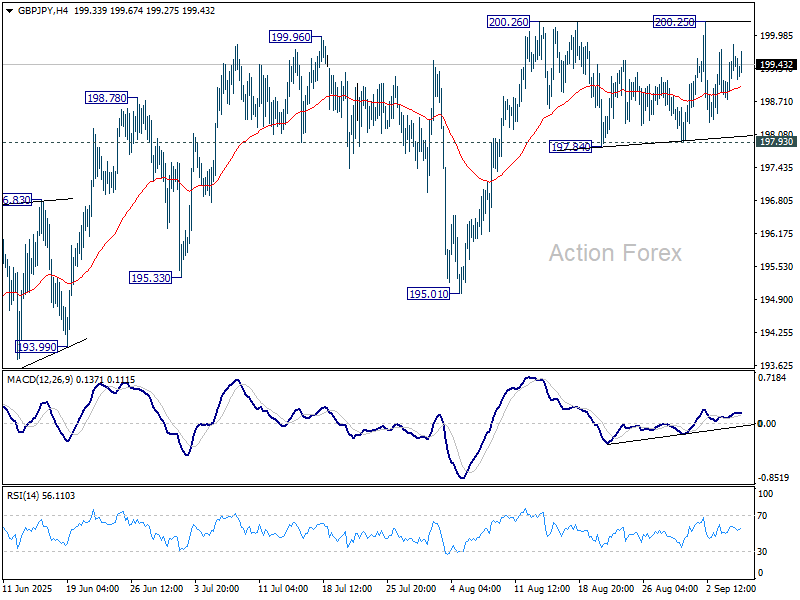
In the bigger picture, price actions from 208.09 (2024 high) are seen as a correction to rally from 123.94 (2020 low). The pattern might still extend with another falling leg. But in that case, strong support should be seen from 38.2% retracement of 123.94 to 208.09 at 175.94 to contain downside. Meanwhile, decisive break of 208.09 will confirm long term up trend resumption.
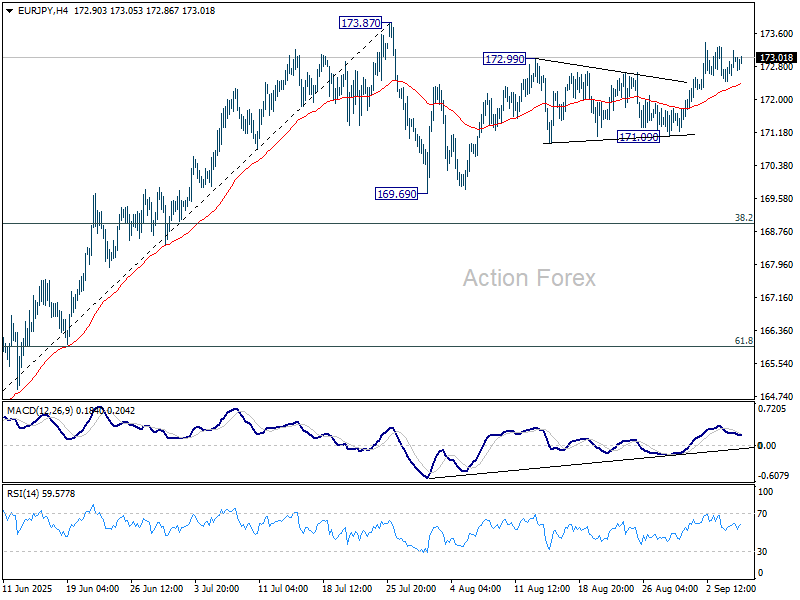
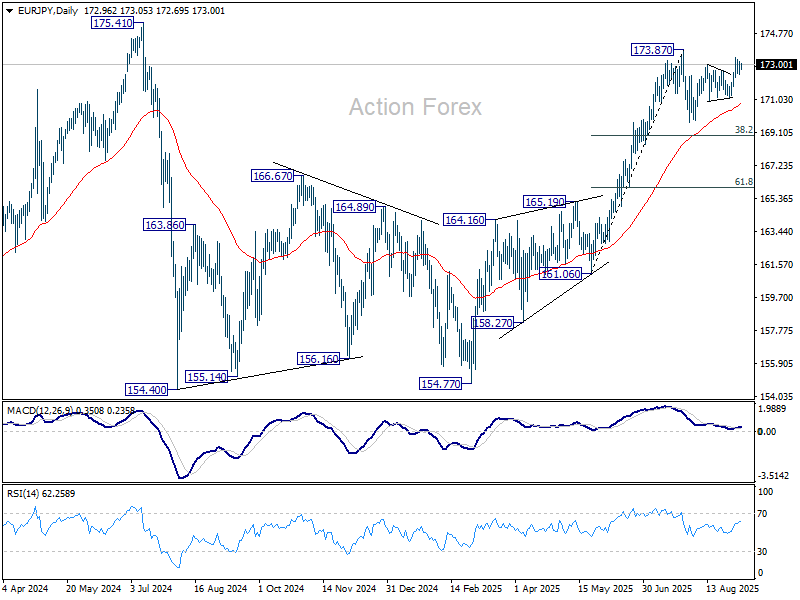
EUR/JPY Daily Outlook
Daily Pivots: (S1) 172.55; (P) 172.88; (R1) 173.31; More...
Further rise remains mildly in favor in EUR/JPY for retesting 173.87 high. Decisive break there will resume larger rally from 154.77, and target a retest on 175.41 key resistance. On the downside, however, break of 171.09 will turn bias to the downside for 169.69 support, and possibly below.
In the bigger picture, current rally from 154.77 is still tentatively seen as resuming the larger up trend. Firm break of 175.41 (2024 high) will confirm and target 61.8% projection of 124.37 to 175.41 from 154.77 at 186.31. However, sustained break of 38.2% retracement of 161.06 to 173.87 at 168.97 will delay this bullish case, and probably extend the correction from 175.41 with another fall.
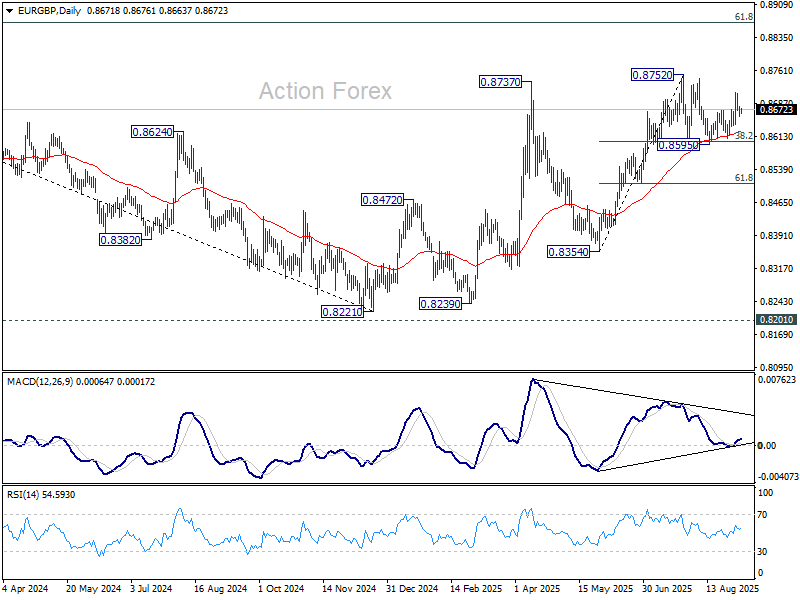
EUR/GBP Daily Outlook
Daily Pivots: (S1) 0.8661; (P) 0.8671; (R1) 0.8682; More...
Intraday bias in EUR/GBP is turned neutral with current retreat. On the upside, above 0.8711 will resume the rebound from 0.8595 to retest 0.8752 resistance. Firm break there will resume whole rally from 0.8221 to 0.8867 fibonacci level. On the downside, though, below 0.8636 support will turn bias back to the downside for 0.8595 instead.
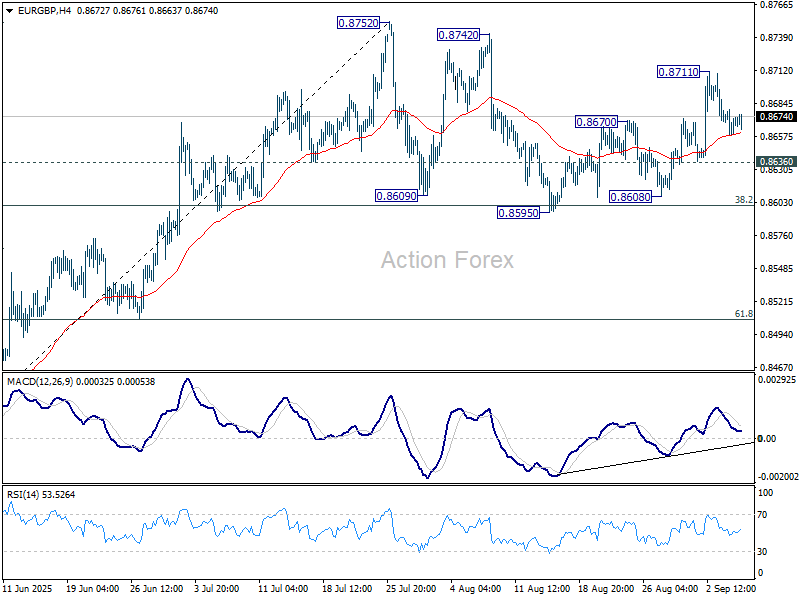
In the bigger picture, the structure from 0.8221 medium term bottom are not impulsive enough to suggest that it's reversing the down trend from 0.9267 (2022 high). But even if it's a correction, further rise could still be seen to 61.8% retracement of 0.9267 to 0.8221 at 0.8867. Nevertheless, sustained trading below 55 W EMA (now at 0.8513) will argue that the pattern has completed and bring retest of 0.8221 low.
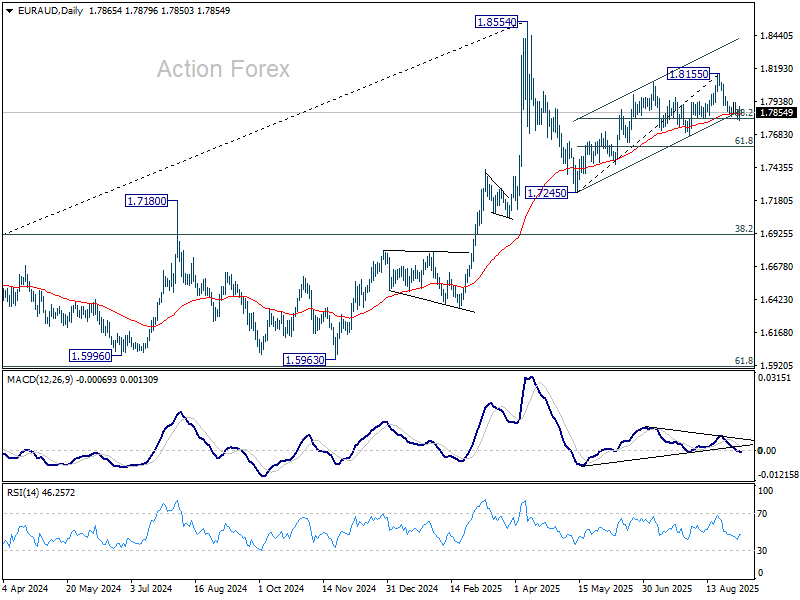
EUR/AUD Daily Outlook
Daily Pivots: (S1) 1.7790; (P) 1.7835; (R1) 1.7865; More...
Intraday bias in EUR/AUD remains neutral for the moment. On the downside, sustained break of 38.2% retracement of 1.7245 to 1.8155 at 1.7807should confirm that whole rise from 1.7245 has completed. Corrective pattern from 1.8554 should then be in its third leg. Further decline should be seen to 61.8% retracement at 1.7593. On the upside, break of 1.7932 resistance will retain near term bullishness and bring retest of 1.8155 resistance instead.
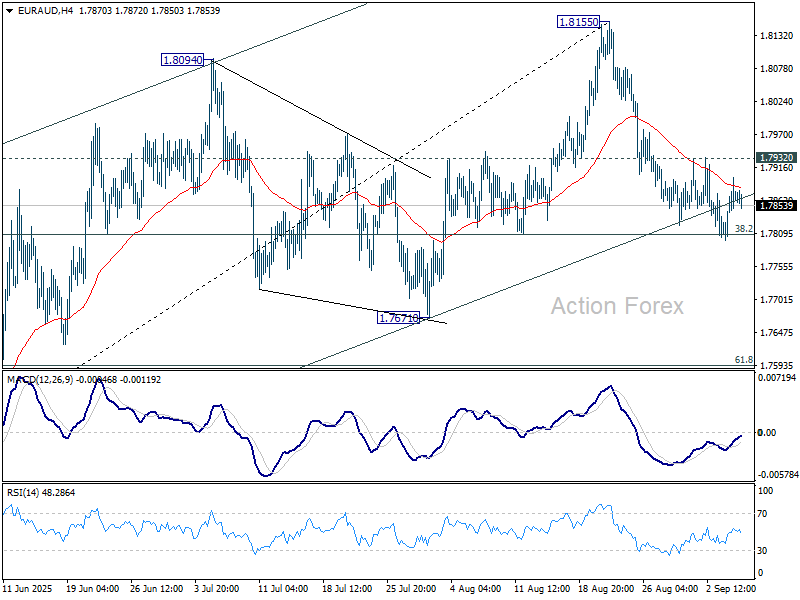
In the bigger picture, price actions from 1.8554 medium term top are seen as a corrective pattern. Such pattern could extend further with another falling leg. But even in that case, downside should be contained by 38.2% retracement of 1.4281 (2022 low) to 1.8554 at 1.6922 to bring rebound. Uptrend from 1.4281 is expected to resume at a later stage.
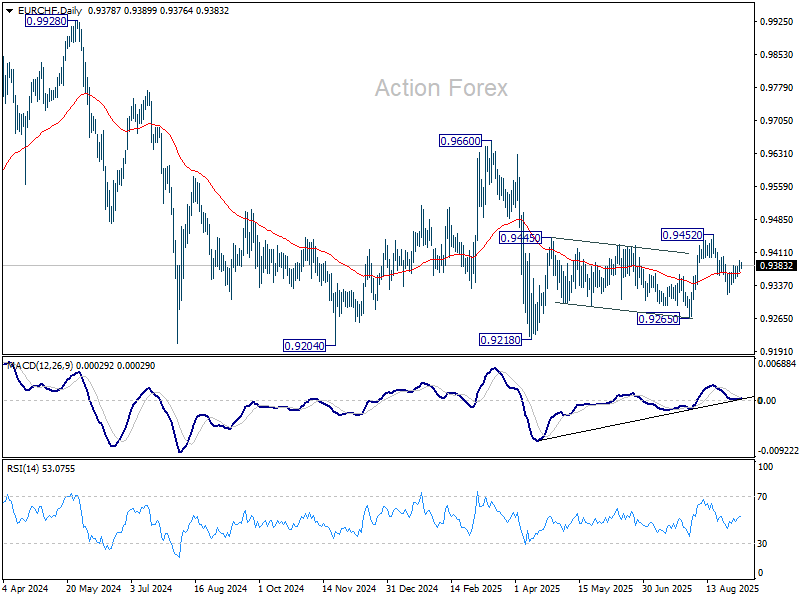
EUR/CHF Daily Outlook
Daily Pivots: (S1) 0.9368; (P) 0.9381; (R1) 0.9399; More....
Intraday bias in EUR/CHF remains neutral for the moment. Outlook is unchanged at corrective pattern from 0.9218 might have completed with three waves up to 0.9452 already. Further decline is in favor as long as 0.9403 resistance holds. On the downside, below 0.9352 minor support will turn bias back to the downside. Further break of 0.9317 will target a retest on 0.9204 low. Nevertheless, break of 0.9403 will dampen this view and bring stronger rise back to 0.9452 resistance instead.
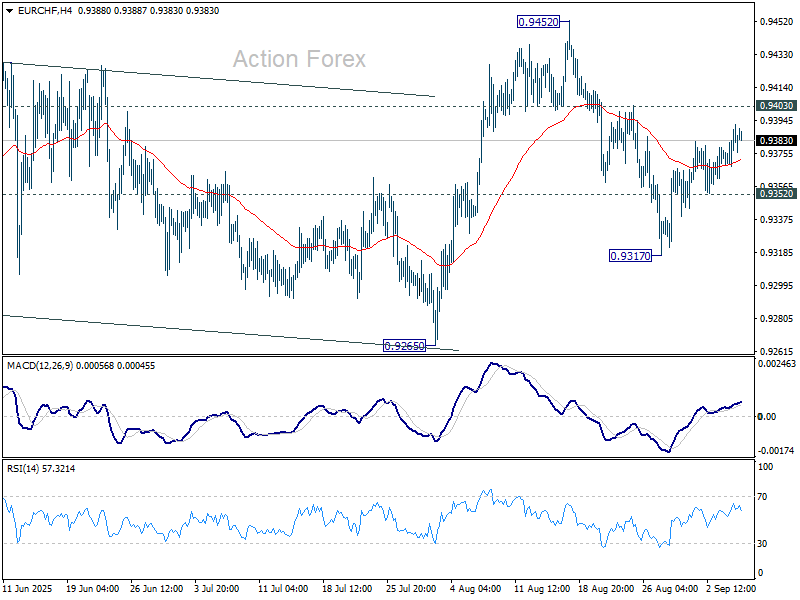
In the bigger picture, the down trend from 0.9204 (2018 high) might still be in progress considering that EUR/CHF is staying well inside the long term falling channel. However, with bullish convergence condition in W MACD, downside potential should be limited in case of another fall. Instead, firm break of 0.9660 resistance will be an important sign of medium term bullish trend reversal.
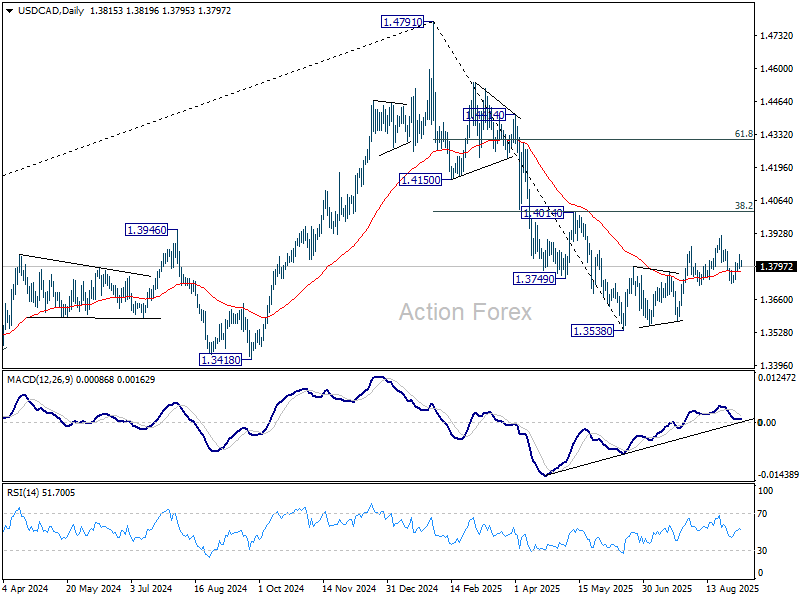
USD/CAD Daily Outlook
Daily Pivots: (S1) 1.3792; (P) 1.3819; (R1) 1.3845; More...
Further rise is mildly in favor in USD/CAD For retesting 1.3923. Firm break there will resume whole corrective rise from 1.3538. On the downside, however, sustained break of 1.3720 support will indicate that the rise from 1.3538 has completed, and turn bias back to the downside for 1.3538/74 support zone.
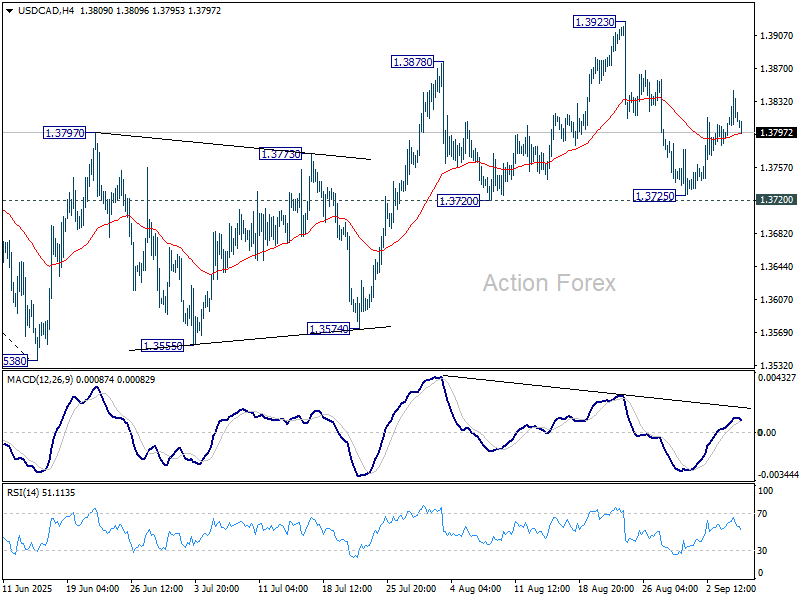
In the bigger picture, price actions from 1.4791 medium term top could either be a correction to rise from 1.2005 (2021 low), or trend reversal. In either case, further decline is expected as long as 1.4014 cluster resistance (38.2% retracement of 1.4791 to 1.3538 at 1.4017) holds. Next target is 61.8% retracement of 1.2005 (2021 low) to 1.4791 at 1.3069.