Sample Category Title
XBR/USD Chart Analysis: Oil Price Declines Towards Key Support
As the XBR/USD chart shows, Brent crude oil has made two significant moves recently:
- Last week’s price increase (A) followed President Donald Trump’s intentions to impose tariffs on India due to its purchases of Russian oil. This could have disrupted established oil supply chains.
- The price decline (B) may have been driven by both the decision of OPEC+ countries to increase production and reports of a weakening US labour market.
Thus, there is reason to believe that the more than 4.5% decline in Brent crude oil prices since the beginning of August reflects market participants’ scepticism about sustained high oil prices:
→ this has a negative impact on the US economy (JP Morgan analysts raised concerns about recession risks this week);
→ increased activity from oil producers may offset supply chain disruption risks.
Technical Analysis of the XBR/USD Chart
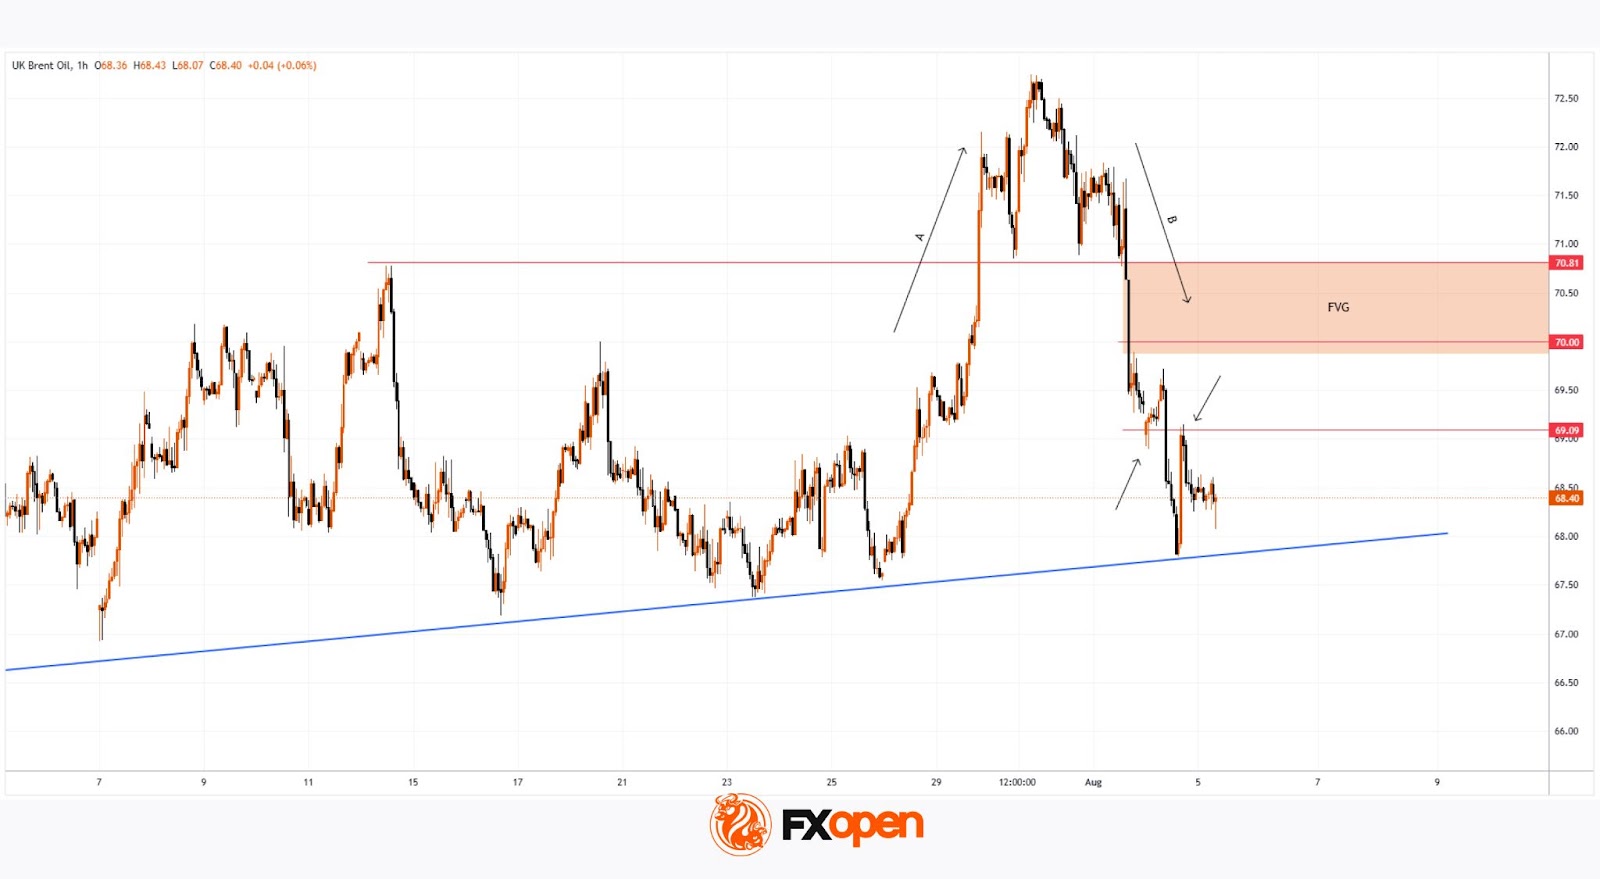
From a technical analysis perspective, Brent crude oil has dropped to a key support level (marked in blue), which was previously active in July. A rebound from this line could happen – in such a case, the price might face resistance at the Fair Value Gap area (marked in orange), formed between:
→ $70.81 – a support level active in late July, which was broken;
→ the psychological level of $70.00.
Attention should also be paid to price behaviour around the $69.00 level (indicated by arrows) – it quickly switched roles from support to resistance, indicating aggressive bearish sentiment. Given this observation, a potential bearish breakout attempt below the blue support line cannot be ruled out.
However, whether this scenario materialises will largely depend on developments in geopolitical risks and tariff agreements.
Start trading commodity CFDs with tight spreads. Open your trading account now or learn more about trading commodity CFDs with FXOpen.
This article represents the opinion of the Companies operating under the FXOpen brand only. It is not to be construed as an offer, solicitation, or recommendation with respect to products and services provided by the Companies operating under the FXOpen brand, nor is it to be considered financial advice.
US ISM services fall to 50.1, worrisome mix of soaring prices, shrinking employment
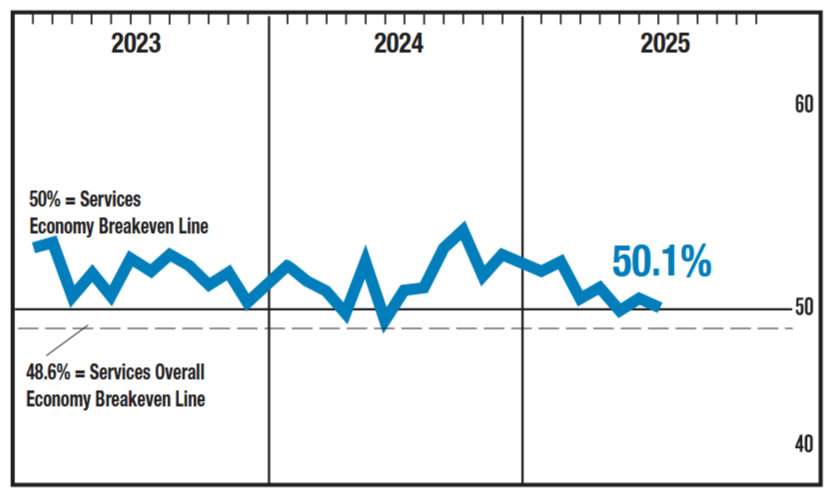
U.S. ISM Services PMI fell from 50.8 to 50.1, below consensus of 51.5. Business activity declined from 54.2 to 52.6, while new orders dropped from 54.2 to 50.3. Notably, new export orders fell sharply from 51.1 to 47.9, marking the fourth contraction so far this year. The employment index also weakened further, down to 46.4 from 47.2.
The only upside surprise came from the Prices Paid index, which jumped from 67.5 to 69.9 — the highest reading since October 2022. The inflation gauge has now stayed above 60 for eight consecutive months, signaling persistent pricing pressure across the services economy.
According to ISM, the faster expansion in prices alongside continued employment weakness is a "worrisome development," even as the overall index barely remains in expansion territory. The July reading corresponds to a meager 0.5% annualized GDP growth.
Canada’s Trade Deficit Widened in June; Exports See Slight Uptick
Canada's trade deficit widened from $5.5 billion in May to $5.9 billion in June.
Exports rebounded for a second consecutive month, albeit modestly (+0.9% m/m). This still leaves Canadian exports almost 10% lower than March's pre-plunge levels. Exports to the U.S. also jumped (3.1% m/m) for a second consecutive month. Export growth was seen in 6 of 11 product sections, with shipments of energy products (+3.8% m/m) making the largest contributions. A 3.8% m/m decrease in metal and non-metallic exports and double digit drops in steel & aluminum exports tempered the headline gain.
Goods imports on the other hand were up 1.4% m/m in June after three consecutive months of contracting. Notably, the gain was very narrowly-based, with a majority coming from sizeable 27.7% m/m increase in industrial machinery, equipment and parts imports.
In volume terms, merchandise exports were down 0.4% m/m while imports increase 1.5% m/m in June.
Canada's merchandise trade surplus with the United States widened slightly to $3.9 billion as of June, as exports gained more than imports.
Exports to countries other than the United States pulled back slightly but remain elevated at ~30%.
Key Implications
With a full quarter of trade data in the books, net trade is expected to put a substantial dent into Q2 GDP growth, something we had anticipated for several months. Trade weakness and broader trade uncertainty show no signs of abating–not least due to Canada and U.S.' inability to strike a new trade deal last week leading to a higher 35% tariff on some goods. On a positive note, Canadian export rotation into non-U.S. markets is appearing to have some staying power, a trend policymakers would like to see persist.
It is hard to fall off the floor, and Canadian exports are widely expected to slowly continue their bounce back from the lowest level in nearly five years in April. It is the sectors impacted by tariffs– steel, aluminum, autos, and energy–that continue to disproportionally bear the brunt of the shock. Meanwhile, we may be nearing the upper-end of USMCA compliant exports, as the compliance rate of Canadian goods crossing the border has flatlined at around 60% for the last three months.
Dollar Stabilizes as Yields Find Footing, Yen Reverses After Early Strength
Dollar is trading mixed in early US trading on Tuesday, reflecting a cautious tone across the broader market. Treasury yields appeared to have found a foothold, with 10-year stabilizing around 4.2%, helping to curb recent Dollar softness. Traders appear to be waiting for the next catalyst — likely today’s ISM Services data — to drive a more decisive move in yields and FX.
US President Donald Trump’s wide-ranging CNBC interview, which touched on Fed leadership and upcoming tariffs, stirred little immediate market reaction. Still, the content could hold longer-term implications for monetary policy and trade. Trump indicated he has narrowed the list of potential Fed chair successors to four names, excluding current Treasury Secretary Scott Bessent. The field is believed to include Kevin Warsh, Kevin Hassett, and possibly Fed Governor Christopher Waller — all considered policy doves.
Trump didn’t rule out the possibility of appointing a “shadow chair” to undermine Jerome Powell before his term ends in May 2026. That comment, while speculative, will likely raise eyebrows among investors concerned about central bank independence. The identity and stance of the next Fed chair — or their perceived influence — could become a growing driver of market expectations in the coming months.
Currency markets remain broadly indecisive. Yen is the weakest performer today sofar, reversing early gains seen during the Asian session. Euro follows as the second-softest, while the Kiwi also underperforms. Sterling is leading the day, boosted by relative strength in crosses, with Aussie and Dollar rounding out the top three. Swiss Franc and Canadian Dollar are sitting in the middle of the pack.
On the trade front, Trump revealed plans to impose new tariffs on semiconductors and chip imports, citing the need to re-shore manufacturing. He said the announcement could come “within the next week or so,” but offered few specifics.
Meanwhile, Switzerland is scrambling to head off a 39% tariff hike on its exports to the US. Swiss President Karin Keller-Sutter and Economy Minister Guy Parmelin have flown to Washington to hold emergency talks with US officials. The Swiss government has offered to improve its trade terms, but it remains unclear whether the outreach will lead to a meeting with Trump or concrete concessions.
European data wrap: Eurozone PMI leaves room for one more ECB cut
In the Eurozone, PPI rose 0.8% mom and 0.6% yoy in June, slightly missing monthly expectations but beating on the annual rate. Energy prices surged 3.2% on the month, offsetting modest gains elsewhere. Intermediate goods prices slipped -0.2%, reflecting some ongoing input cost disinflation in the manufacturing sector.
More encouragingly, Eurozone PMI Services was finalized at 51.0 in July, up from June’s 50.5. Composite PMI rose to 50.9 from 50.6. Germany and Italy showed gains, while Spain led the bloc at a five-month high of 54.7. France, however, slipped to a three-month low of 48.6. HCOB noted that services inflation is easing, with input costs growing at the slowest pace in nine months. That, alongside decelerating wage growth, strengthens the case for one more ECB rate cut in the second half of the year.
In the UK, the tone was more cautious. July’s PMI Services was finalized at 51.8, down from June’s 52.8, while Composite PMI eased to 51.5 from 52.0. Despite softer prints, S&P Global noted that business confidence improved, supported by receding US tariff concerns and hopes for domestic rate cuts later this year.
BoJ minutes hint at hikes post-tariff deal, AUD/JPY extends decline
BoJ’s June meeting minutes, released today, confirmed that several policymakers were open to resuming rate hikes once trade uncertainty subsides. While the minutes are somewhat dated — the meeting took place before the announcement of the US–Japan trade agreement — they reveal a growing consensus that the central bank may return to a normalization path sooner than previously expected. Markets are now turning to Friday’s Summary of Opinions from the more recent July meeting, which should reflect a more upbeat outlook following the tariff deal.
Some BoJ members noted that as wages remain firm and inflation slightly exceeds expectations, the Bank would likely "shift away from the current wait-and-see approach and consider resuming rate hikes, if trade friction de-escalates" Others emphasized that while the BoJ should pause rate hikes for now due to uncertainty, it must stay “flexible and nimble,” ready to resume hikes depending on US policy and global developments.
China’s Caixin Services PMI surges to 52.6, on stronger demand and renewed optimism
China’s Caixin Services PMI jumped sharply from 50.6 to 52.6 in July, well ahead of expectations at 50.4, marking the fastest pace of expansion since May 2024. PMI Composite, however, fell from 51.3 to 50.8 as dragged down by weak manufacturing.
According to S&P Global’s Jingyi Pan, the rise was driven by better domestic demand and a notable improvement in external demand, with new export business expanding for the first time in three months. Business sentiment also improved, reaching the highest level since March.
Firms also began hiring again, albeit mostly part-time. Importantly, companies felt confident enough to raise output charges for the first time in six months — a sign that inflation pressures are being more easily passed on to clients.
USD/JPY Mid-Day Outlook
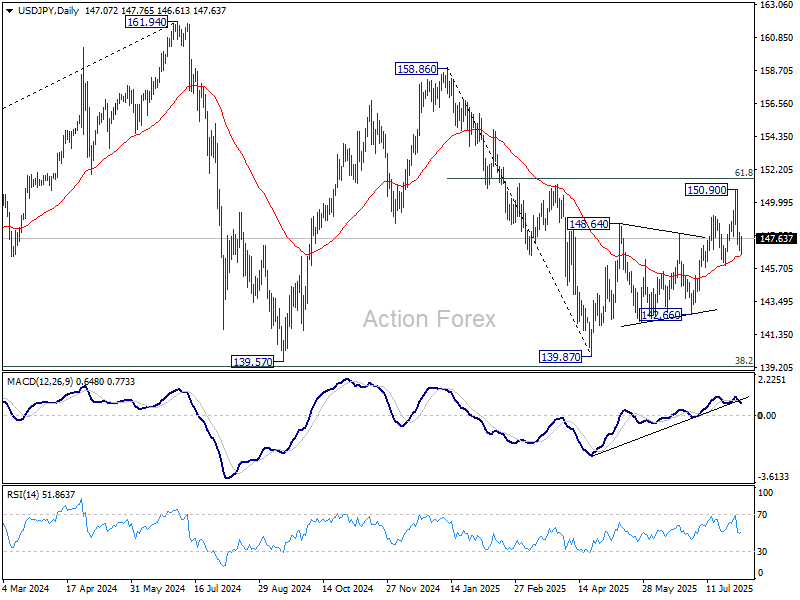
Daily Pivots: (S1) 146.60; (P) 147.35; (R1) 147.82; More...
USD/JPY recovered after brief dip to 146.61 and outlook is unchanged. Intraday bias stays neutral at this point. As long as 145.84 support holds, larger rebound from 139.87 is still in favor to continue. On the upside, above 148.07 minor resistance will bring stronger rebound back to retest 150.90. However, on the downside, firm break of 145.84 support will argue that whole rise from 139.87 might have already completed. Deeper fall should then be seen to 142.66 support for confirmation.
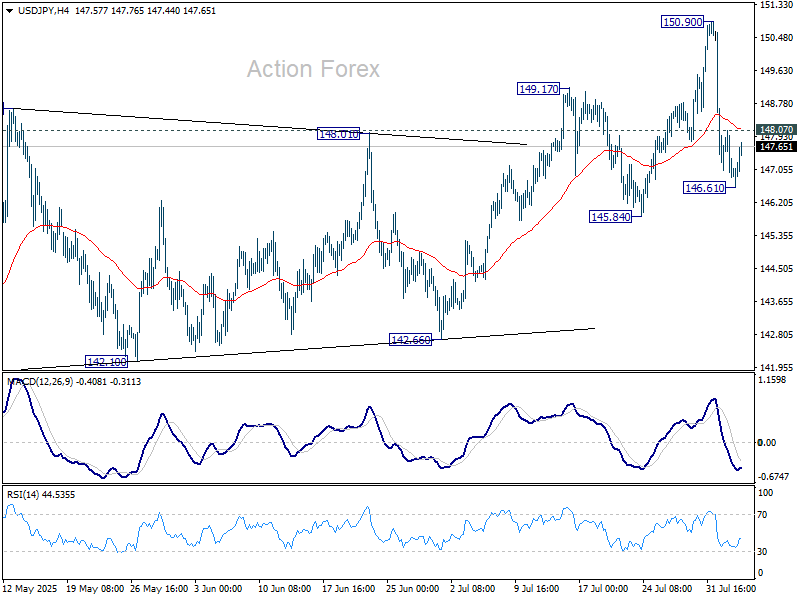
In the bigger picture, price actions from 161.94 (2024 high) are seen as a corrective pattern to rise from 102.58 (2021 low). Decisive break of 61.8% retracement of 158.86 to 139.87 at 151.22 will argue that it has already completed with three waves at 139.87. Larger up trend might then be ready to resume through 161.94 high. In case the corrective pattern extends with another fall, strong support is expected from 38.2% retracement of 102.58 to 161.94 at 139.26 to bring rebound.
EUR/USD Mid-Day Outlook
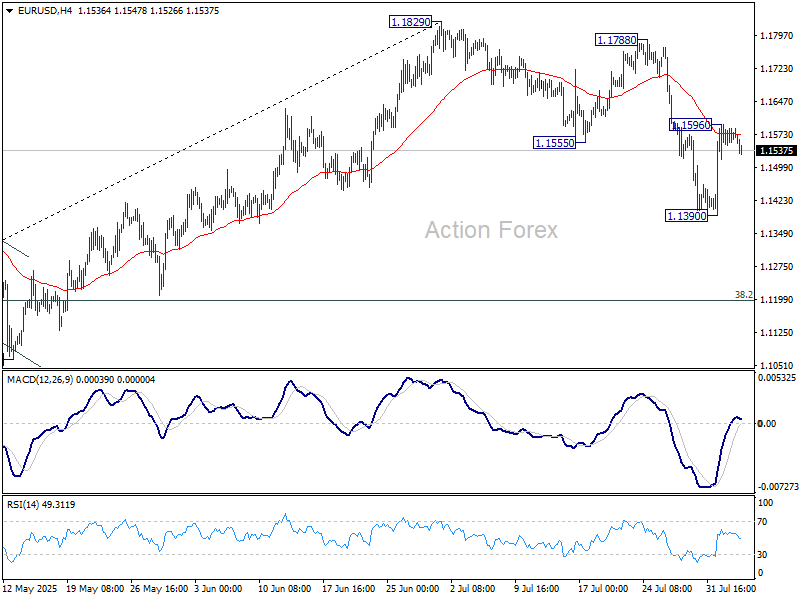
Daily Pivots: (S1) 1.1549; (P) 1.1573; (R1) 1.1596; More...
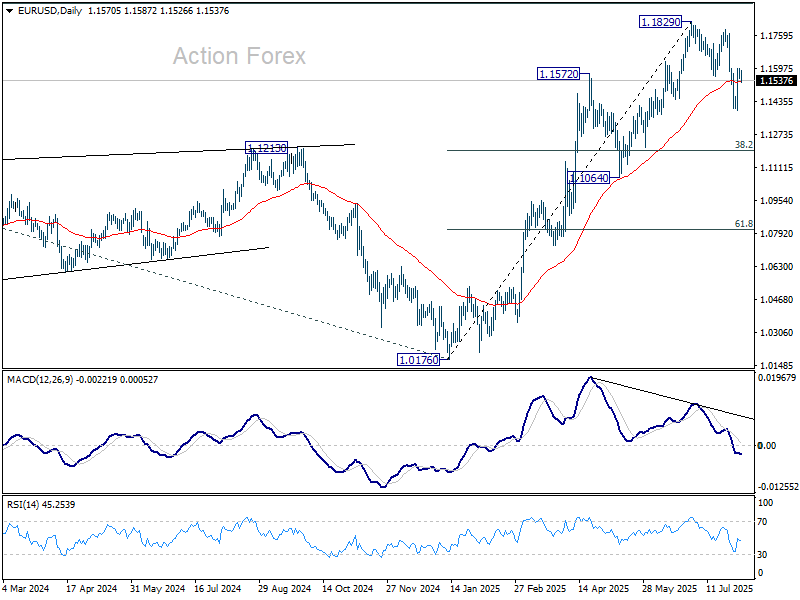
Intraday bias in EUR/USD stays neutral at this point. On the upside, above 1.1596 will affirm the case that correction from 1.1829 has completed with three waves at 1.1390. Further rally should then be seen to retest 1.1788/1820 resistance zone. On the downside, break of 1.1390 will resume the correction to 38.2% retracement of 1.0176 to 1.1829 at 1.1198 instead.
In the bigger picture, rise from 0.9534 long term bottom could be correcting the multi-decade downtrend or the start of a long term up trend. In either case, further rise should be seen to 100% projection of 0.9534 to 1.1274 from 1.0176 at 1.1916. This will remain the favored case as long as 1.1604 support holds.
GBP/USD Mid-Day Outlook
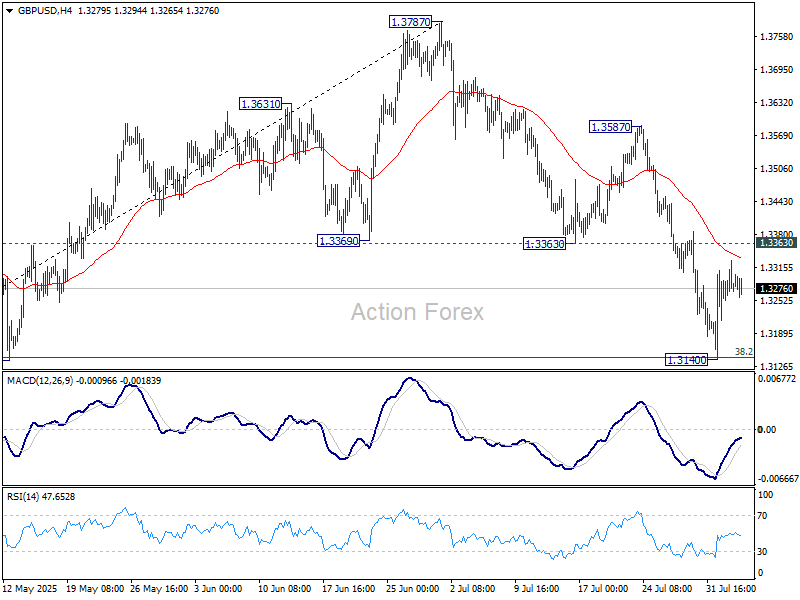
Daily Pivots: (S1) 1.3249; (P) 1.3290; (R1) 1.3326; More...
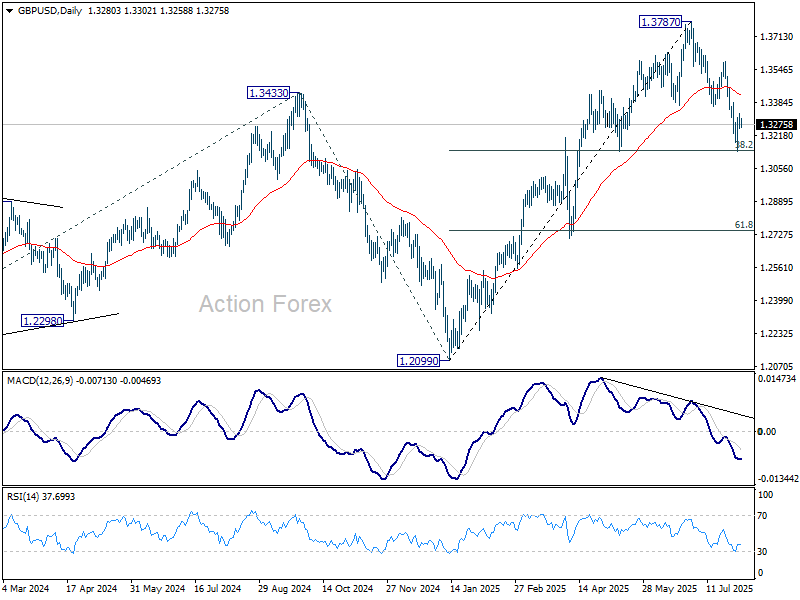
No change in GBP/USD's outlook and intraday bias stays neutral for the moment. On the upside, sustained break of 1.3363 support turned resistance will indicate that the fall has completed as a three-wave correction. Further rally should then be seen back to 1.3587 resistance next. Nevertheless, sustained trading below 38.2% retracement of 1.2099 to 1.3787 at 1.3142 will target 61.8% retracement at 1.2744.
In the bigger picture, up trend from 1.3051 (2022 low) is in progress. Next medium term target is 61.8% projection of 1.0351 to 1.3433 from 1.2099 at 1.4004. Outlook will now stay bullish as long as 55 W EMA (now at 1.3049) holds, even in case of deep pullback.
USD/CHF Mid-Day Outlook
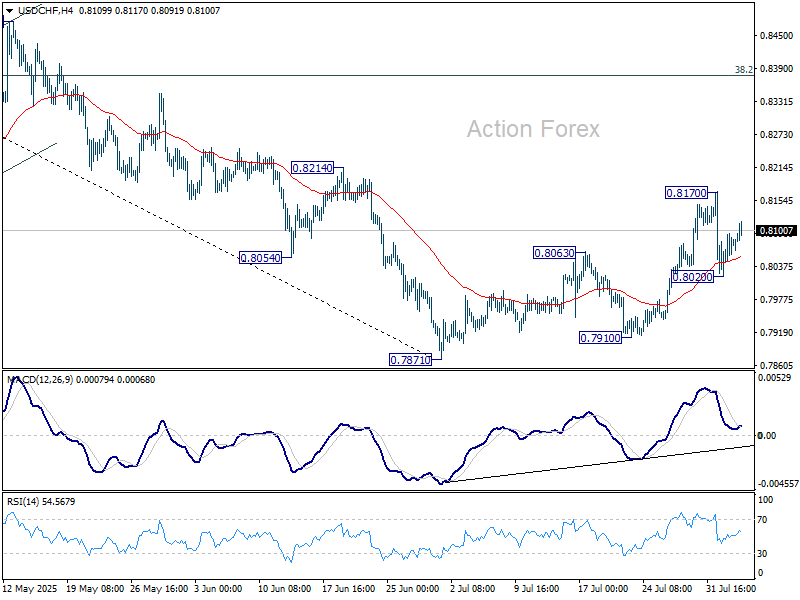
Daily Pivots: (S1) 0.8043; (P) 0.8070; (R1) 0.8111; More….
Intraday bias in USD/CHF stays neutral for the moment. On the downside, below 0.8020 will affirm that case that corrective bounce from 0.7871 has completed at 0.8170. Bias will be back on the downside for 07871/7910 support zone. On the upside, though, break of 0.8170 will resume the rise from 0.7871 to 38.2% retracement of 0.9200 to 0.7871 at 0.8379 instead.
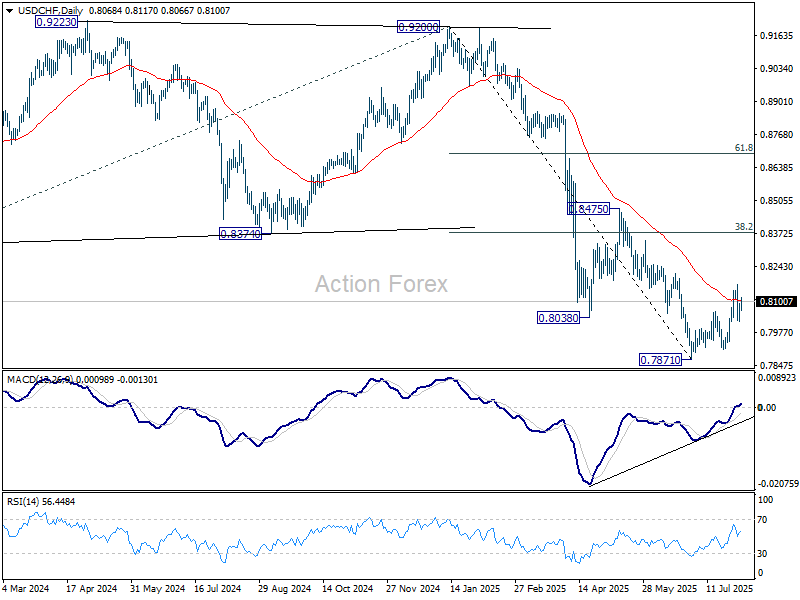
In the bigger picture, long term down trend from 1.0342 (2017 high) is still in progress. Next target is 100% projection of 1.0146 (2022 high) to 0.8332 from 0.9200 at 0.7382. In any case, outlook will stay bearish as long as 0.8475 resistance holds.
USD/JPY Mid-Day Outlook
Daily Pivots: (S1) 146.60; (P) 147.35; (R1) 147.82; More...
USD/JPY recovered after brief dip to 146.61 and outlook is unchanged. Intraday bias stays neutral at this point. As long as 145.84 support holds, larger rebound from 139.87 is still in favor to continue. On the upside, above 148.07 minor resistance will bring stronger rebound back to retest 150.90. However, on the downside, firm break of 145.84 support will argue that whole rise from 139.87 might have already completed. Deeper fall should then be seen to 142.66 support for confirmation.
In the bigger picture, price actions from 161.94 (2024 high) are seen as a corrective pattern to rise from 102.58 (2021 low). Decisive break of 61.8% retracement of 158.86 to 139.87 at 151.22 will argue that it has already completed with three waves at 139.87. Larger up trend might then be ready to resume through 161.94 high. In case the corrective pattern extends with another fall, strong support is expected from 38.2% retracement of 102.58 to 161.94 at 139.26 to bring rebound.
What Does Gold Need to Climb to New Record Highs?
- Gold has been the biggest gainer year-to-date.
- Dovish Fed bets after soft NFP benefited the metal.
- Higher tariffs could increase safe-haven demand.
- Central bank purchases are also a driving variable.
Rise and shine
Gold has been the biggest performer among the major assets under our radar since the beginning of the year, outperforming even the crypto king Bitcoin. Although it has been range-bound since it hit a record high of $3,500 in April, investors still have the opportunity to lock profits of around 30% this year.
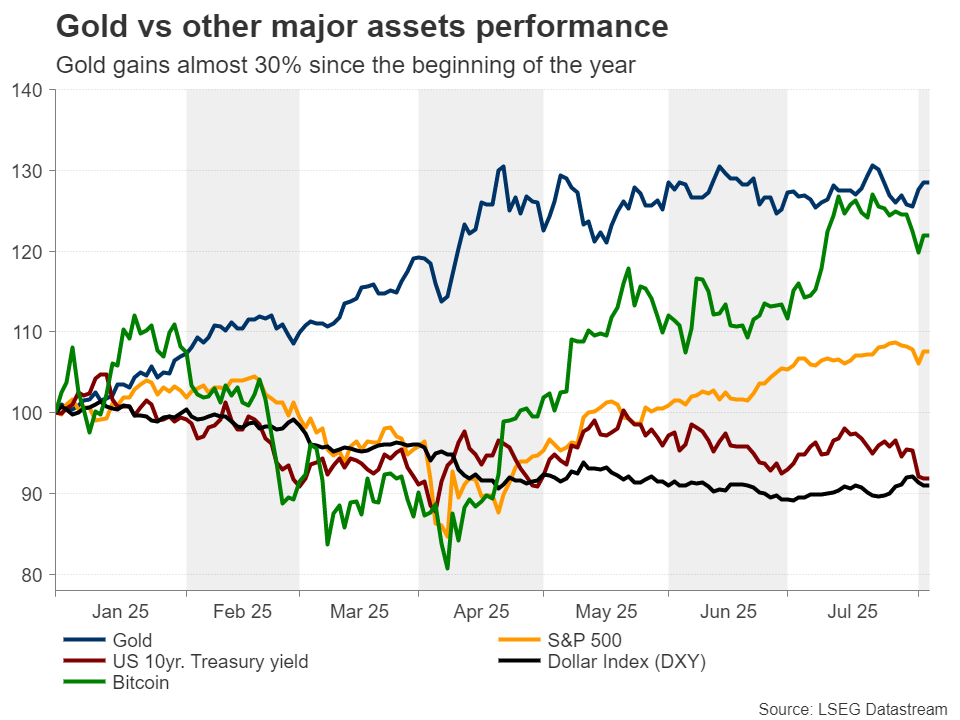
On Friday, the precious metal rebounded strongly from around the $3,280 zone after the US nonfarm payrolls for July disappointed, increasing speculation that the Fed may need to cut interest rates more aggressively than previously thought. As gold’s correlation with the US dollar and Treasury yields has strengthened in the last three months or so, the slide in the greenback and borrowing cost allowed gold to spike higher as the opportunity cost for holding the precious metal declined.
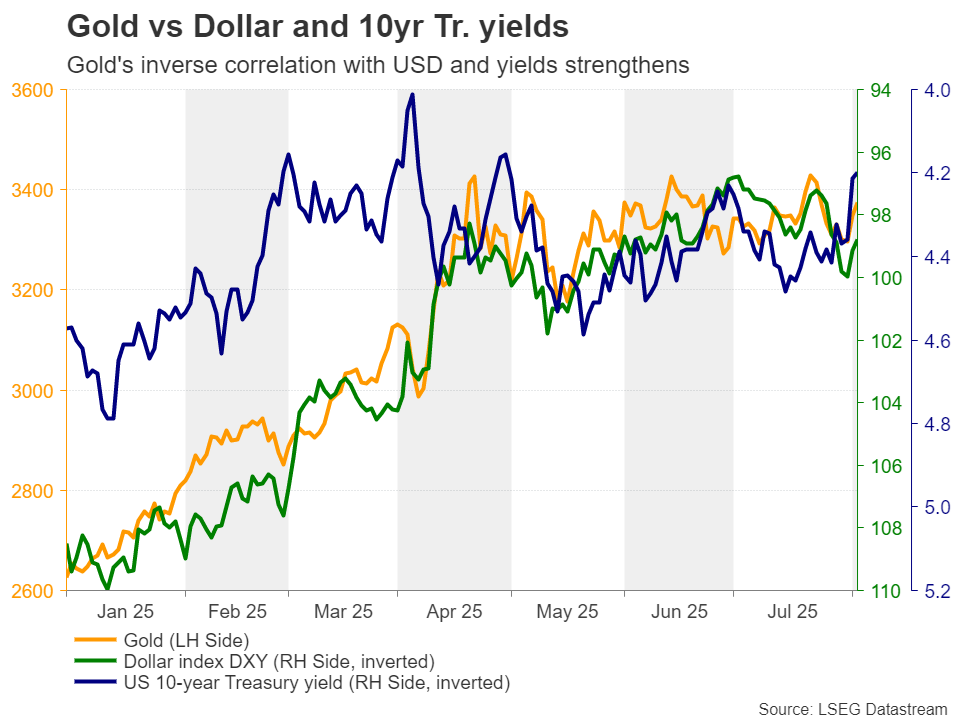
Opportunity cost falls amid dovish Fed bets
In terms of Fed expectations, according to Fed funds futures, a September quarter-point rate reduction is now nearly fully priced in, despite Fed Chair Powell reiterating his wait-and-see approach at the latest FOMC decision, at a time when investors were penciling only a 60% chance of a September rate reduction. As for the total number of basis points expected to be cut by year end, it rose from 45 to 60, suggesting that the market has once again turned a bit more dovish than the Fed itself.
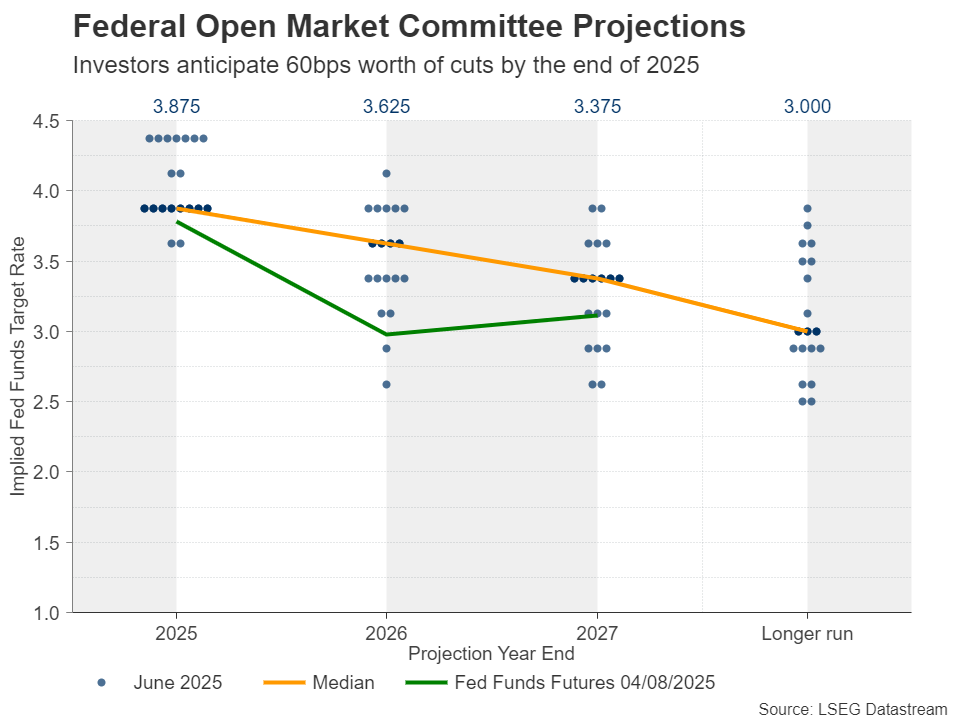
This means that should US data continue to disappoint, dovish bets are likely to increase, allowing gold to extend its recovery and perhaps resume its prevailing uptrend.
Are gold traders “tarrified”?
But what could be the catalyst for a deteriorating US outlook? The answer is: Tariffs. On August 1, which was the deadline for the grace period regarding reciprocal tariffs, Trump announced steep duties on imports from dozens of countries, with the rates ranging from 10% to 41%. The levies are set to kick in on August 7, with a 35% tariff on Canadian goods already in effect.
Yes, ahead of the August 1 tariff deadline, the dollar was acting as a safe haven, gaining ground when Trump was hardening his stance, and pulling back on easing tensions. However, although the US secured deals with some of its major trading allies, like the UK, Japan and the EU, the massive duties announced on Friday heighten not only the upside risks to US inflation but also add to concerns about the performance of the global economy. Thus, should upcoming US economic releases revive recession fears, the US dollar could extend its tumble on speculation that the Fed may prioritize safeguarding economic activity even if that means allowing inflation to run hot for a while longer. Gold could benefit from that, as well as from increasing safe-haven demand amid heightened uncertainty.
Central bank demand increases in June
Besides the Fed and Trump’s tariffs, another variable that needs to be examined are central bank purchases, especially from the People's Bank of China (PBoC). The latest data available is for the month of June and although outdated, it is revealed that demand saw a modest increase for the third consecutive month. Back then, the deadline for finding common ground with the US was July 9 and perhaps central banks rushed into gold in order to further loosen their dependency on the US dollar should things fall out of orbit.
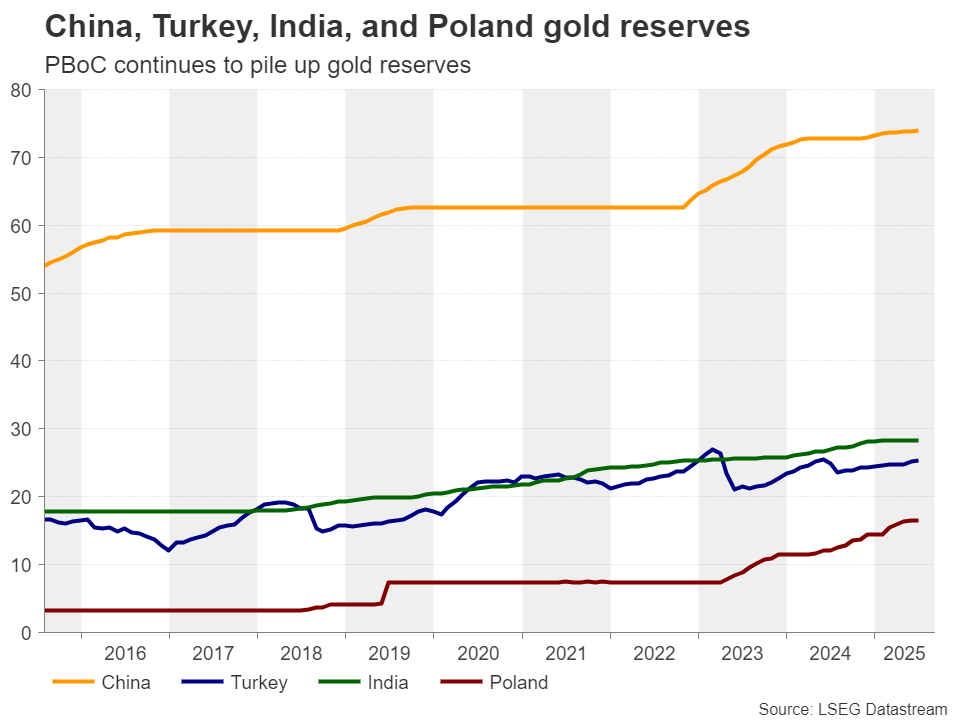
From here onwards, the spotlight falls on the PBoC as the world’s two largest economies failed to agree on extending a 90-day pause on tariffs during the latest round of talks in Stockholm, Sweden, last week. The deadline for a US-China trade deal is August 12, and should no common ground be found until then, tariffs could surge above 100% again. A new full-blown trade war between those two economic powerhouses could prompt Chinese officials to resume the selling of US Treasuries in favor of buying gold.
Gold rebounds, but stays range-bound for now
From a technical standpoint, gold rebounded from near the $3,280 zone on Friday, which has been acting as the lower boundary of the sideways range that’s been containing most of the price action since May 20. The upper bound is around $3,440 and since the price is still within the range, the near-to-medium-term outlook remains neutral.
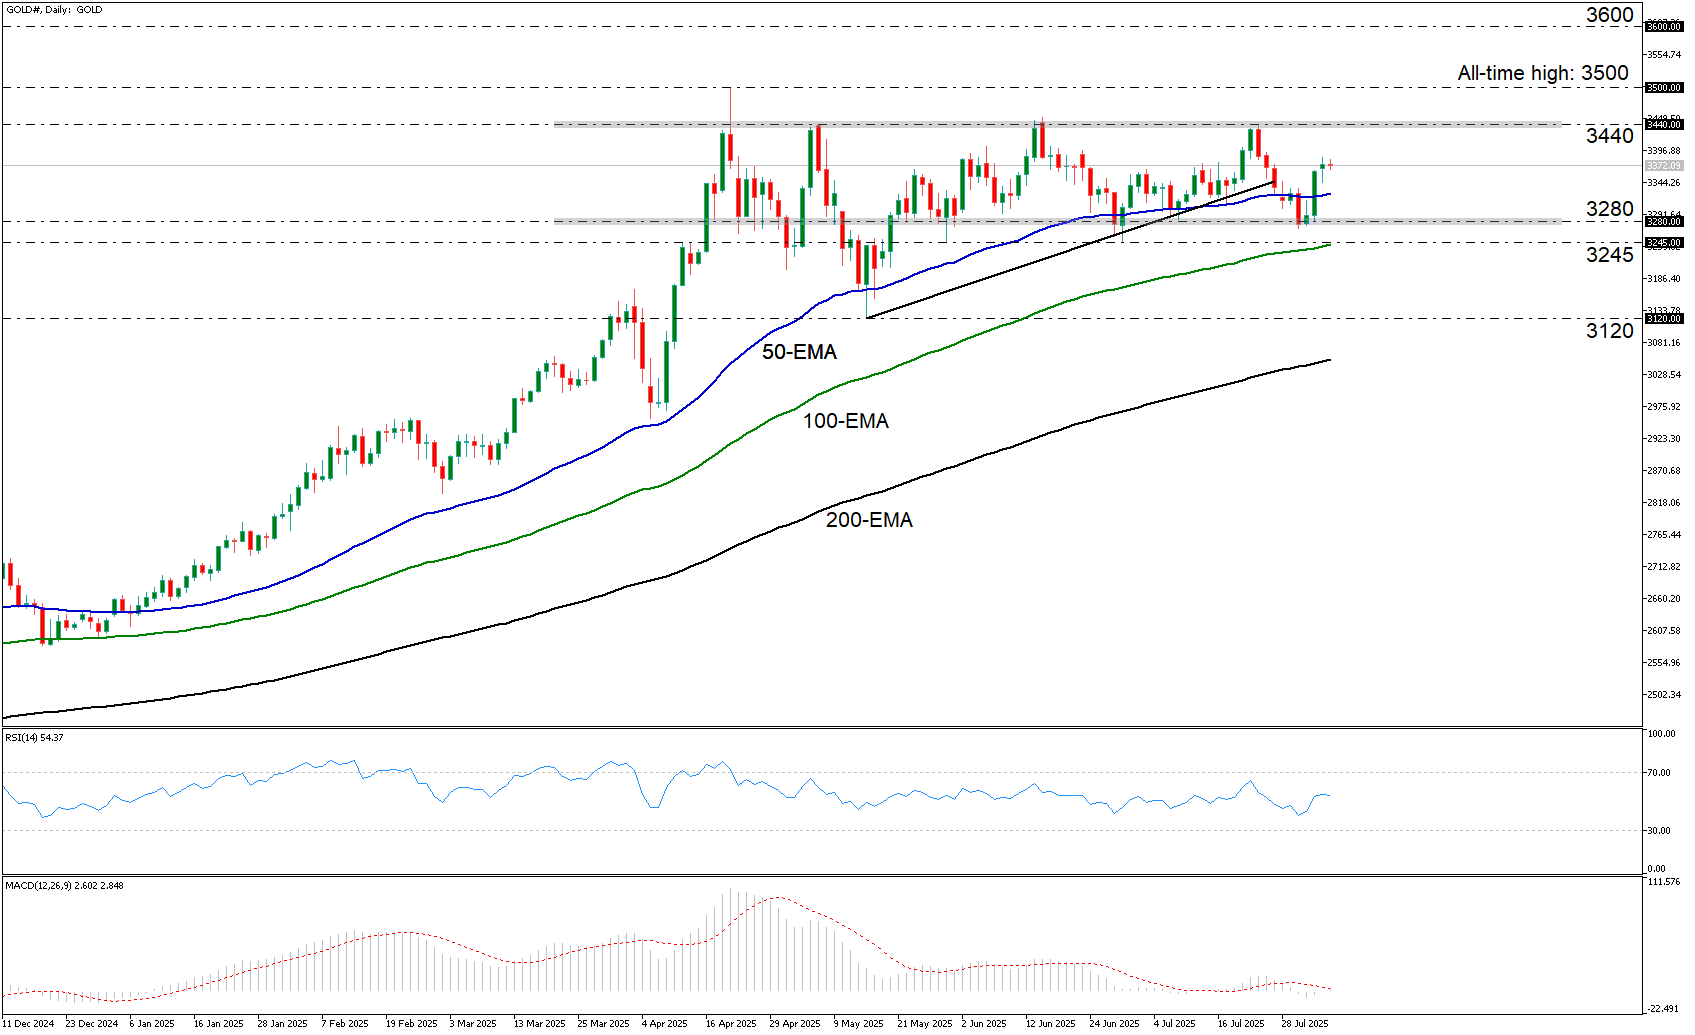
For the prevailing uptrend to resume, a break above $3,440 may be needed. Such a move may initially target the record high of $3,500, hit on April 22, the break of which could aim for the next round figure of $3,600. On the downside, a break below the lower bound of the range at $3,280 could initially aim for the $3,245 barrier, marked by the lows of May 29 and June 30. A move lower could intensify speculation about a bearish trend reversal.
EUR/USD Wavers After NFP Bounce
- EUR/USD stalls NFP rally near 1.1600.
- Technical signals are mixed.
- Break above 1.1760 could revive bullish appetite.
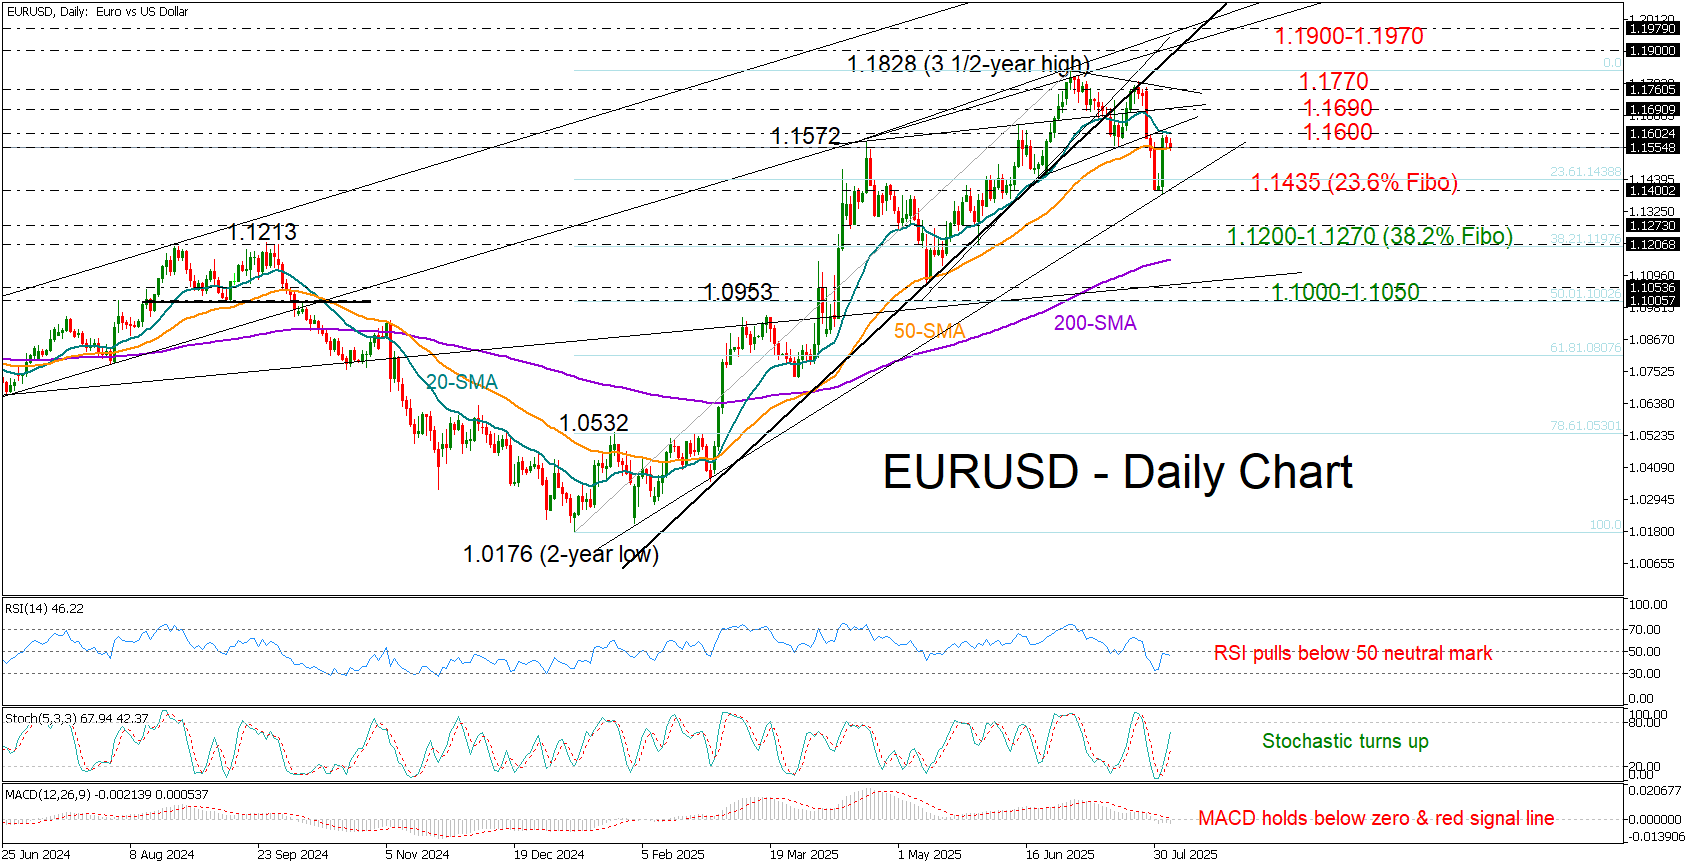
EUR/USD failed to attract sufficient buying interest to extend Friday’s post-NFP rally above its 20-day simple moving average (SMA) and the psychological 1.1600 level on Monday.
Price momentum remains weak for a second consecutive day, raising concerns that the recent rebound from the eight-week low of 1.1390 may be just a temporary correction within the developing downtrend that began in July.
However, technical signals are currently mixed. A bullish hammer candlestick pattern formed last week, and an upward-sloping stochastic oscillator are counterbalancing the bearish signals from the falling RSI and MACD.
The 50-day SMA, currently at 1.1554, is now in focus. A move below this level could undermine bullish hopes and push the price back toward the 1.1400 support zone. A deeper decline could lead the bears into the 1.1200–1.1270 region – a key area that includes the 38.2% Fibonacci retracement of the 2025 uptrend – and possibly bring the 200-day SMA near 1.1150 into play.
On the upside, if the pair manages to climb above its 20-day SMA, immediate resistance could be found between 1.1690 and 1.1760. A decisive close above this area could revive bullish sentiment, potentially opening the door for a new higher high around the 1.1900–1.1980 trendline zone.
Summing up, EUR/USD is currently in a neutral phase. Despite Friday’s sharp rebound, the bulls will need to reclaim the 20-day SMA at 1.1600 to regain control. Failure to do so, especially a drop below 1.1550, could invite renewed selling pressure.