
Sample Category Title
USD/CHF Daily Outlook
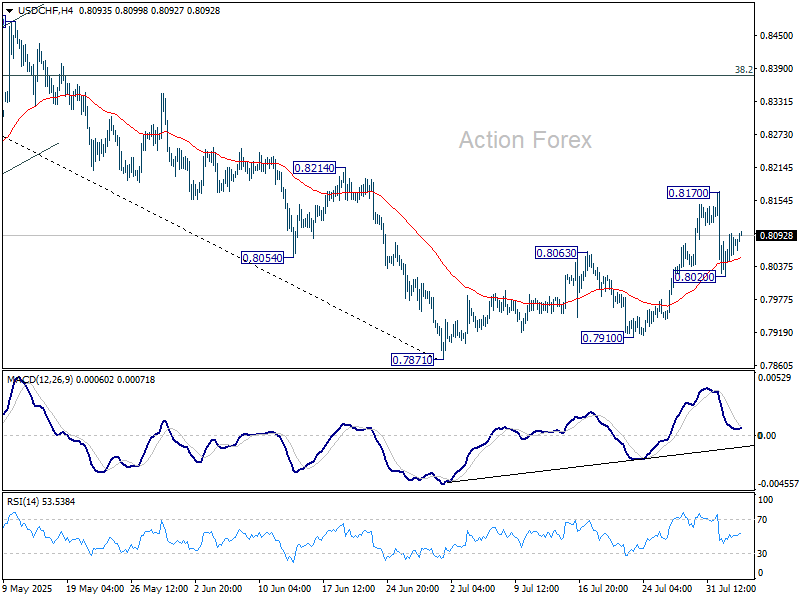
Daily Pivots: (S1) 0.8043; (P) 0.8070; (R1) 0.8111; More….
USD/CHF recovered after drawing support from 55 4H EMA (now at 0.8053) and intraday bias is turned neutral first. On the downside, below 0.8020 will affirm that case that corrective bounce from 0.7871 has completed at 0.8170. Bias will be back on the downside for 07871/7910 support zone. On the upside, though, break of 0.8170 will resume the rise from 0.7871 to 38.2% retracement of 0.9200 to 0.7871 at 0.8379 instead.
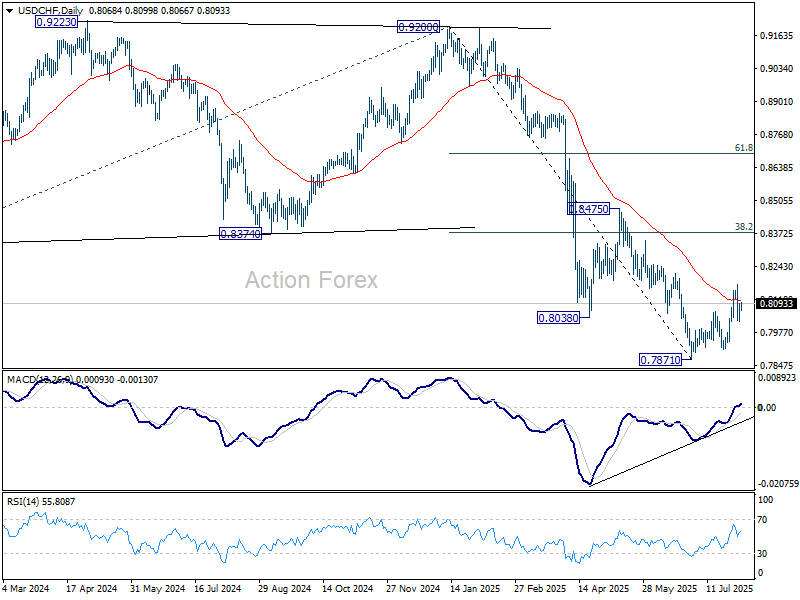
In the bigger picture, long term down trend from 1.0342 (2017 high) is still in progress. Next target is 100% projection of 1.0146 (2022 high) to 0.8332 from 0.9200 at 0.7382. In any case, outlook will stay bearish as long as 0.8475 resistance holds.
AUD/USD Daily Report
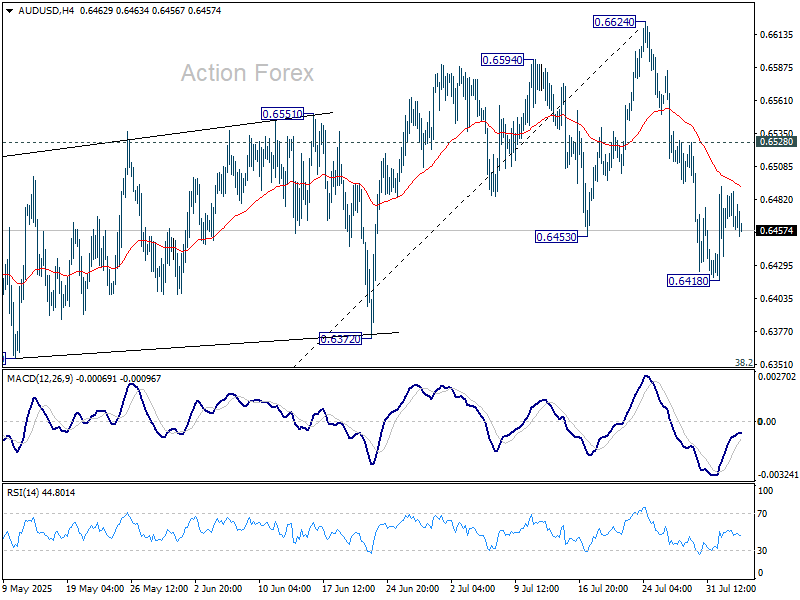
Daily Pivots: (S1) 0.6454; (P) 0.6472; (R1) 0.6485; More...
Intraday bias in AUD/USD remains neutral for the moment, and risk will stay on the downside as long as 0.6528 resistance holds. Fall from 0.6624 short term top is seen as at least correcting the rally from 0.5913. Below 0.6418 will target 38.2% retracement of 0.5913 to 0.6624 at 0.6352. Nevertheless, break of 0.6528 will dampen this bearish case, and bring retest of 0.6624 high instead.
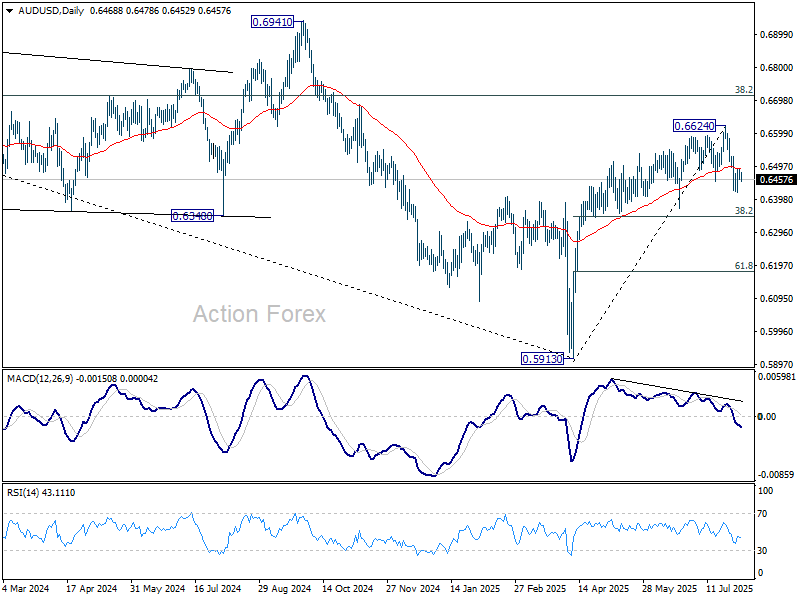
In the bigger picture, there is no clear sign that down trend from 0.8006 (2021 high) has completed. Rebound from 0.5913 is seen as a corrective move. While stronger rally cannot be ruled out, outlook will remain bearish as long as 38.2% retracement of 0.8006 to 0.5913 at 0.6713 holds. Nevertheless, considering bullish convergence condition in W MACD, even in case of another fall through 0.5913, downside should be contained above 0.5506 (2020 low).
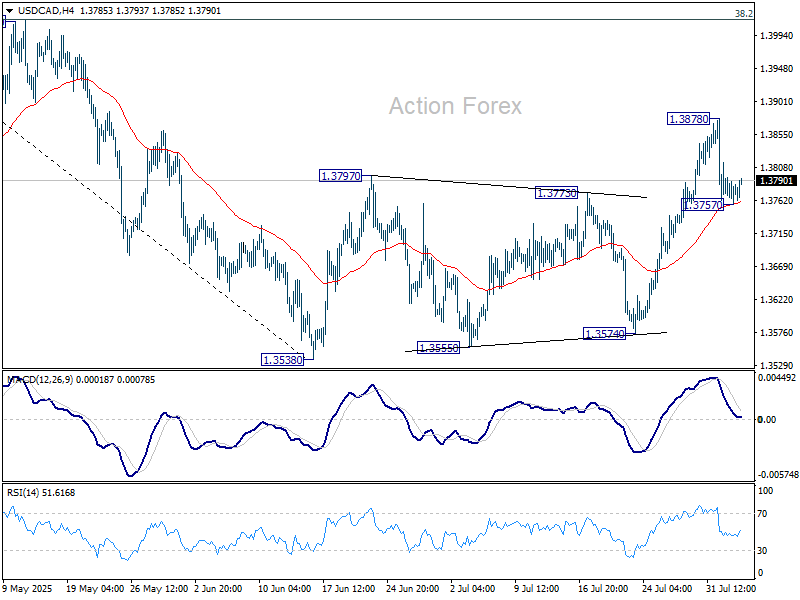
USD/CAD Daily Outlook
Daily Pivots: (S1) 1.3760; (P) 1.3778; (R1) 1.3796; More...
Intraday bias in USD/CAD remains neutral at this point. On the upside, break of 1.3878 bring stronger rally, but upside should be limited by 1.4014 cluster resistance (38.2% retracement of 1.4791 to 1.3538 at 14017) to complete the correction. On the downside, sustained trading below 55 4H EMA (now at 1.3755) will bring retest of 1.3538 low.
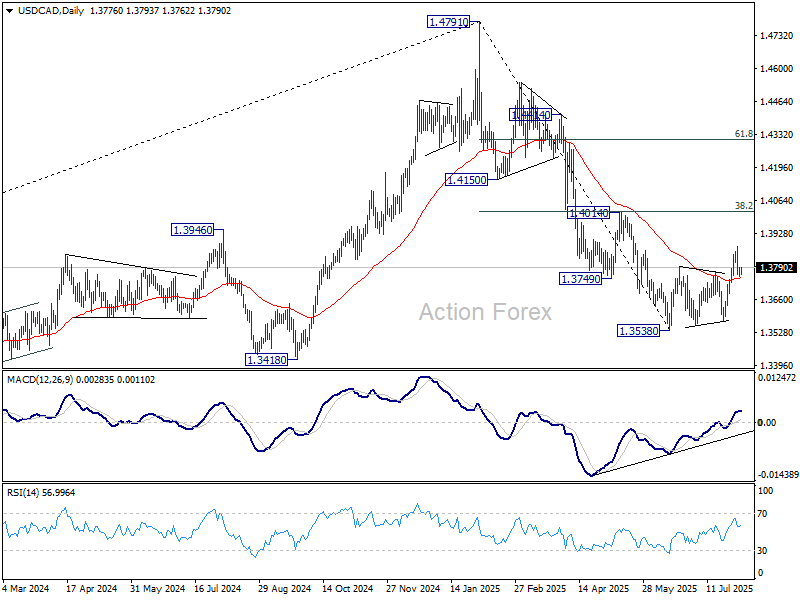
In the bigger picture, price actions from 1.4791 medium term top could either be a correction to rise from 1.2005 (2021 low), or trend reversal. In either case, further decline is expected as long as 1.4014 resistance holds. Next target is 61.8% retracement of 1.2005 (2021 low) to 1.4791 at 1.3069.
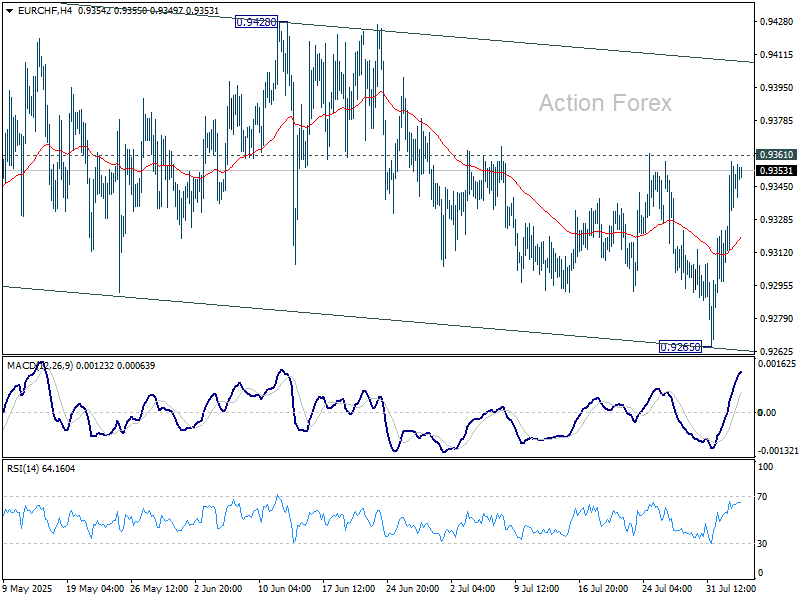
EUR/CHF Daily Outlook
Daily Pivots: (S1) 0.9324; (P) 0.9342; (R1) 0.9372; More....
Intraday bias in EUR/CHF remains neutral with focus back on 0.9361 resistance. Firm break there will suggest that corrective pattern from 0.9445 has already completed at 0.9265. Further rise should then be seen to 0.9428 resistance for confirmation. However, below 0.9265 will bring another fall back to retest 0.9218 low.
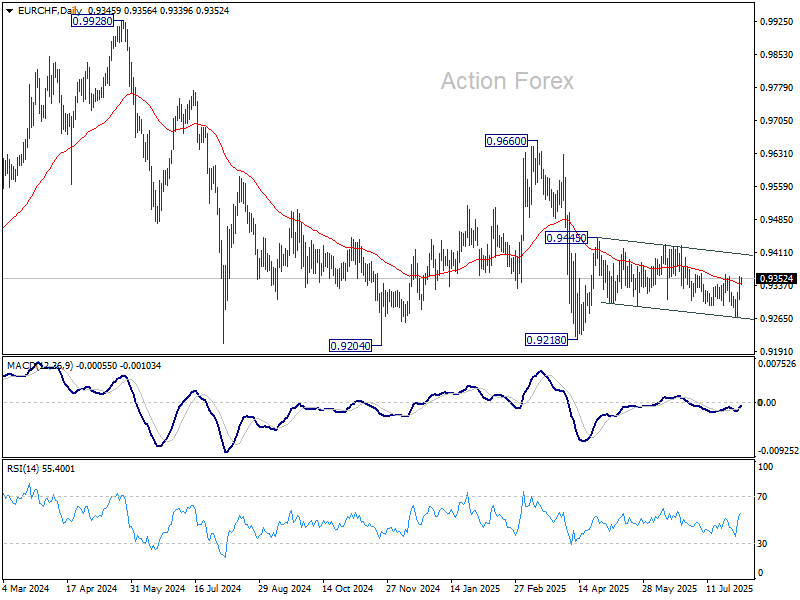
In the bigger picture, the down trend from 0.9204 (2018 high) might still be in progress considering that EUR/CHF is staying well inside the long term falling channel. However, with bullish convergence condition in W MACD, downside position should be limited in case of another fall. Instead, firm break of 0.9660 resistance will be an important sign of medium term bullish trend reversal.
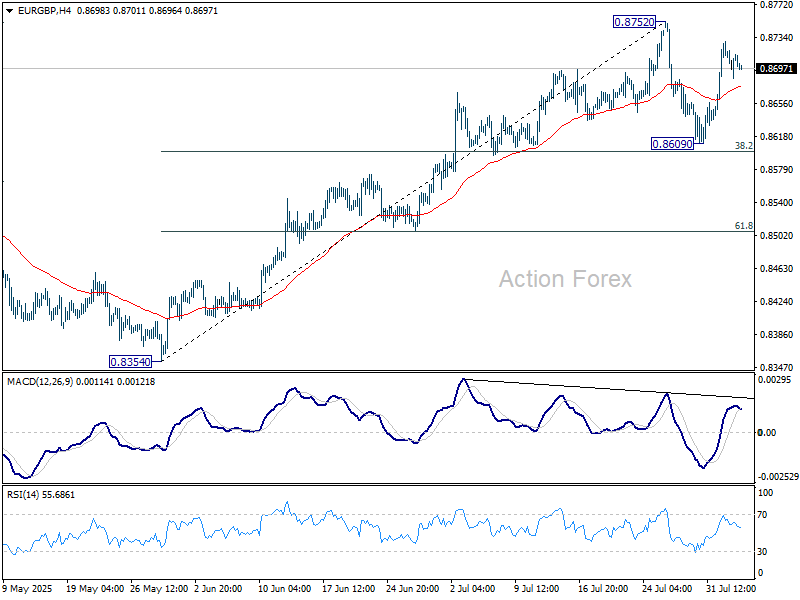
EUR/GBP Daily Outlook
Daily Pivots: (S1) 0.8689; (P) 0.8709; (R1) 0.8732; More...
Range trading continues in EUR/GBP and intraday bias remains neutral. Consolidations could extend below 0.8572 short term top. But in case of another fall, downside should be contained by 38.2% retracement of 0.8354 to 0.8752 at 0.8600. On the upside, firm break of 0.8752 will resume the rise from 0.8354 towards 0.8867 fibonacci level.
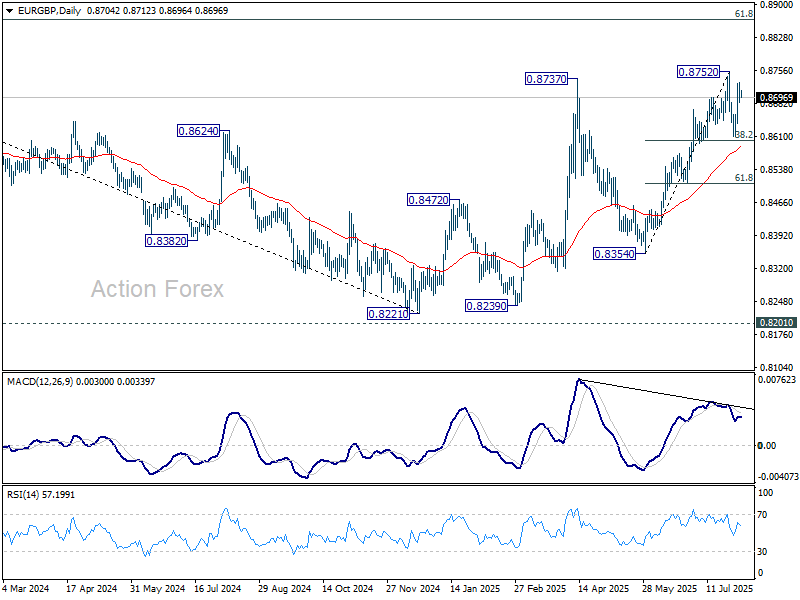
In the bigger picture, the structure from 0.8221 medium term bottom are not impulsive enough to suggest that it's reversing the down trend from 0.9267 (2022 high). But even if it's a correction, further rise is expected to 61.8% retracement of 0.9267 to 0.8221 at 0.8867. This will remain the favored case as long as 55 W EMA (now at 0.8493) holds.
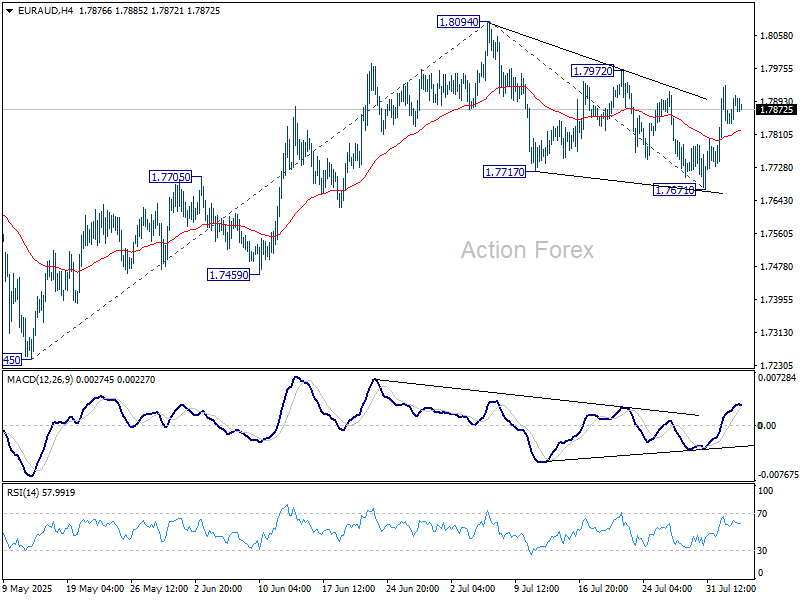
EUR/AUD Daily Outlook
Daily Pivots: (S1) 1.7844; (P) 1.7891; (R1) 1.7942; More...
No change in EUR/AUD's outlook and intraday bias remains neutral. On the upside, break of 1.7972 resistance should resume the whole rally from 1.7245 through 1.8094 to 61.8% projection of 1.7245 to 1.8094 from 1.7671 at 1.8196. On the downside, below 1.7671 will bring deeper fall back to 1.7459 support instead.
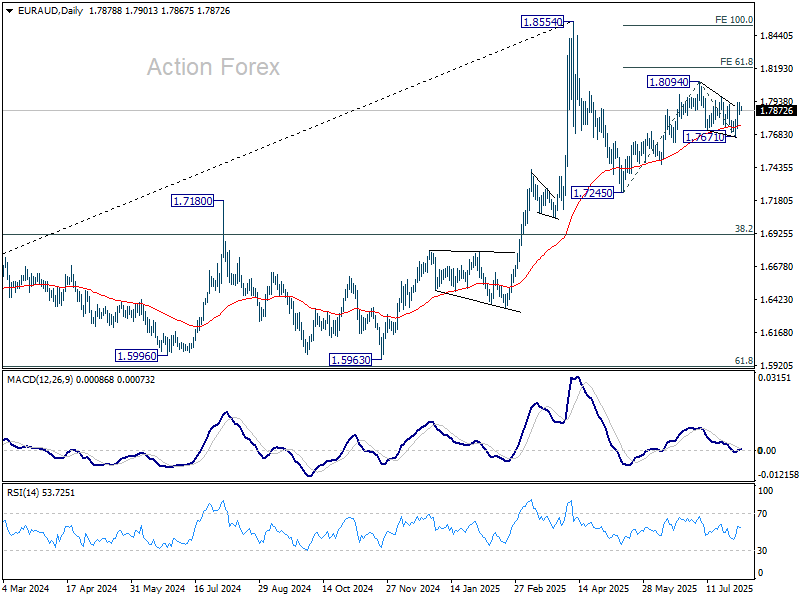
In the bigger picture, price actions from 1.8554 medium term top are seen as a corrective pattern. Such pattern could extend further with another falling leg. But even in that case, downside should be contained by 38.2% retracement of 1.4281 (2022 low) to 1.8554 at 1.6922 to bring rebound. Up trend from 1.4281 is expected to resume at a later stage.
EUR/JPY Daily Outlook
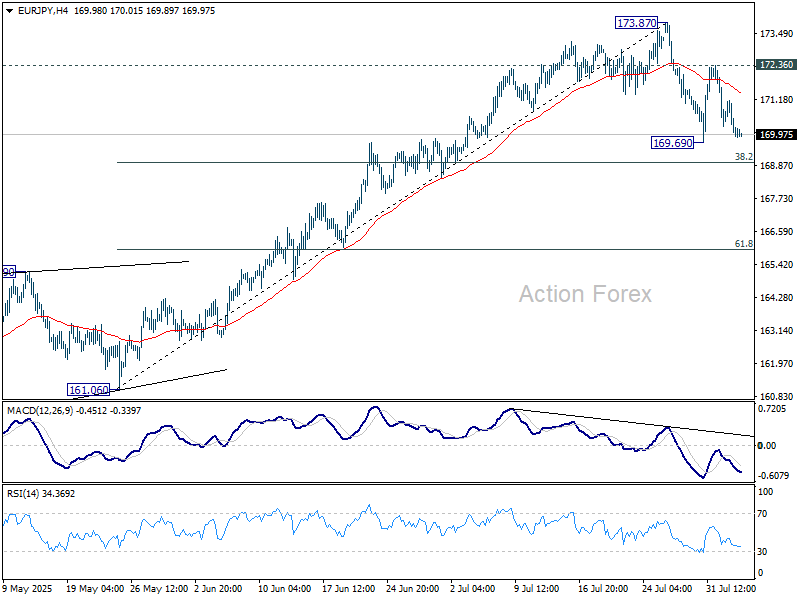
Daily Pivots: (S1) 169.70; (P) 170.44; (R1) 170.96; More...
Intraday bias in EUR/JPY remains neutral for the moment. While fall from 173.87 short term top could extend lower, downside should be contained by 38.2% retracement of 161.06 to 173.87 at 168.97 to bring rebound, at least on first attempt. On the upside, above 172.36 resistance will bring retest of 173.87 first. However, sustained break of 168.97 will raise the chance of near term bearish reversal.
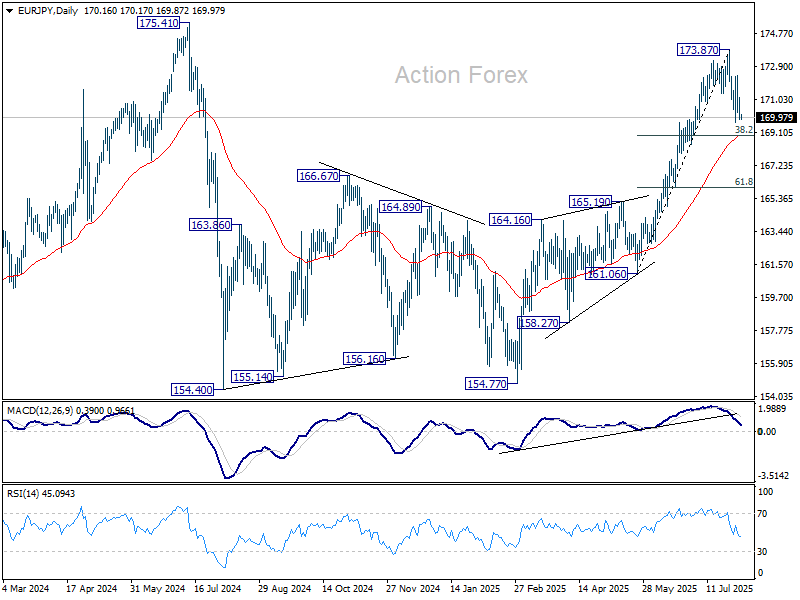
In the bigger picture, considering current strong momentum as seen in the rally from 154.77, corrective pattern from 175.41 could have already completed. Decisive break there will confirm long term up trend resumption. Next target is 61.8% projection of 124.37 to 175.41 from 154.77 at 186.31. However, rejection by 175.41, followed by firm break of 55 D EMA (now at 168.80) will delay this bullish case.
GBP/JPY Daily Outlook
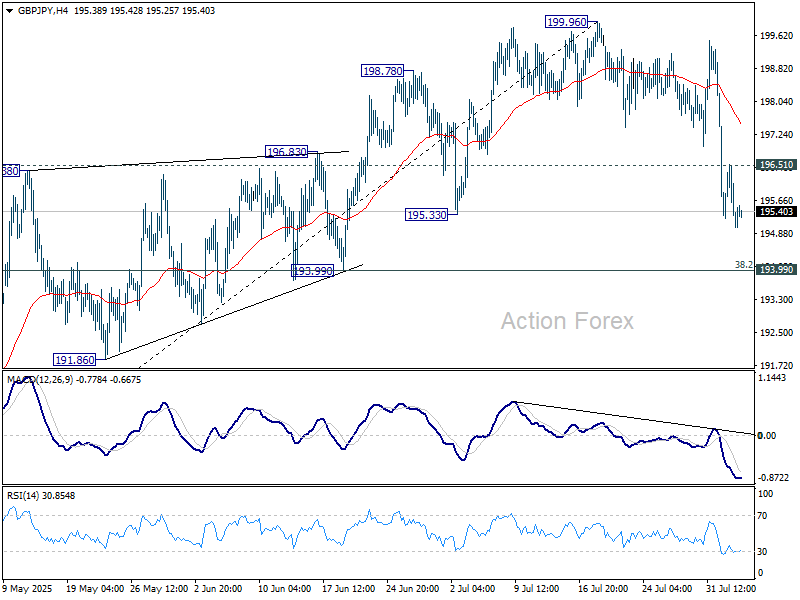
Daily Pivots: (S1) 194.79; (P) 195.67; (R1) 196.29; More...
GBP/JPY's fall from 199.96 short term top continues today and intraday bias stays on the downside. Deeper fall should be seen to 193.99 cluster support (38.2% retracement of 184.35 to 199.96 at 193.99). Strong support should be seen there to bring rebound, at least on first attempt. On the upside, above 196.51 resistance will turn intraday bias neutral again first. However, sustained break of 193.99 will raise the chance of near term bearish reversal.
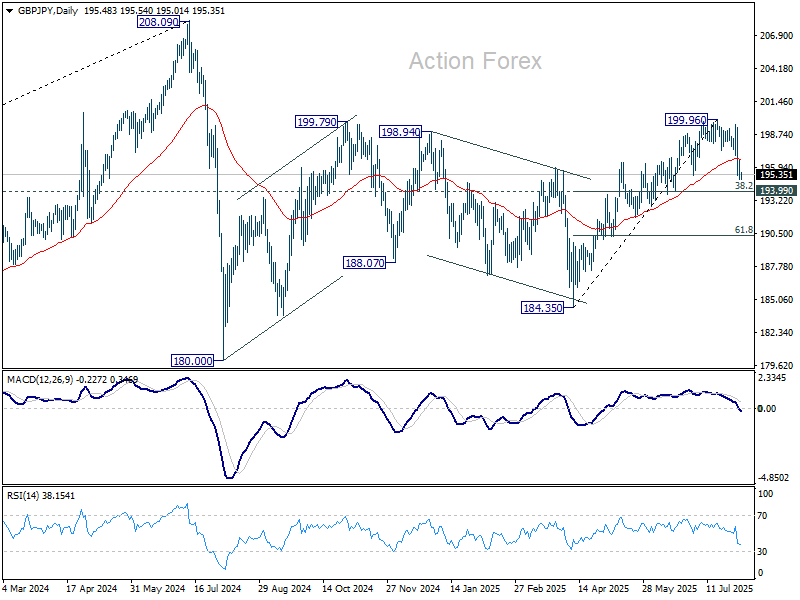
In the bigger picture, price actions from 208.09 (2024 high) are seen as a correction to rally from 123.94 (2020 low). The pattern might still extend with another falling leg. But in that case, strong support should be seen from 38.2% retracement of 123.94 to 208.09 at 175.94 to contain downside. Meanwhile, decisive break of 208.09 will confirm long term up trend resumption.
Yen Extends Gains on Soft US Yields, ISM Services to Test Fed Cut Pricing
Yen continues to outperform in the FX market this week so far, drawing strong support from the ongoing slide in US Treasury yields. The benchmark 10-year yield slipped to close at 4.2% overnight, as Fed rate cut bets gaining traction. Market consensus is solidifying around the idea that Fed will deliver at least two rate cuts this year, with some pricing in the possibility of a third. While that sounds aggressive, it still aligns broadly with the Fed’s latest dot plot, which showed a median year-end rate of 3.9% — roughly 50bps below the current target range of 4.25–4.50%. The dovish shift is not much inconsistent with official guidance. For now, much depends on the strength of upcoming US data, with ISM Services PMI due later today offering the next key signal.
Sterling is currently the second strongest major this week, benefiting from broad Euro and Swiss Franc weakness. However, GBP strength is relative, and the currency still faces a key test later this week with BoE’s policy decision. The BoE is expected to deliver another 25bps cut, but the focus will be on the vote split and inflation forecasts amid last month’s upside CPI surprise. Swiss Franc is languishing near the bottom of the performance table, alongside Euro and Kiwi. Commodity currencies and Dollar are mixed in the middle in this early part of the week
On the trade front, tensions remain despite some diplomatic progress. The EU has postponed a package of countermeasures for six months, as it is working with the US to finalize a joint statement on tariffs . However, key disagreements remain — particularly around US tariffs on EU automotive and strategic sectors, which were left untouched in Washington’s July 31 executive order.
In Asia, Japan’s lead negotiator Ryosei Akazawa is heading to Washington today to push for the implementation of the agreed tariff reduction on Japanese autos. The US had pledged to lower duties to 15% from 27.5%, but formalization via executive order is still pending.
India is also in the spotlight after US President Donald Trump threatened new tariffs in response to its Russian oil purchases. New Delhi defended its position, noting that Russian imports only began after Europe diverted traditional suppliers during the war. India accused the US and EU of hypocrisy, stating their own trade with Russia is not similarly constrained by strategic necessity — a sign that political heat may remain in focus even as markets try to look past it.
In Asia, at the time of writing, Nikkei is up 0.62%. Hong Kong HSI is up 0.27%. China Shanghai SSE is up 0.53%. Singapore Strait Times is up 0.46%. Japan 10-year JGB yield is down -0.034 at 1.477. Overnight, DOW rose 1.34%. S&P 500 rose 1.47%. NASDAQ rose 1.95%. 10-year yield fell -0.020 to 4.200.
BoJ minutes hint at hikes post-tariff deal, AUD/JPY extends decline
BoJ’s June meeting minutes, released today, confirmed that several policymakers were open to resuming rate hikes once trade uncertainty subsides. While the minutes are somewhat dated — the meeting took place before the announcement of the US–Japan trade agreement — they reveal a growing consensus that the central bank may return to a normalization path sooner than previously expected. Markets are now turning to Friday’s Summary of Opinions from the more recent July meeting, which should reflect a more upbeat outlook following the tariff deal.
Some BoJ members noted that as wages remain firm and inflation slightly exceeds expectations, the Bank would likely "shift away from the current wait-and-see approach and consider resuming rate hikes, if trade friction de-escalates" Others emphasized that while the BoJ should pause rate hikes for now due to uncertainty, it must stay “flexible and nimble,” ready to resume hikes depending on US policy and global developments.
Yen continues to strengthen this week, underpinned by falling US Treasury yields and a pickup in BoJ tightening expectations. In contrast, the Australian Dollar is under pressure as markets increasingly price in another RBA rate cut next week. The shift follows last week’s soft Q2 CPI data, which undercut arguments for extended policy pauses and revived dovish speculation.
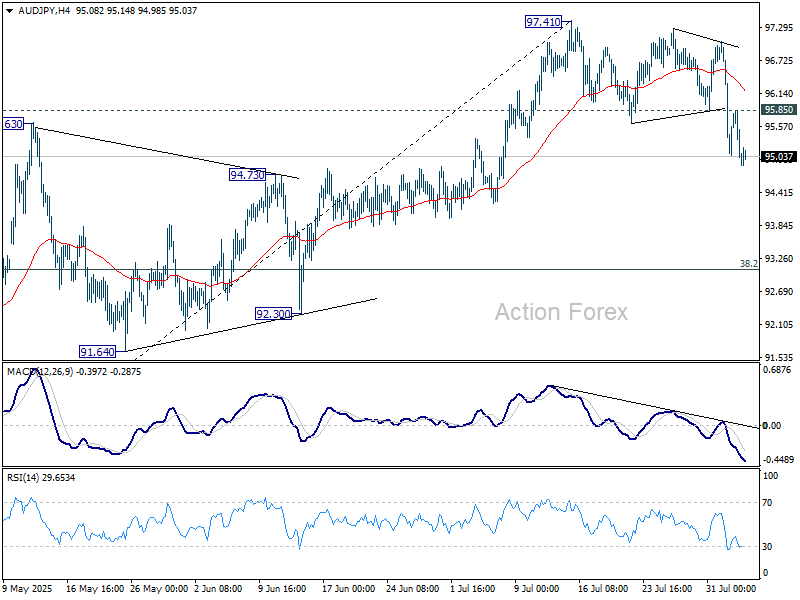
Technically, a short term top should be in place at 97.41 in AUD/JPY with breach of 55 D EMA (now at 95.08). Sustained trading below the EMA will bring AUD/JPY further lower to 38.2% retracement of 86.03 to 97.41 at 93.06, as a correction to the rise from 86.03. Nevertheless, break of 95.85 minor resistance will dampen this bearish view and turn intraday bias neutral first.
China’s Caixin Services PMI surges to 52.6, on stronger demand and renewed optimism
China’s Caixin Services PMI jumped sharply from 50.6 to 52.6 in July, well ahead of expectations at 50.4, marking the fastest pace of expansion since May 2024. PMI Composite, owever, fell from 51.3 to 50.8 as dragged down by weak manufacturing.
According to S&P Global’s Jingyi Pan, the rise was driven by better domestic demand and a notable improvement in external demand, with new export business expanding for the first time in three months. Business sentiment also improved, reaching the highest level since March.
Firms also began hiring again, albeit mostly part-time. Importantly, companies felt confident enough to raise output charges for the first time in six months — a sign that inflation pressures are being more easily passed on to clients.
GBP/JPY Daily Outlook
Daily Pivots: (S1) 194.79; (P) 195.67; (R1) 196.29; More...
GBP/JPY's fall from 199.96 short term top continues today and intraday bias stays on the downside. Deeper fall should be seen to 193.99 cluster support (38.2% retracement of 184.35 to 199.96 at 193.99). Strong support should be seen there to bring rebound, at least on first attempt. On the upside, above 196.51 resistance will turn intraday bias neutral again first. However, sustained break of 193.99 will raise the chance of near term bearish reversal.
In the bigger picture, price actions from 208.09 (2024 high) are seen as a correction to rally from 123.94 (2020 low). The pattern might still extend with another falling leg. But in that case, strong support should be seen from 38.2% retracement of 123.94 to 208.09 at 175.94 to contain downside. Meanwhile, decisive break of 208.09 will confirm long term up trend resumption.
BoJ minutes hint at hikes post-tariff deal, AUD/JPY extends decline
BoJ’s June meeting minutes, released today, confirmed that several policymakers were open to resuming rate hikes once trade uncertainty subsides. While the minutes are somewhat dated — the meeting took place before the announcement of the US–Japan trade agreement — they reveal a growing consensus that the central bank may return to a normalization path sooner than previously expected. Markets are now turning to Friday’s Summary of Opinions from the more recent July meeting, which should reflect a more upbeat outlook following the tariff deal.
Some BoJ members noted that as wages remain firm and inflation slightly exceeds expectations, the Bank would likely "shift away from the current wait-and-see approach and consider resuming rate hikes, if trade friction de-escalates" Others emphasized that while the BoJ should pause rate hikes for now due to uncertainty, it must stay “flexible and nimble,” ready to resume hikes depending on US policy and global developments.
Yen continues to strengthen this week, underpinned by falling US Treasury yields and a pickup in BoJ tightening expectations. In contrast, the Australian Dollar is under pressure as markets increasingly price in another RBA rate cut next week. The shift follows last week’s soft Q2 CPI data, which undercut arguments for extended policy pauses and revived dovish speculation.
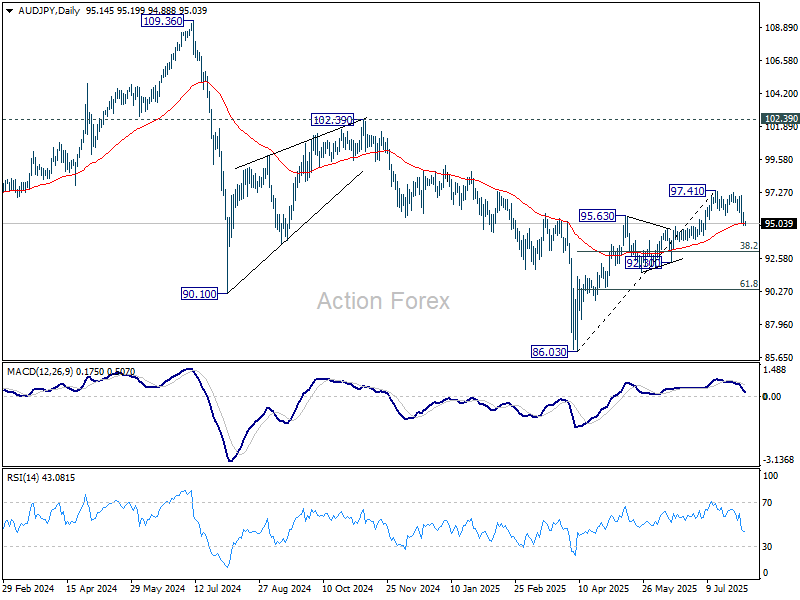
Technically, a short term top should be in place at 97.41 in AUD/JPY with breach of 55 D EMA (now at 95.08). Sustained trading below the EMA will bring AUD/JPY further lower to 38.2% retracement of 86.03 to 97.41 at 93.06, as a correction to the rise from 86.03. Nevertheless, break of 95.85 minor resistance will dampen this bearish view and turn intraday bias neutral first.