

Sample Category Title
Bank of England Preview – On Track With Easing
- We expect the Bank of England (BoE) to cut the Bank Rate by 25bp to 4.00% on Thursday 7 August in line with consensus and market pricing.
- Data has been a mixed bag since the last meeting with the labour market showing more pronounced signs of cooling, weaker than expected growth but inflation surprising to the topside. We think this supports the notion of further quarterly cuts.
- We expect a muted reaction in EUR/GBP. We stay negative on GBP.
We expect the Bank of England to cut the Bank Rate to 4.00% on Thursday 7 August in line with consensus and market pricing. We expect the vote split to be 6-3 with the majority voting for a 25bp cut and Greene, Mann, Pill voting for an unchanged decision. Note, this meeting includes updated projections and a press conference following the release of the statement.
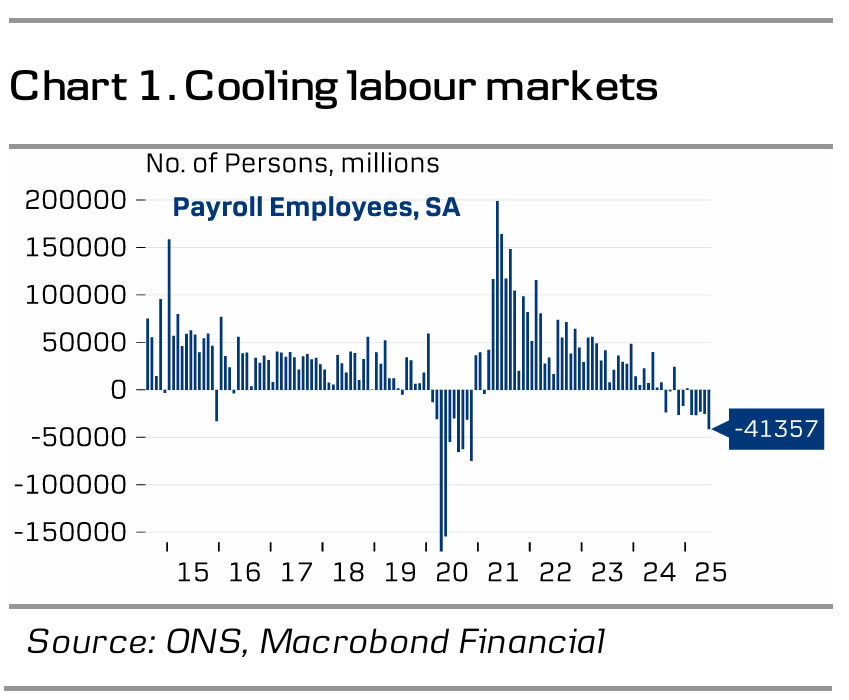
Overall, we expect the BoE to stick to its previous guidance repeating that a "gradual and careful approach to removing monetary policy restraint remains appropriate". Since the last meeting in June, data has been a mixed bag. Growth has surprised to the downside with the economy contracting by 0.3% m/m in April and 0.1% m/m in May, on course to undershoot the BoE projections for Q2 2025 of 0.25%. The labour market has shown more pronounced signs of cooling with private sector regular wage growth at 4.9% 3M/YoY in May, lower than the BoE's projections of 5.2% but remains at elevated levels. Similarly, payrolls have dropped the past months, and the unemployment rate has edged higher to 4.7%. On the other hand, inflation has been stronger than expected and inflation expectations have risen. Headline inflation rose to 3.6% y/y in June with food prices delivering the relative biggest overshoot compared to the MPC's forecast. On the back of this, we think the MPC is likely to lift the near-term projection for inflation slightly.
BoE call. We expect the BoE to stick to quarterly cuts, leaving the Bank Rate at 3.75% by YE 2025, which is aligned with market pricing. However, we expect the cutting cycle to extend throughout 2026 leaving the Bank Rate at 2.75%. This is more dovish than markets, which prices a bottom of 3.50% a year from now.
Market reaction. We expect a muted market reaction as we expect the BoE to refrain from altering its current guidance. More broadly, we stay negative on GBP. An investment environment characterised by elevated uncertainty and a positive correlation to a USD negative environment, in our view, favours a weaker GBP. Tentative signs of a weaker growth outlook for the UK economy also acts as a headwind for GBP. We therefore expect EUR/GBP to move higher towards 0.89 on a 6-12-month horizon.
EUR/USD Mid-Day Outlook
Daily Pivots: (S1) 1.1454; (P) 1.1526; (R1) 1.1659; More...
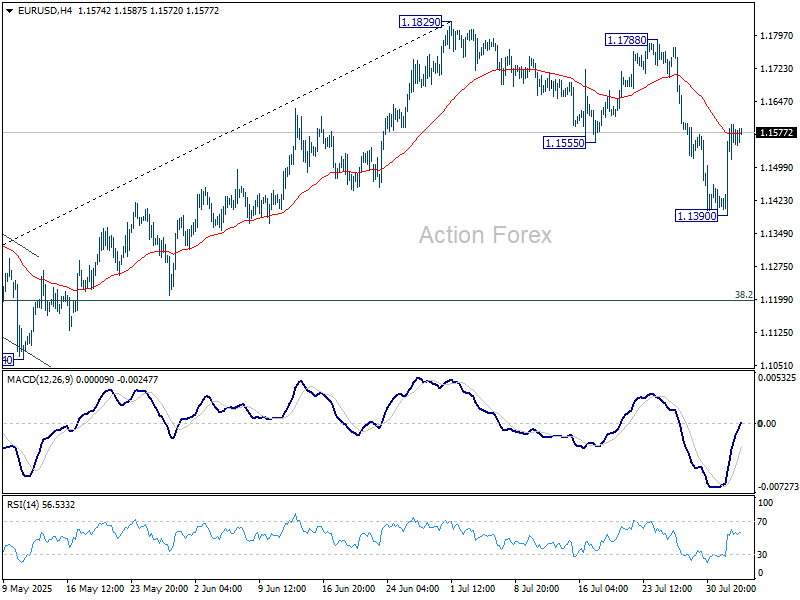
Intraday bias in EUR/USD stays on the upside at this point. As noted before, correction from 1.1829 could have completed with three waves down to 1.1390 already. Further rise should be seen to retest 1.1788/1820 resistance zone. On the downside, break of 1.1390 will resume the correction to 38.2% retracement of 1.0176 to 1.1829 at 1.1198 instead.
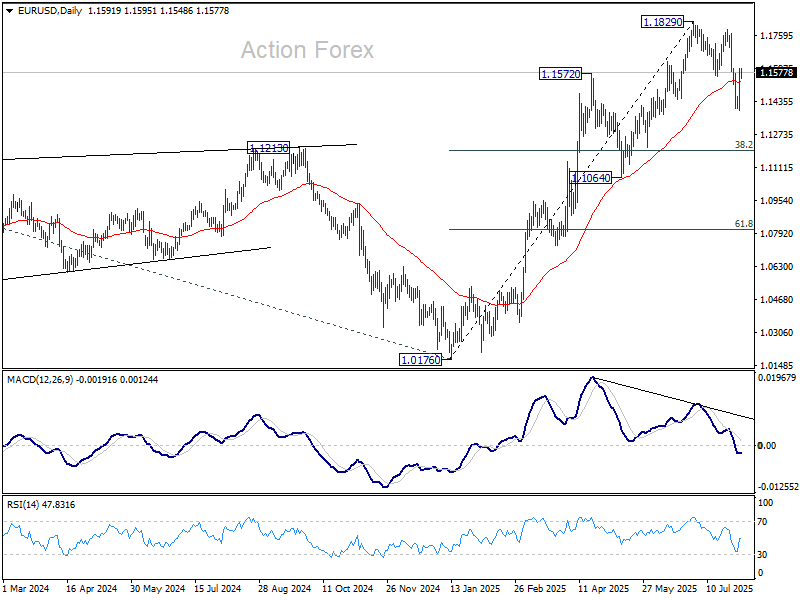
In the bigger picture, rise from 0.9534 long term bottom could be correcting the multi-decade downtrend or the start of a long term up trend. In either case, further rise should be seen to 100% projection of 0.9534 to 1.1274 from 1.0176 at 1.1916. This will remain the favored case as long as 1.1604 support holds.
GBP/USD Mid-Day Outlook
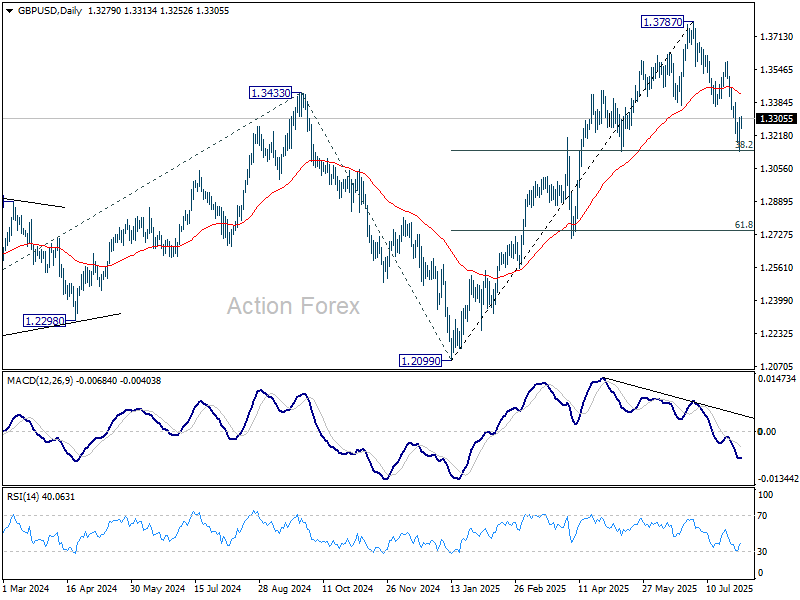
Daily Pivots: (S1) 1.3177; (P) 1.3244; (R1) 1.3345; More...
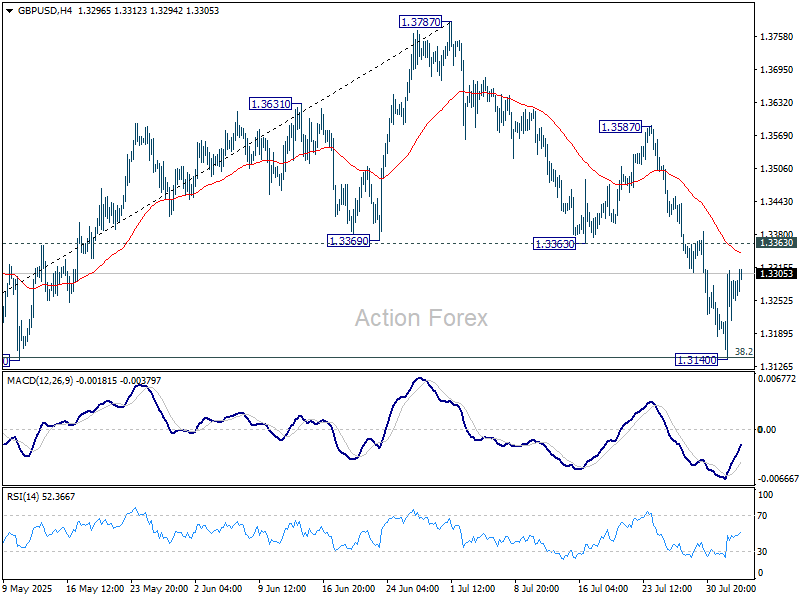
No change in GBP/USD's outlook and intraday bias stays neutral. On the upside, sustained break of 1.3363 support turned resistance will indicate that the fall has completed as a three-wave correction. Further rally should then be seen back to 1.3587 resistance next. Nevertheless, sustained trading below 38.2% retracement of 1.2099 to 1.3787 at 1.3142 will target 61.8% retracement at 1.2744.
In the bigger picture, up trend from 1.3051 (2022 low) is in progress. Next medium term target is 61.8% projection of 1.0351 to 1.3433 from 1.2099 at 1.4004. Outlook will now stay bullish as long as 55 W EMA (now at 1.3049) holds, even in case of deep pullback.
USD/CHF Mid-Day Outlook
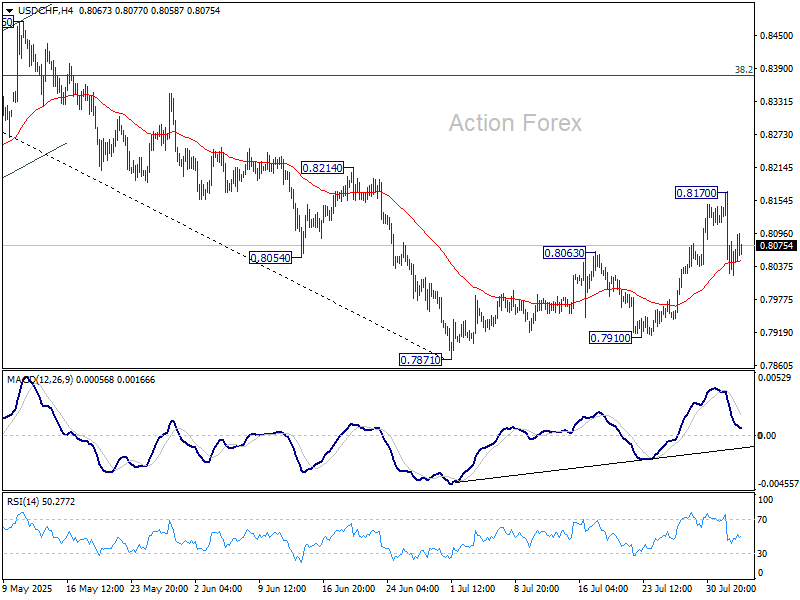
Daily Pivots: (S1) 0.7988; (P) 0.8080; (R1) 0.8132; More….
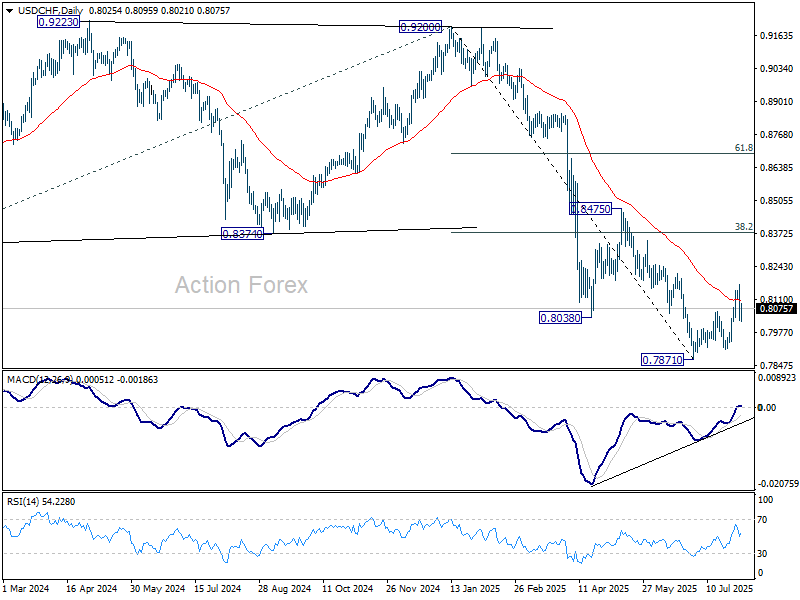
Intraday bias in USD/CHF stays mildly on the downside at this point and deeper decline would be seen to retest 07871/7910 support zone. Firm break there will resume larger down trend. On the upside, though, break of 0.8170 will resume the corrective bounce from 0.7871 to 38.2% retracement of 0.9200 to 0.7871 at 0.8379 instead.
In the bigger picture, long term down trend from 1.0342 (2017 high) is still in progress. Next target is 100% projection of 1.0146 (2022 high) to 0.8332 from 0.9200 at 0.7382. In any case, outlook will stay bearish as long as 0.8475 resistance holds.
USD/JPY Mid-Day Outlook
Daily Pivots: (S1) 146.17; (P) 148.54; (R1) 149.80; More...
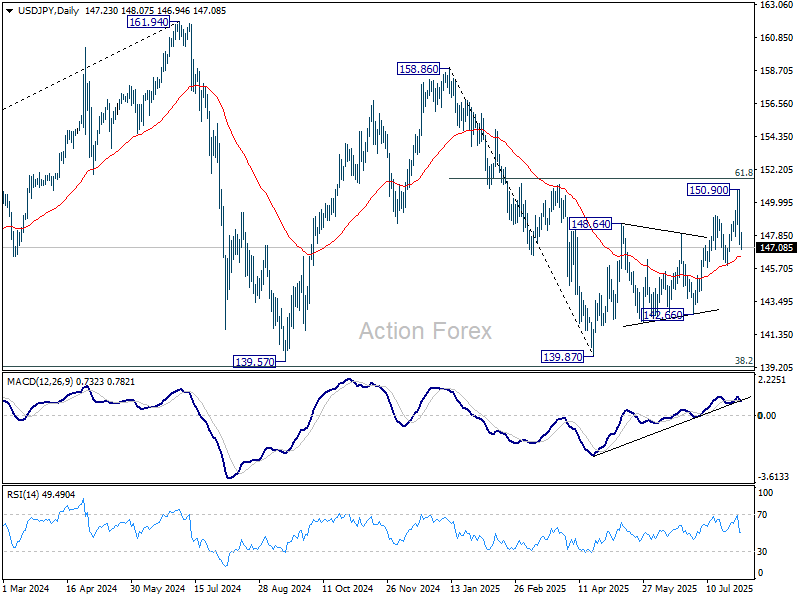
USD/JPY dips mildly today but stays well above 145.84 support. Intraday bias stays neutral first. Rebound from 139.87 could still extend higher. Above 150.90 will target 151.22 fibonacci level. However, on the downside, firm break of 145.84 support will argue that whole rise from 139.87 might have already completed. Deeper fall should then be seen to 142.66 support for confirmation.
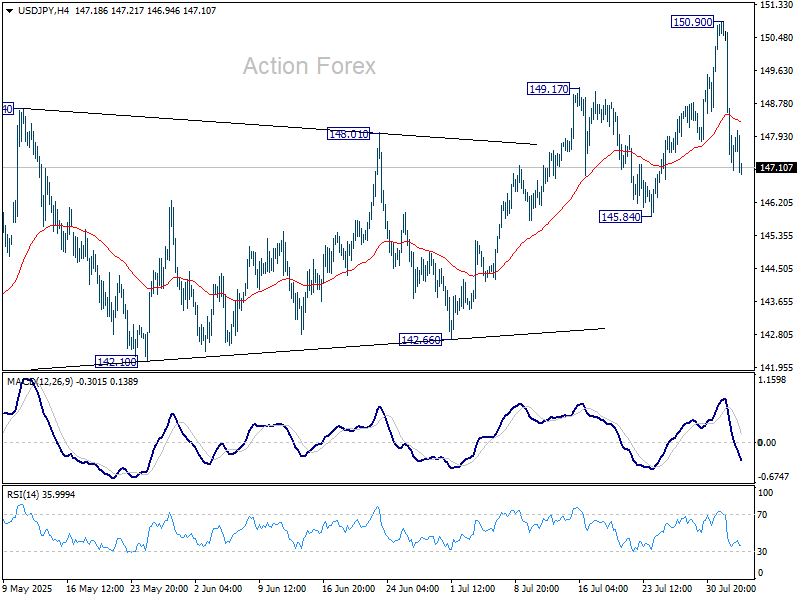
In the bigger picture, price actions from 161.94 (2024 high) are seen as a corrective pattern to rise from 102.58 (2021 low). Decisive break of 61.8% retracement of 158.86 to 139.87 at 151.22 will argue that it has already completed with three waves at 139.87. Larger up trend might then be ready to resume through 161.94 high. In case the corrective pattern extends with another fall, strong support is expected from 38.2% retracement of 102.58 to 161.94 at 139.26 to bring rebound.
Yen Gains, Franc Sinks, Risk Appetite Recovers Cautiously
Markets are recovering modestly at the start of the week after last week’s sharp risk-off move. European equities are inching higher, and US futures point to a positive open. While sentiment appears to be improving, the backdrop remains fragile, as reflected in the continued slide in global bond yields, a signal that some investors are still seeking safety.
Yen is among the better performers today, drawing strength from falling yields and lingering caution. Sterling is also relatively firm, supported by weakness in both Euro and Franc. Sterling may face its own test later this week when the Bank of England meets, but for now it is benefiting from cross-asset flows.
Meanwhile, Swiss Franc sits at the bottom of the FX board despite Swiss CPI slightly beating expectations, offering no support to the currency. Euro is not faring much better. Sentix Investor Confidence data painted a grim picture of investor sentiment toward the EU-US trade deal. Dollar remains soft, with attempts to rebound proving shallow so far. Commodity currencies are mixed in the middle.
On the trade front, Japan’s Prime Minister Shigeru Ishiba told the parliament today he is ready have to direct talks with US President Donald Trump to accelerate the implementation of the US auto tariff reduction. Although the deal was struck last month, cutting tariffs on Japanese goods including cars, the timeline remains vague. Trade Minister Akazawa also said in the same session that even under favorable conditions, implementation could take more than a month, as seen in the UK's case.
In Europe, at the time of writing, FTSE is up 0.46%. DAX is up 1.44%. CAC is up 0.99%. UK 10-year yield is down -0.21 at 4.509. Germany 10-year yield is down -0.031 at 2.649. Earlier in Asia, Nikkei fell -1.25%. Hong Kong HSI rose 0.92%. China Shanghai SSE rose 0.66%. Singapore Strait Times rose 1.04%. Japan 10-year JGB yield fell -0.041 to 1.511.
Eurozone Sentix sentiment crashes to -3.7, investors reject US-EU trade deal
Investor confidence in the Eurozone took a sharp hit in August, with Sentix Investor Confidence Index plunging from 4.5 to -3.7, well below expectations of 6.2. Current Situation Index dropped further into negative territory, falling from -7.3 to -13.0. Expectations Index fell steeply from 17.0 to 6.0. Germany’s figures were even more troubling: the overall index dropped from -0.4 to -12.8, with the Current Situation down from -18.8 to -29.0 and Expectations collapsing from 19.8 to 5.0.
According to Sentix, the sentiment collapse reflects investors’ early judgment of the EU-US tariff deal — and the assessment is "devastating." The agreement, instead of offering clarity or relief, has triggered renewed concerns about Eurozone export sectors. Recent optimism about Germany’s recovery is now in doubt, with export-oriented industries seen facing more pressure in the months ahead. Investors are also increasingly anxious about rising government debt across the bloc.
Adding to the gloom, inflation shows no signs of easing. Sentix’s inflation theme index fell to -11.75, reinforcing the view that the ECB has limited room to ease policy further. With sentiment deteriorating, debt concerns mounting, and no clear inflation relief in sight, the Eurozone’s path to recovery looks increasingly fragile.
Swiss CPI beats forecast, easing pressure on SNB to go negative
Swiss CPI came in firmer than expected in July, with headline inflation unchanged mom versus forecasts of a -0.2% mom decline. Core CPI — which excludes fresh and seasonal products, energy, and fuel — fell slightly by -0.1% mom, while domestic product prices rose 0.2% mom and imported product prices dropped -0.9% mom.
On an annual basis, headline CPI ticked up to 0.2% yoy from 0.1% yoy, also ahead of the 0.1% yoy forecast. Core CPI accelerated from 0.6% yoy to 0.8% y/y yoy. Domestic product inflation remained steady at 0.7% yoy, while imported product prices, although still negative, improved from -1.9% yoy to -1.4% yoy.
Today’s data modestly ease concerns that Switzerland is slipping back into outright deflation. There has been persistent speculation that the SNB might resume negative interest rates following a series of cuts that brought the policy rate back to 0.00%. But July’s inflation uptick may buy policymakers time ahead of the next meeting on September 25.
In the background, the slight weakening in Swiss Franc, as global markets stabilize and trade tensions ease, helps reduce deflationary pressure. If August CPI data show further improvement, expectations will likely shift toward a steady hold in September rather than another policy adjustment.
GBP/CAD faces dual event risk of BoE and Canadian job
GBP/CAD could see heightened volatility this week as two key events take center stage: BoE rate decision on Thursday and Canadian employment data on Friday.
A 25bps BoE cut is widely expected as part of its measured easing cycle, but the decision may not be smooth. In May, the MPC vote split a rare three ways, with two members backing a larger cut and two pushing for no change. In June, Deputy Governor Dave Ramsden joined the dovish camp. But with inflation unexpectedly accelerating, some policymakers may reverse course. That raises the odds of a more contentious outcome, potentially sparking a reaction in GBP crosses.
Canadian Dollar, meanwhile, will look the July jobs report for direction. BoC has left rates unchanged for three straight meetings and hinted it may cut only if weakness persists. June’s robust job data — 83.1k positions added and a dip in unemployment to 6.9% — gives the BoC space to stay on hold for longer. A solid print this week would reinforce that view.
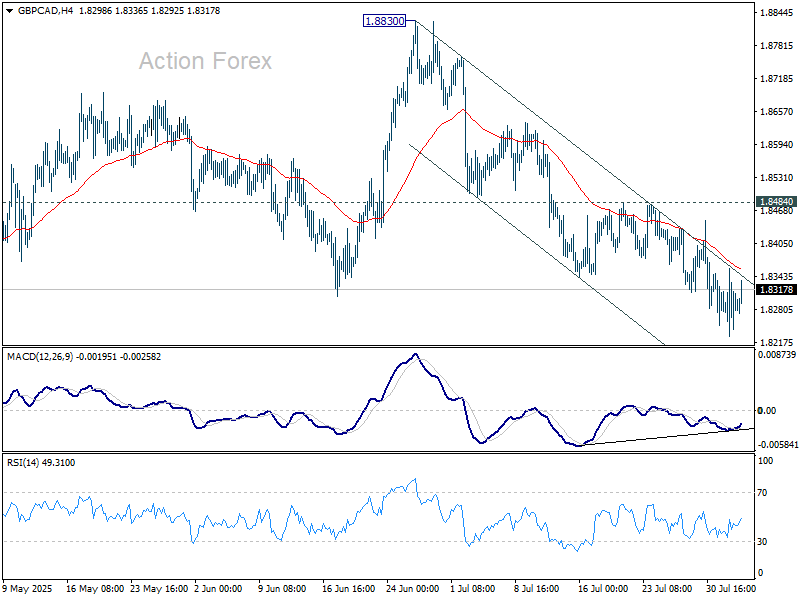
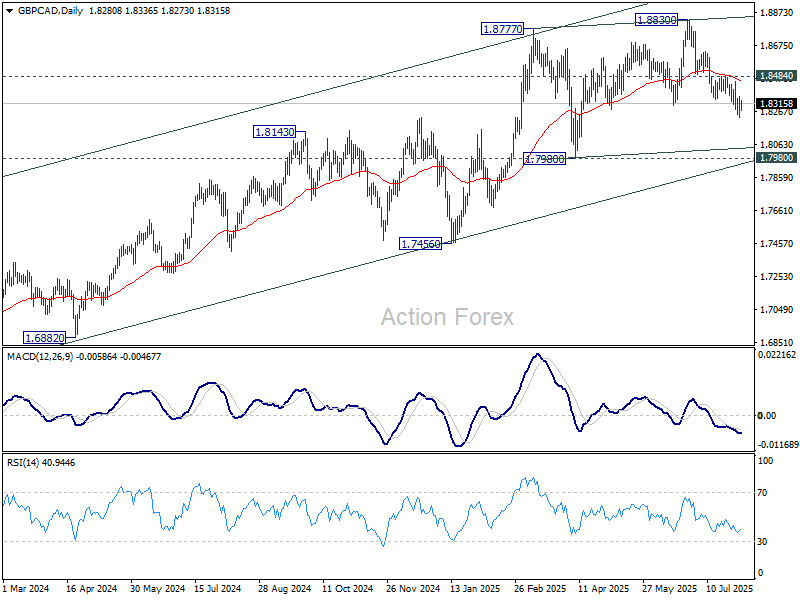
Technically, GBP/CAD remains under pressure as decline from 1.8830 continues. Momentum has slowed, as seen in 4H MACD, but there’s no clear sign of a bottom yet. The decline is seen as the third leg of the corrective pattern from 1.8777, and further dip toward 1.7980 cannot be ruled out. On the other hand, firm break above 1.8484 would suggest the fall is over and open a move back toward 1.8830.
USD/JPY Mid-Day Outlook
Daily Pivots: (S1) 146.17; (P) 148.54; (R1) 149.80; More...
USD/JPY dips mildly today but stays well above 145.84 support. Intraday bias stays neutral first. Rebound from 139.87 could still extend higher. Above 150.90 will target 151.22 fibonacci level. However, on the downside, firm break of 145.84 support will argue that whole rise from 139.87 might have already completed. Deeper fall should then be seen to 142.66 support for confirmation.
In the bigger picture, price actions from 161.94 (2024 high) are seen as a corrective pattern to rise from 102.58 (2021 low). Decisive break of 61.8% retracement of 158.86 to 139.87 at 151.22 will argue that it has already completed with three waves at 139.87. Larger up trend might then be ready to resume through 161.94 high. In case the corrective pattern extends with another fall, strong support is expected from 38.2% retracement of 102.58 to 161.94 at 139.26 to bring rebound.
USD INDEX – Bears Take a Breather After Fridays Sharp Fall
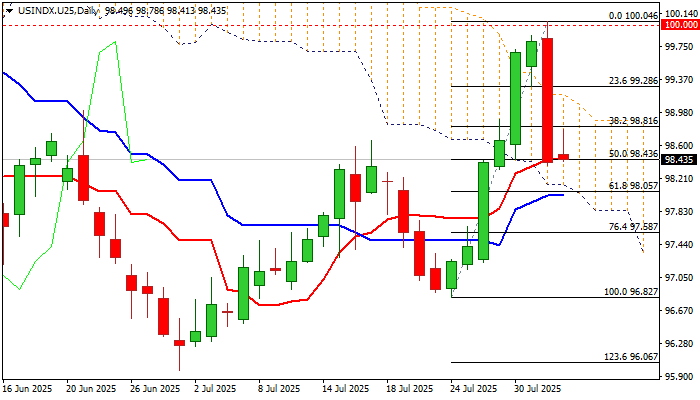
The dollar index edged higher on Monday morning after losing almost 1.5% on Friday (the biggest daily loss since Apr 10).
Disappointing US NFP data in July and strong downward revision of previous month’s figure, as well as higher unemployment, send warning signals to the Fed and revive the scenario about rate cut in September (and probably one more until the end of the year) which US policymakers just sidelined on Wednesday’s policy meeting.
Friday’s sharp fall (emerged after failure at 100 psychological barrier) closed within falling and thickening daily Ichimoku cloud and hit 50% retracement of recent strong rally (96.82/100.04) that generated negative signal.
Fresh bears found temporary footstep at 50% retracement / daily Tenkan-sen, with today’s (so far limited) bounce, partially offsetting immediate downside risk.
Near-term action may keep in directionless mode while holding within the cloud (spanned between 98.00 and 99.00) with violation of either cloud boundary, to generate stronger direction signal.
On the longer run, dollar’s outlook is likely to remain negative, as larger downtrend is still intact after last week’s strong upside rejection (weekly candle with long upper shadow) and predominantly bearish weekly studies.
Apart from growing signals of more dovish Fed’s stance in coming months, doubts about the strength of the US economy (after strong disappointment from NFP) and rising political uncertainty would further boost demand for gold and increase pressure on dollar.
Res: 98.81; 99.08; 99.28; 99.72
Sup: 98.36; 98.03; 97.58; 97.22
GBP/CAD faces dual event risk of BoE and Canadian job
GBP/CAD could see heightened volatility this week as two key events take center stage: BoE rate decision on Thursday and Canadian employment data on Friday.
A 25bps BoE cut is widely expected as part of its measured easing cycle, but the decision may not be smooth. In May, the MPC vote split a rare three ways, with two members backing a larger cut and two pushing for no change. In June, Deputy Governor Dave Ramsden joined the dovish camp. But with inflation unexpectedly accelerating, some policymakers may reverse course. That raises the odds of a more contentious outcome, potentially sparking a reaction in GBP crosses.
Canadian Dollar, meanwhile, will look the July jobs report for direction. BoC has left rates unchanged for three straight meetings and hinted it may cut only if weakness persists. June’s robust job data — 83.1k positions added and a dip in unemployment to 6.9% — gives the BoC space to stay on hold for longer. A solid print this week would reinforce that view.
Technically, GBP/CAD remains under pressure as decline from 1.8830 continues. Momentum has slowed, as seen in 4H MACD, but there’s no clear sign of a bottom yet. The decline is seen as the third leg of the corrective pattern from 1.8777, and further dip toward 1.7980 cannot be ruled out. On the other hand, firm break above 1.8484 would suggest the fall is over and open a move back toward 1.8830.
Bitcoin Tests Support at 50-Day MA
Market Overview
The crypto market rolled back at the end of last week following a reduction in risk appetite in the financial markets. However, on Sunday, sentiment changed with the return of active buyers near the total capitalisation of $3.60 trillion. At the time of writing, the market is at $3.73 trillion (+3.6%). Less than 10% of the top 100 coins show gains over 7 days, among which the largest are TRON (+2.2%) and TON (+4.5%).
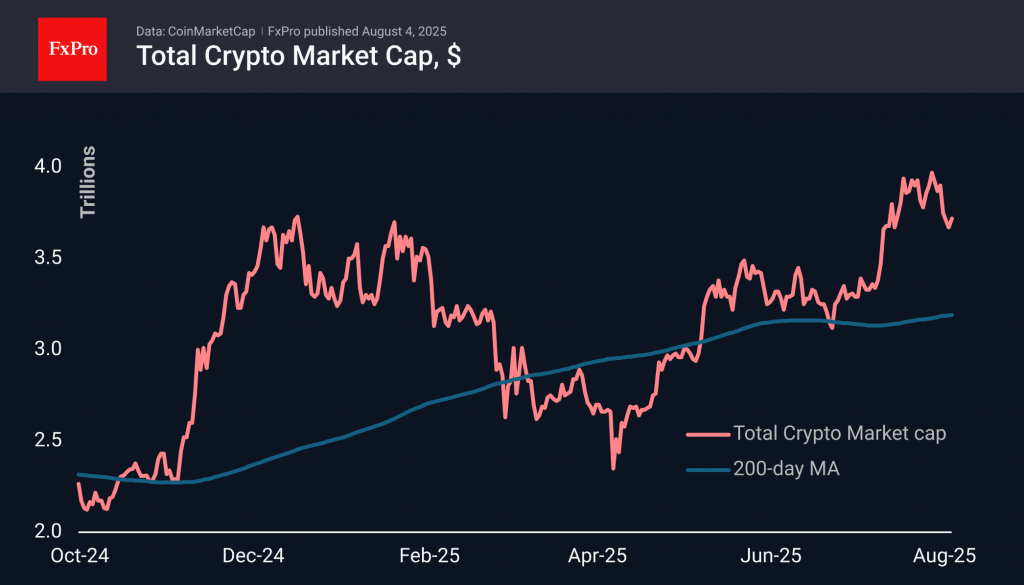
The crypto market sentiment index fell to 53 by Sunday morning, a six-week low, but recovered to 64 on Monday, reflecting a resurgence of bullish sentiment. However, another impressive upward move will be needed to confirm a local victory for the bulls.
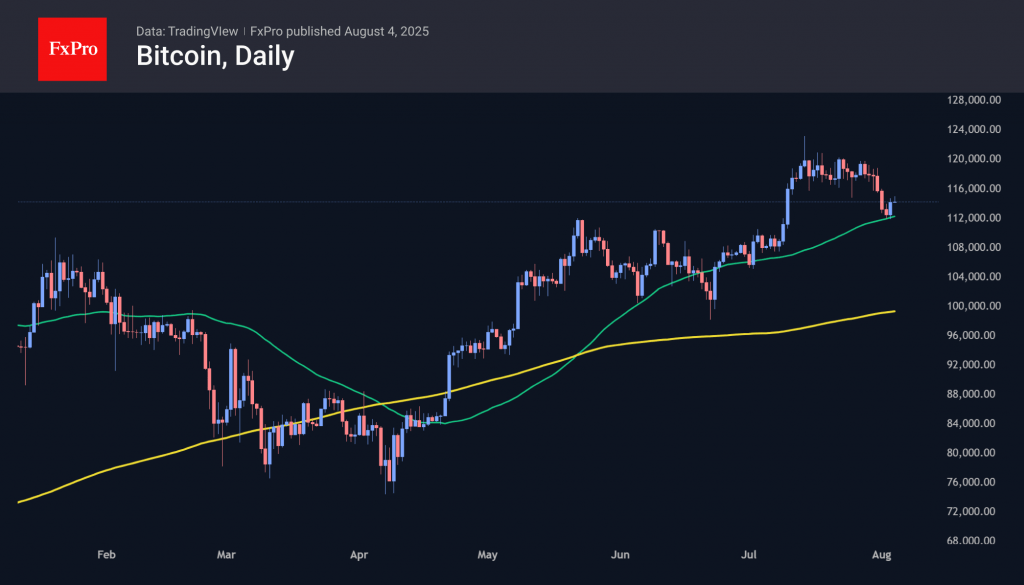
On Saturday and Sunday, Bitcoin received support from buyers on declines below $112K near the 50-day moving average – the fourth touch of this curve since April. On the “buy the dip” sentiment, the first cryptocurrency recovered to $115K on Monday morning. The rebound from support is a bullish signal for the next couple of days, but the fact that it has been tested frequently raises concerns for the medium term.
News Background
According to SoSoValue, net outflows from spot Bitcoin ETFs in the US amounted to $812.3 million on August 1, the highest since February 25. As a result, the weekly outflow from BTC ETFs amounted to $643 million, a record high for the past 16 weeks.
The net outflow from spot Ethereum ETFs in the US on Friday amounted to $152.3 million. However, inflows in the previous days of the week managed to keep the indicator in positive territory (+$154.3 million). The positive trend has continued for 12 consecutive weeks.
Analyst Ali Martinez says that over the past two days, Bitcoin whales have bought 30,000 BTC. According to Santiment, over the past four months, whales with balances ranging from 10 to 10,000 BTC have accumulated 0.9% of the total coin supply.
According to The Block, trading volume on centralised crypto exchanges exceeded $1.7 trillion in July (the highest since February 2025), and trading volume on decentralised exchanges (DEX) also reached its highest level since January.
Galaxy Digital warned of risks in the public company sector, which accumulates cryptocurrencies by issuing shares. The model creates systemic vulnerability and could lead to a cascade collapse.
US SEC Chairman Paul Atkins announced Project Crypto. The project’s key objective is to establish clear rules for cryptocurrencies and turn the US into the “world’s crypto capital.”
Dow Jones Technical: Minor Pull-Back Found Support With Bullish Elements Sighted in Caterpillar
Since the medium-term swing low on 7 April 2025, triggered by the US Liberation Day tariff announcement, the Dow Jones Industrial Average has underperformed compared to the S&P 500 and Nasdaq 100.
So far, the US Wall Street 30 CFD Index (a proxy of the Dow Jones Industrial Average futures) has not yet broken above its current all-time high of 45,100 printed in December 2024 after a retest of it last Monday, 28 July, versus fresh all-time highs seen on the S&P 500 and Nasdaq 100.
Caterpillar’s ex-post earnings price actions may drive Dow Jones
Let’s examine the Dow Jones Industrial Average from a technical analysis perspective within a short-term time horizon (1 to 3 days), coupled with an inter-market analysis of Caterpillar (CAT), the third biggest weightage component stock of the DJIA (6%) as its Q2 earnings release will be out on Tuesday, 5 August before the US market opens.
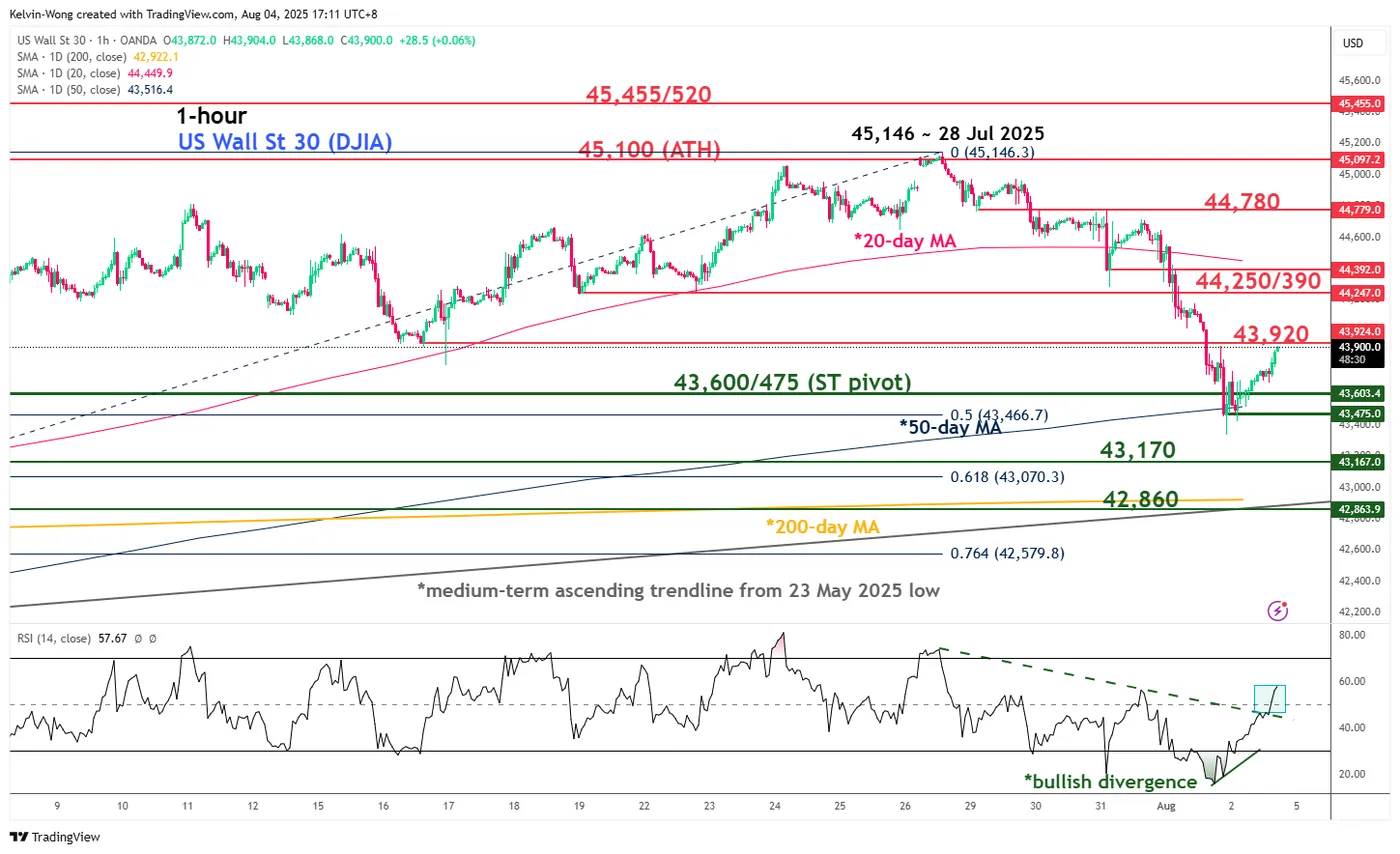
Fig. 1: US Wall Street 30 CFD Index minor trend as of 4 Aug 2025 (Source: TradingView)
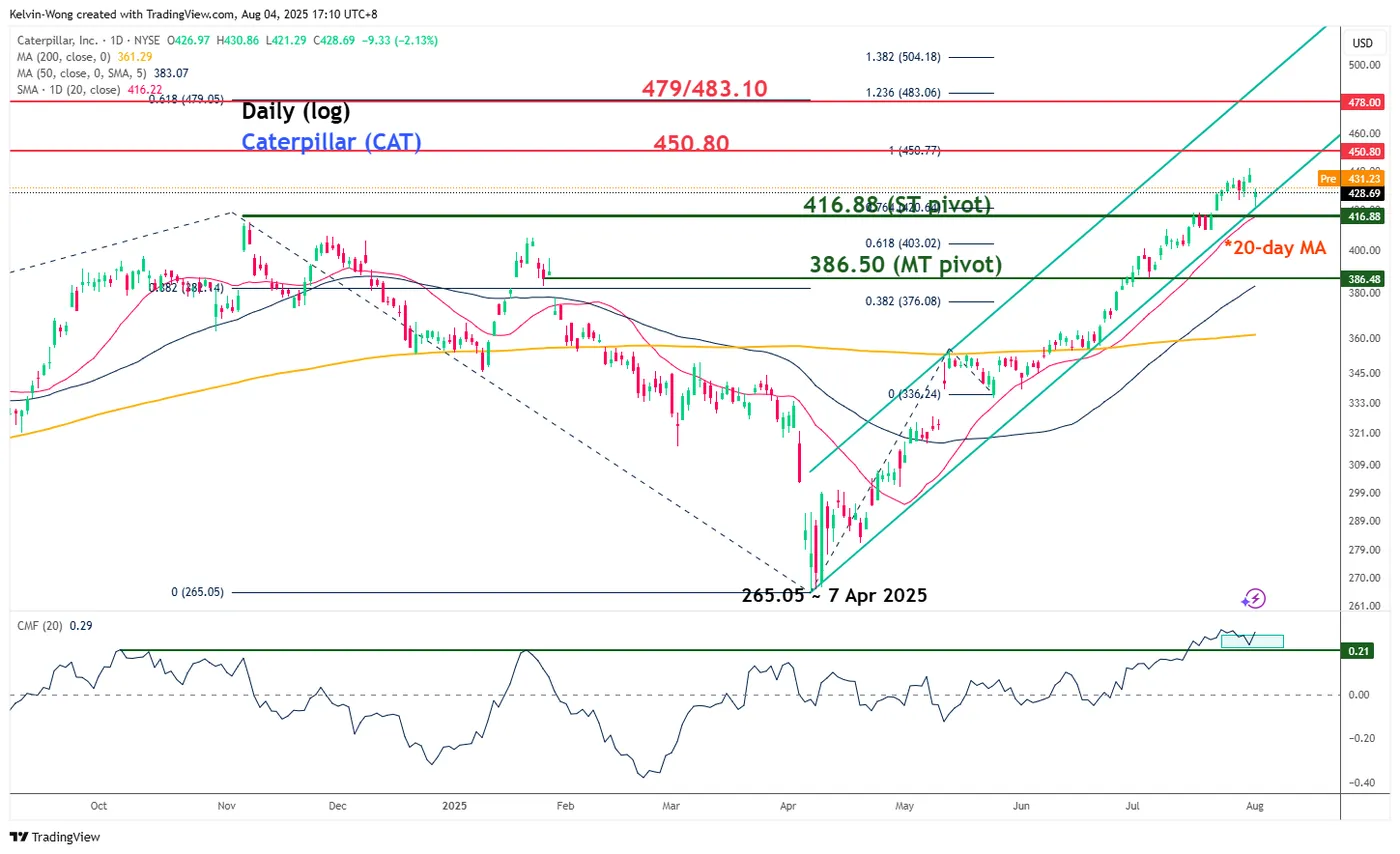
Fig. 2: Caterpillar medium-term trend as of 4 Aug 2025 (Source: TradingView)
Preferred trend bias (1-3 days)
The five-day minor corrective decline of the US Wall Street 30 CFD Index since the 28 July high of 45,146 is likely to have reached an exhaustion zone after last Friday, 1 August’s intraday sell-off triggered by the weaker-than-expected US non-farm payroll print for July.
Bullish bias above 43,600/43,475 key short-term pivotal support and a clearance above 43,920 may reinforce a potential minor recovery towards the next intermediate resistances at 44,250/44,390 and 44,780 (see Fig. 1).
Key elements
- The -4% minor corrective decline of the US Wall Street 30 CFD Index has stalled right at the 50-day moving average and the 50% Fibonacci retracement of prior bullish impulsive up move from 17 June 2025 low to 28 July 2025 high. Its confluence zone is defined as 43,600/43,475.
- The hourly RSI momentum indicator has flashed out a bullish divergence condition at its oversold region on last Friday, 1 August, before a bullish breakout above a parallel descending trendline resistance seen in today’s Asia session. These observations suggest last Friday’s downside momentum has eased.
- Caterpillar has also managed to hold right at its 20-day moving average support of 416.88, which confluences with the medium-term ascending channel support from the 7 April 2025 low. In addition, the daily Chaikin Money Flow Index (price momentum with volume) has managed to exhibit bullish momentum conditions above 0.21( a parallel support) (see Fig. 2).
Alternative trend bias (1 to 3 days)
Failure to hold at 43,475 invalidates the bullish scenario for an extension of the minor corrective decline towards the next supports at 43,170 and 42,860 (the key 200-day moving average and the medium-term ascending trendline from 23 May 2025 low).