Sample Category Title
Yen Weakens Amid Fed Rate Expectations and Bank of Japan Signals
The USD/JPY pair climbed to 147.67 on Monday as the Japanese yen underwent a correction following Friday’s volatile trading session, with investors closely monitoring macroeconomic developments.
Market focus remains on shifting US Federal Reserve policy expectations after the release of softer labour market data. Although Friday’s report bolstered predictions of a rate cut, Fed officials have maintained a cautious tone, citing persistent inflation risks. Proposed large-scale tariffs from US President Donald Trump have further amplified these concerns.
Against this backdrop, the US dollar has partially regained strength, exerting downward pressure on the yen.
Investors are now awaiting the release of the Bank of Japan (BoJ) meeting minutes, hoping for clues on the timing of a potential rate hike. Last week, the Japanese central bank left interest rates unchanged but raised its inflation forecast and highlighted growing uncertainty due to global trade risks.
Overall, the outlook for the JPY remains subdued. The BoJ has ample room to delay rate hikes, justifying its stance with ongoing caution.
Technical Analysis: USD/JPY
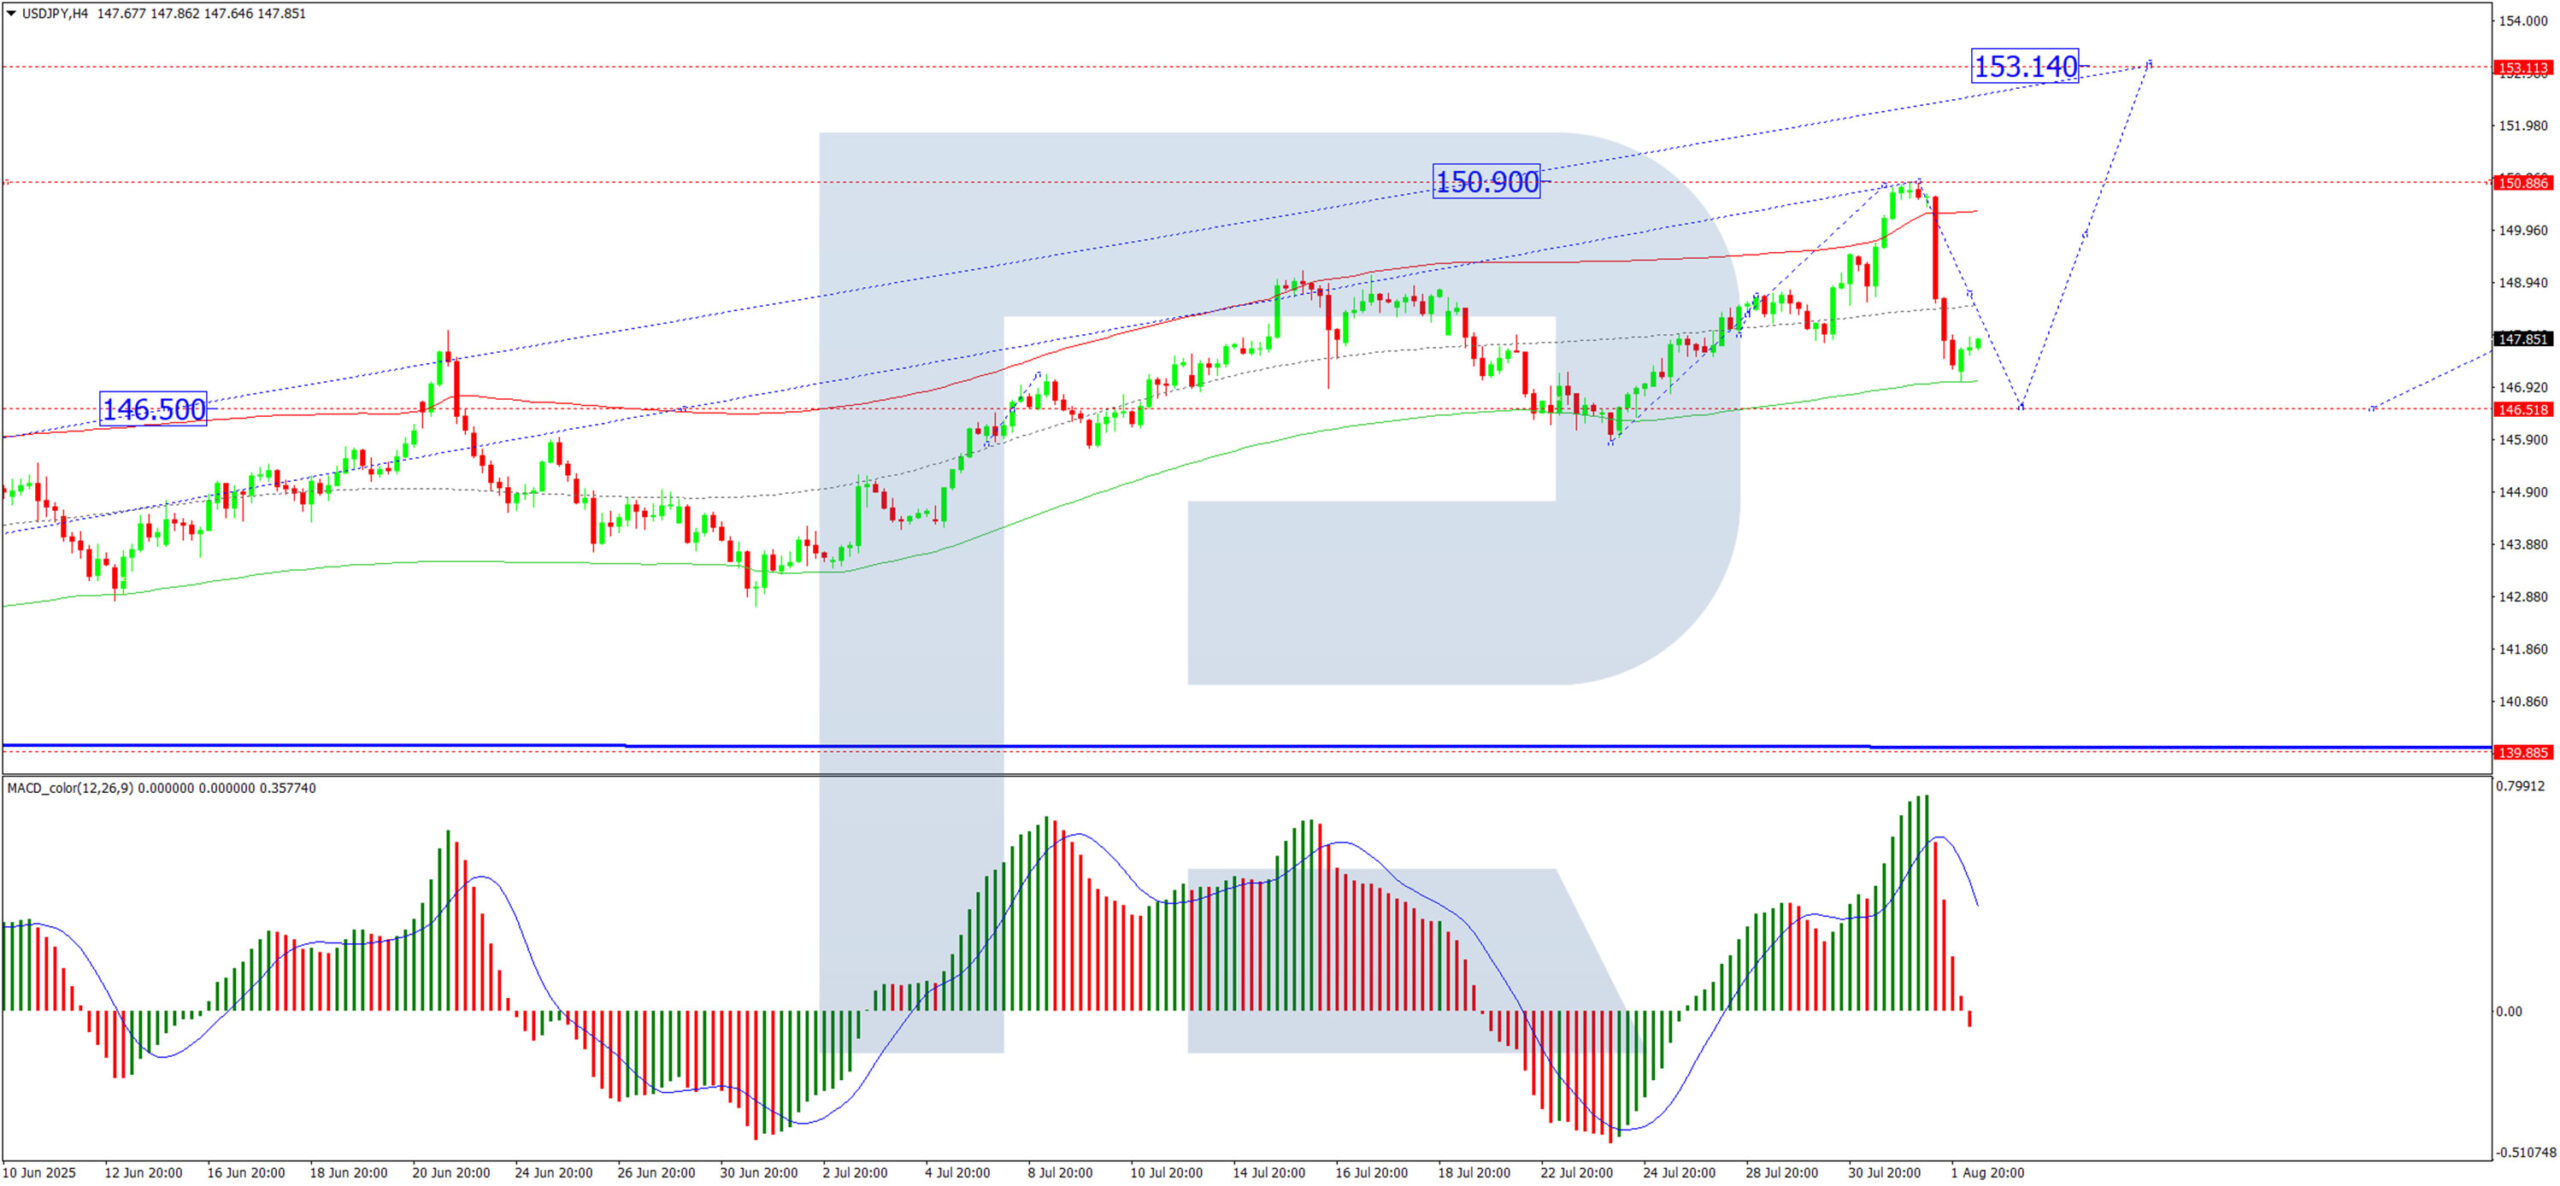
H4 Chart:
On the H4 chart, USD/JPY completed an upward wave to 150.90 before entering a correction phase. A further decline towards 146.52 is anticipated today. Once this level is reached, the pair may initiate a new growth wave, potentially targeting 151.00, with a longer-term prospect of extending the trend to 153.10. This scenario is supported by the MACD indicator, where the signal line remains above zero but is trending sharply downward.
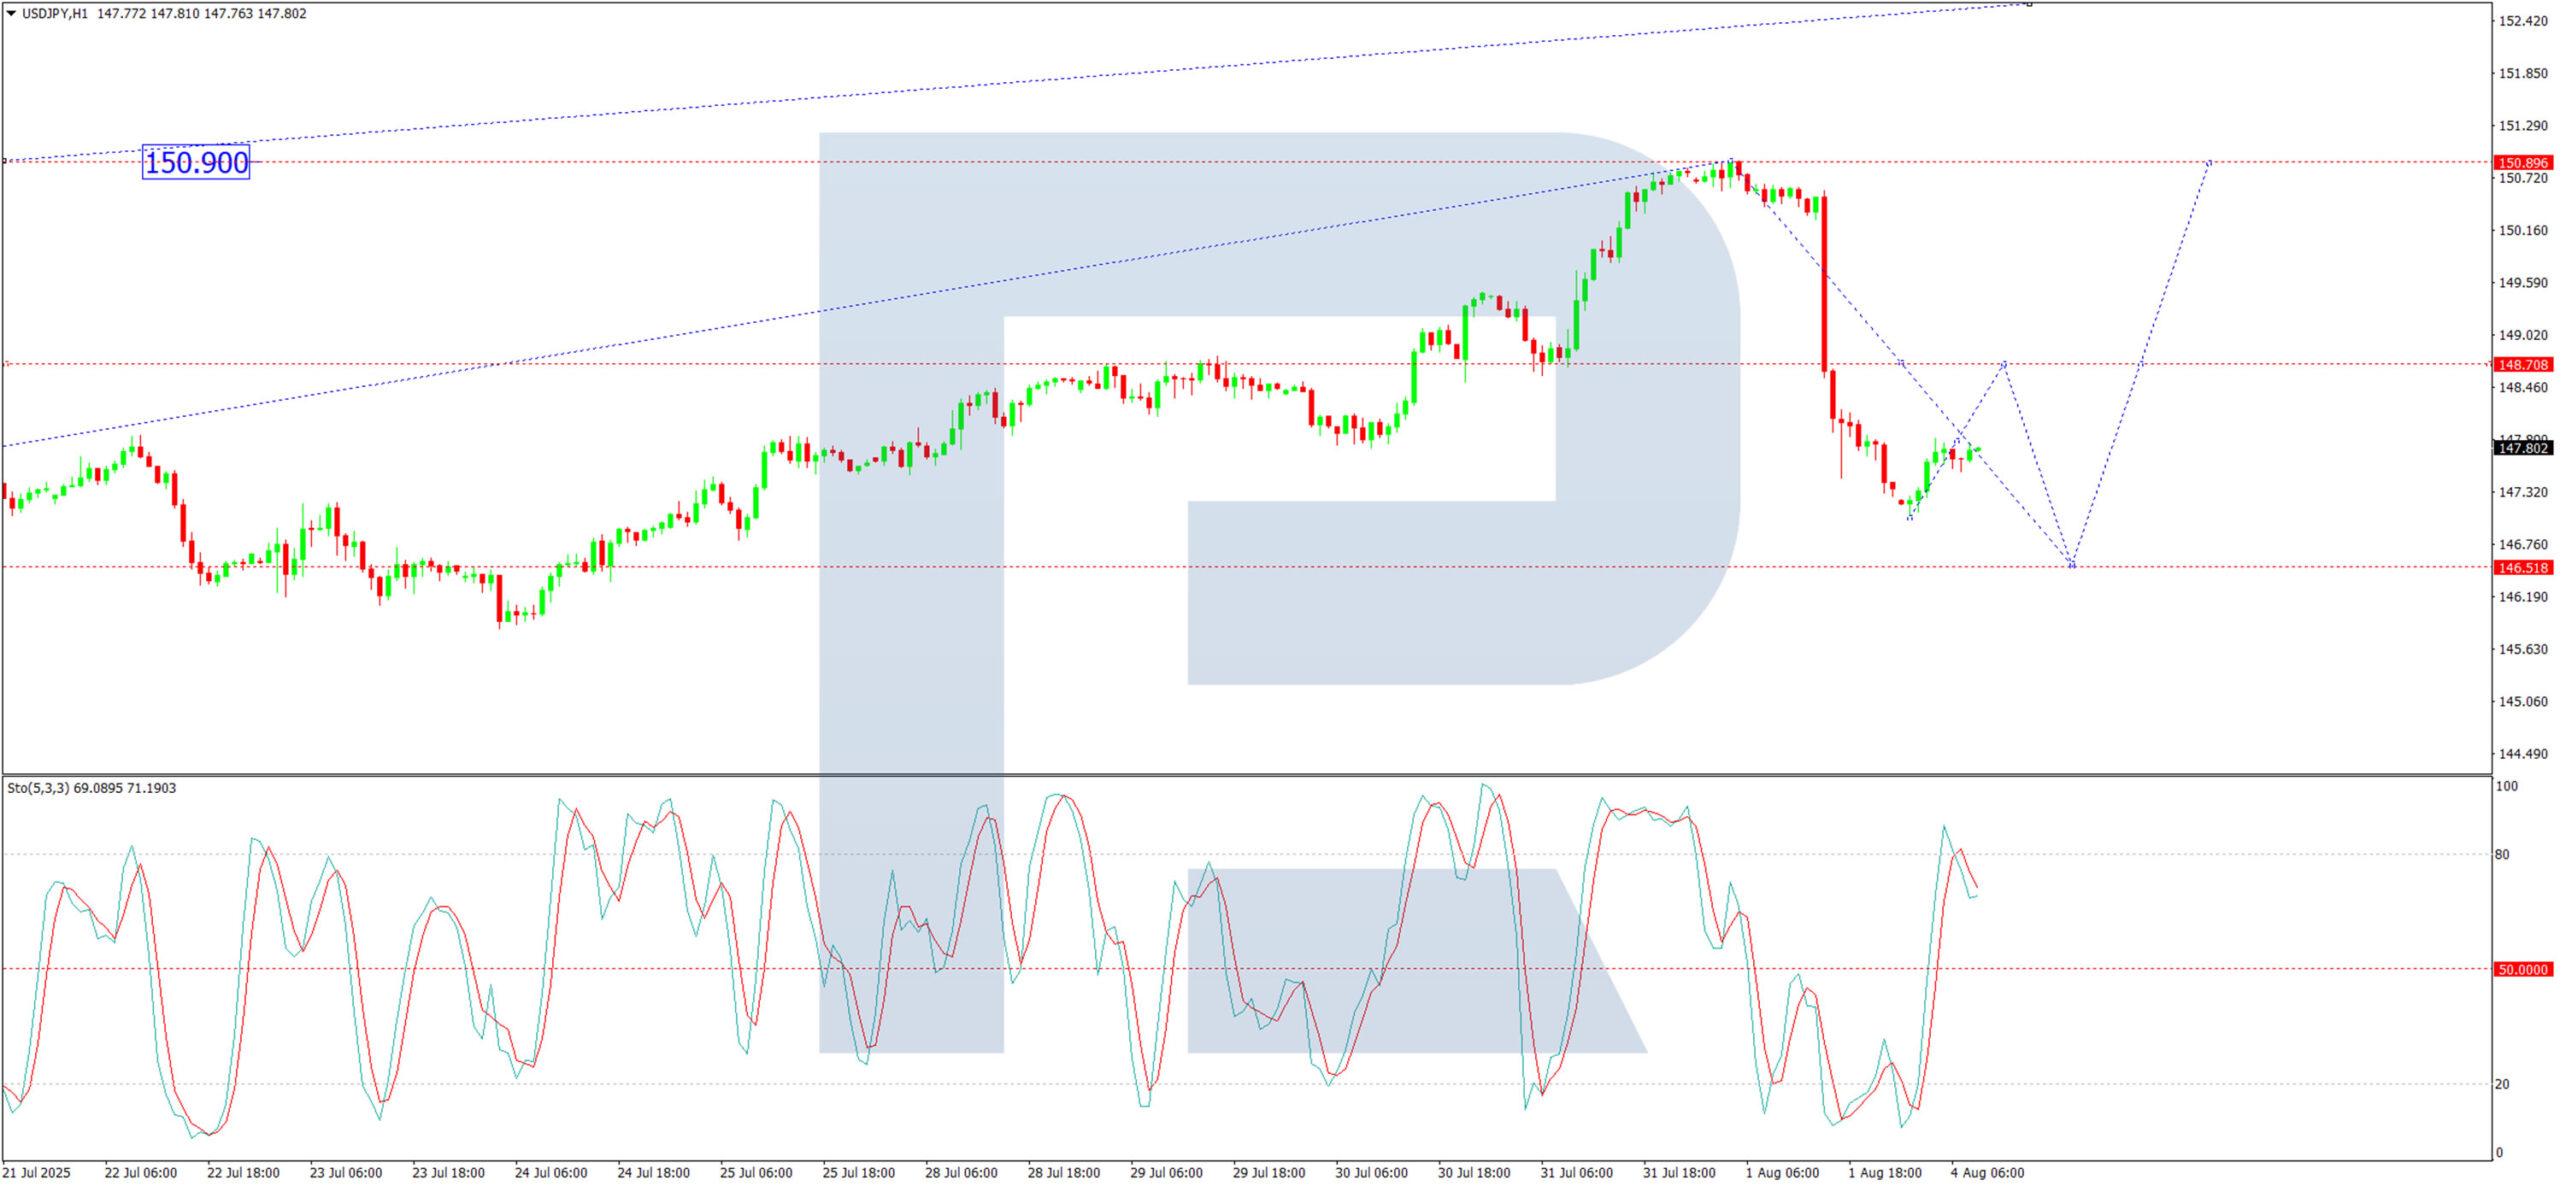
H1 Chart:
On the H1 chart, USD/JPY is forming a corrective structure towards 146.52. A temporary rebound to 148.70 (testing from below) is expected today, followed by a possible resumption of the correction to 146.52. Once this correction concludes, a fresh upward wave towards 151.00 could materialise. The Stochastic oscillator validates this outlook, with its signal line positioned above 50 and pointing upwards.
Conclusion
The yen remains under pressure amid shifting Fed expectations and cautious BoJ signals. Technically, USD/JPY is poised for further correction before potentially resuming its uptrend.
Eurozone Sentix sentiment crashes to -3.7, investors reject US-EU trade deal
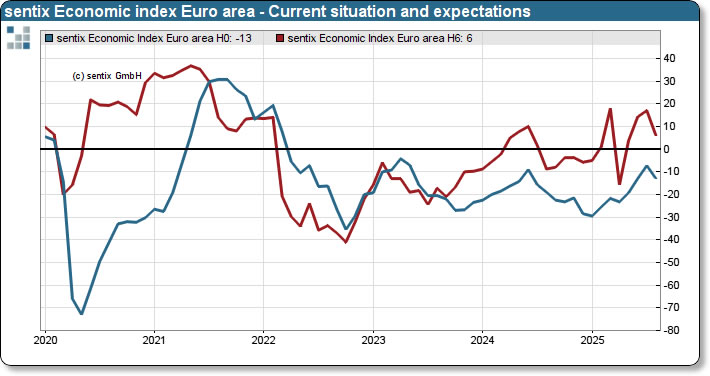
Investor confidence in the Eurozone took a sharp hit in August, with Sentix Investor Confidence Index plunging from 4.5 to -3.7, well below expectations of 6.2. Current Situation Index dropped further into negative territory, falling from -7.3 to -13.0. Expectations Index fell steeply from 17.0 to 6.0. Germany’s figures were even more troubling: the overall index dropped from -0.4 to -12.8, with the Current Situation down from -18.8 to -29.0 and Expectations collapsing from 19.8 to 5.0.
According to Sentix, the sentiment collapse reflects investors’ early judgment of the EU-US tariff deal — and the assessment is "devastating." The agreement, instead of offering clarity or relief, has triggered renewed concerns about Eurozone export sectors. Recent optimism about Germany’s recovery is now in doubt, with export-oriented industries seen facing more pressure in the months ahead. Investors are also increasingly anxious about rising government debt across the bloc.
Adding to the gloom, inflation shows no signs of easing. Sentix’s inflation theme index fell to -11.75, reinforcing the view that the ECB has limited room to ease policy further. With sentiment deteriorating, debt concerns mounting, and no clear inflation relief in sight, the Eurozone’s path to recovery looks increasingly fragile.
US Dollar Index (DXY) Plummets Following Labour Market Data
The US Dollar Index (DXY) fell by approximately 1.4% on Friday after the release of disappointing US labour market figures. According to Forex Factory:
→ The unemployment rate rose from 4.1% to 4.2%;
→ The Nonfarm Employment Change figure came in at 73K, well below the forecast of 103K. This is the lowest level of job creation in the nonfarm sector in 2025 and is roughly half the previous month’s reading (prior to revisions).
→ Furthermore, revisions for May and June were significantly more severe than usual. The May figure was revised downward by 125,000 — from +144,000 to +19,000. Similarly, the June figure was revised down by 133,000 — from +147,000 to +14,000.
These results point to a weakening labour market, which increases the likelihood of a rate cut aimed at supporting economic growth. In turn, expectations of a Fed rate cut are acting as a bearish driver for the US dollar.
Technical Analysis of the DXY Chart
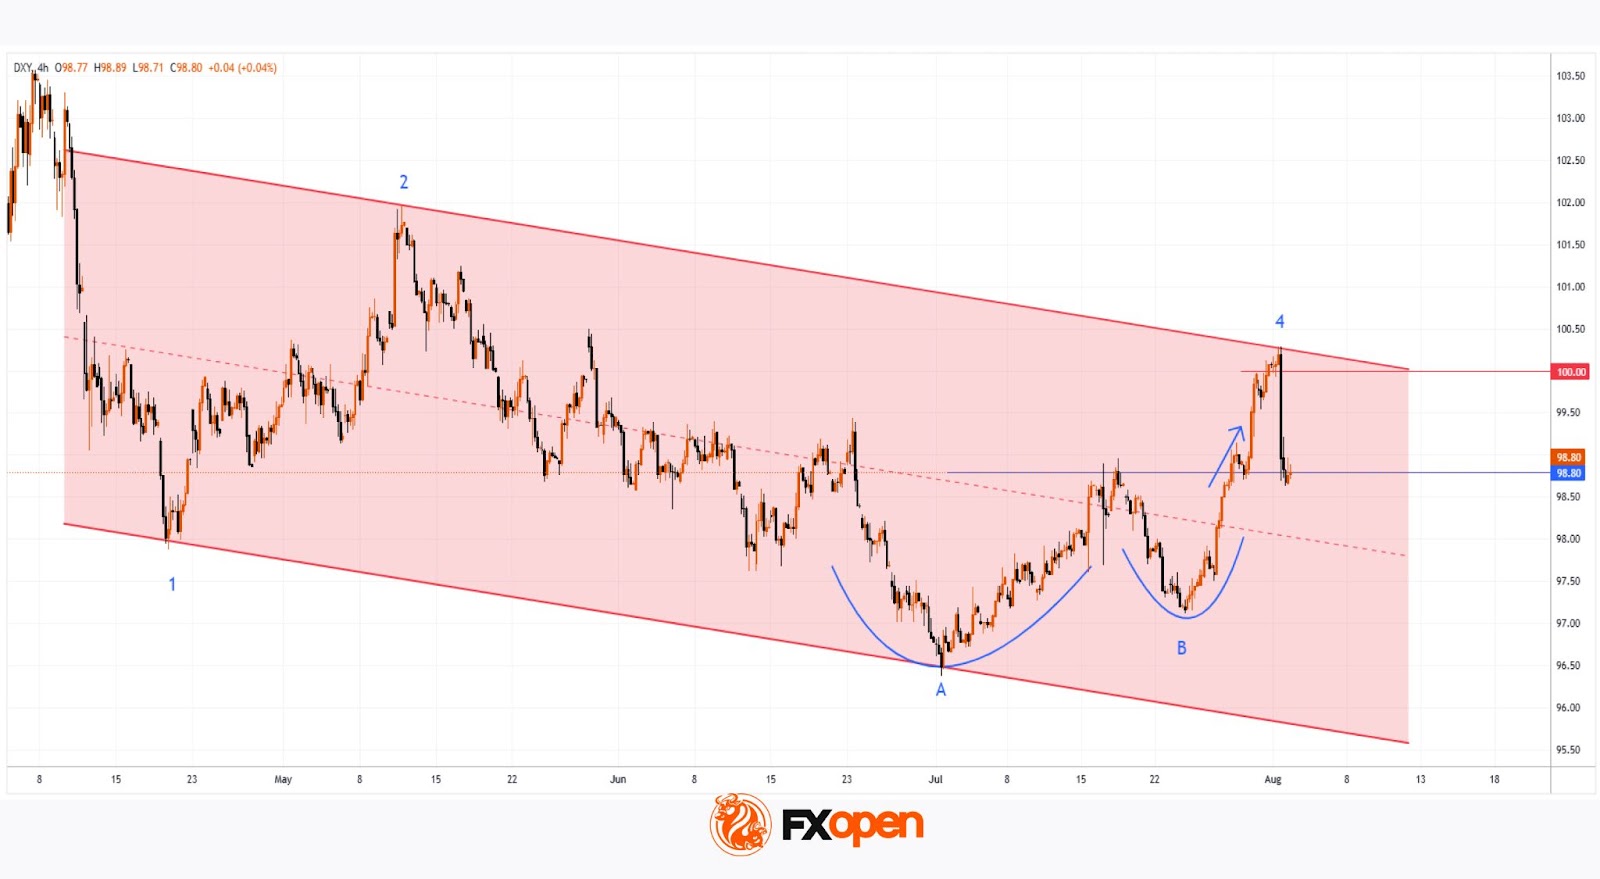
Six days ago, we highlighted two U-shaped trajectories (A and B), which together formed a bullish сup and рandle pattern on the US Dollar Index chart.
Following this, price action generated a notable upward impulse (as indicated by the arrow), breaking through the upper boundary of the pattern.
However, Friday’s news triggered the following developments:
→ A new top (4) was formed on the chart, accompanied by a false bullish breakout above the psychological level of 100.00;
→ The price declined to the 98.80 area. The downward move slowed here, as this zone had previously seen strong bullish activity during the breakout from the pattern’s upper boundary — likely explaining why the market is finding support here on Monday morning.
Overall, the technical picture has shifted towards a bearish outlook. Friday’s peak continues the summer sequence of lower highs and lows: 1 → 2 → bottom of pattern (A) → 4. This structure is part of a broader downtrend that has defined the market in 2025.
Should bearish sentiment persist, fuelled by Friday’s data, we can assume a further decline in the US Dollar Index towards the median line of the descending channel (shown in red), which has been drawn through the aforementioned price extremes.
Trade global index CFDs with zero commission and tight spreads. Open your FXOpen account now or learn more about trading index CFDs with FXOpen.
This article represents the opinion of the Companies operating under the FXOpen brand only. It is not to be construed as an offer, solicitation, or recommendation with respect to products and services provided by the Companies operating under the FXOpen brand, nor is it to be considered financial advice.
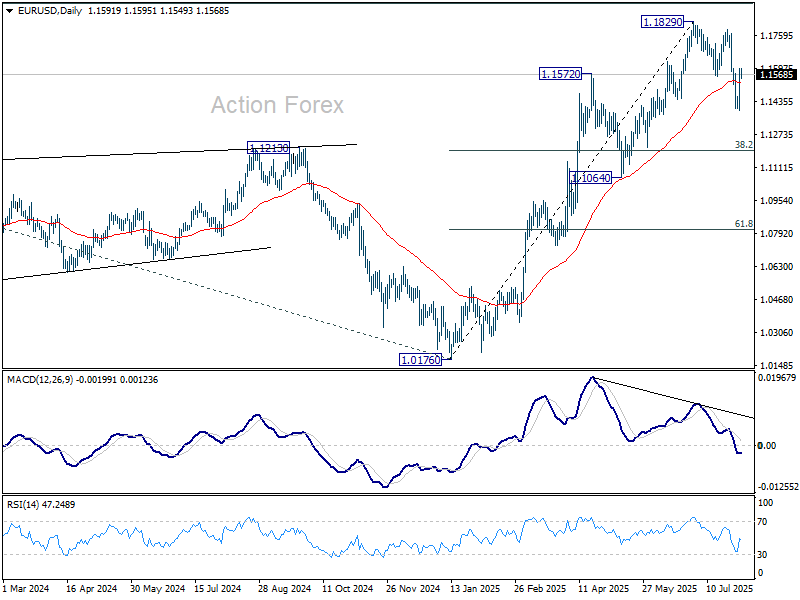
EUR/USD Daily Outlook
Daily Pivots: (S1) 1.1454; (P) 1.1526; (R1) 1.1659; More...
Intraday bias in EUR/USD stays on the upside for the moment. Correction from 1.1829 could have completed with three waves down to 1.1390 already. Further rise should be seen to retest 1.1788/1820 resistance zone. On the downside, break of 1.1390 will resume the correction to 38.2% retracement of 1.0176 to 1.1829 at 1.1198 instead.
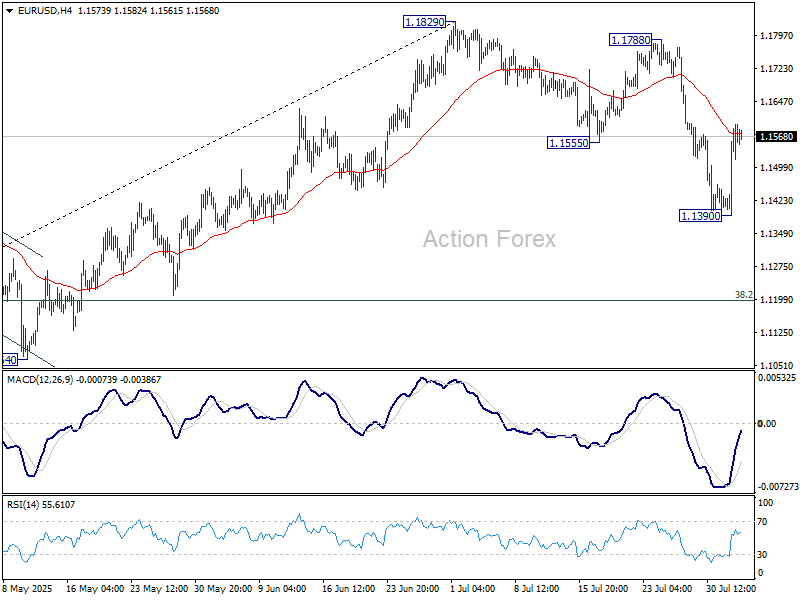
In the bigger picture, rise from 0.9534 long term bottom could be correcting the multi-decade downtrend or the start of a long term up trend. In either case, further rise should be seen to 100% projection of 0.9534 to 1.1274 from 1.0176 at 1.1916. This will remain the favored case as long as 1.1604 support holds.
USD/JPY Daily Outlook
Daily Pivots: (S1) 146.17; (P) 148.54; (R1) 149.80; More...
Intraday bias in USD/JPY remains neutral for the moment. Rebound from 139.87 could still extend high as long as 145.84 support holds. Above 150.90 will target 151.22 fibonacci level. However, on the downside, firm break of 145.84 support will argue that whole rise from 139.87 might have already completed. Deeper fall should then be seen to 142.66 support for confirmation.
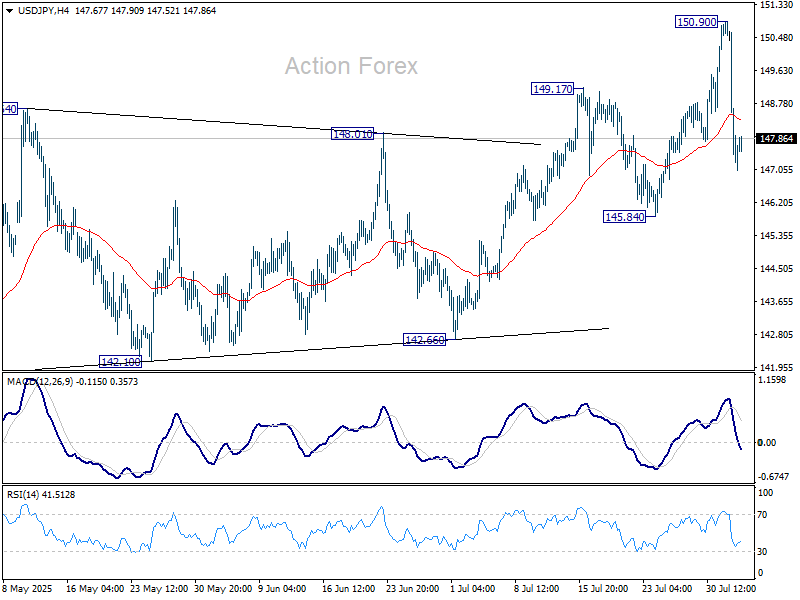
In the bigger picture, price actions from 161.94 (2024 high) are seen as a corrective pattern to rise from 102.58 (2021 low). Decisive break of 61.8% retracement of 158.86 to 139.87 at 151.22 will argue that it has already completed with three waves at 139.87. Larger up trend might then be ready to resume through 161.94 high. In case the corrective pattern extends with another fall, strong support is expected from 38.2% retracement of 102.58 to 161.94 at 139.26 to bring rebound.

GBP/USD Daily Outlook
Daily Pivots: (S1) 1.3177; (P) 1.3244; (R1) 1.3345; More...
Intraday bias in GBP/USD remains neutral at this point. On the upside, sustained break of 1.3363 support turned resistance will indicate that the fall has completed as a three-wave correction. Further rally should then be seen back to 1.3587 resistance next. Nevertheless, sustained trading below 38.2% retracement of 1.2099 to 1.3787 at 1.3142 will target 61.8% retracement at 1.2744.
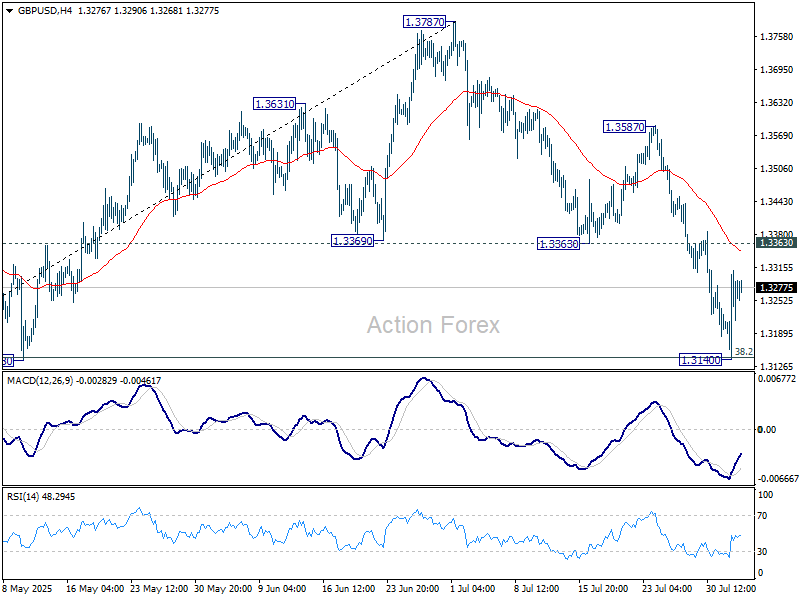
In the bigger picture, up trend from 1.3051 (2022 low) is in progress. Next medium term target is 61.8% projection of 1.0351 to 1.3433 from 1.2099 at 1.4004. Outlook will now stay bullish as long as 55 W EMA (now at 1.3049) holds, even in case of deep pullback.
USD/CHF Daily Outlook
Daily Pivots: (S1) 0.7988; (P) 0.8080; (R1) 0.8132; More….
Intraday bias in USD/CHF stays mildly on the downside for the moment. Deeper decline would be seen to retest 07871/7910 support zone. Firm break there will resume larger down trend. On the upside, though, break of 0.8170 will resume the corrective bounce to 38.2% retracement of 0.9200 to 0.7871 at 0.8379 instead.
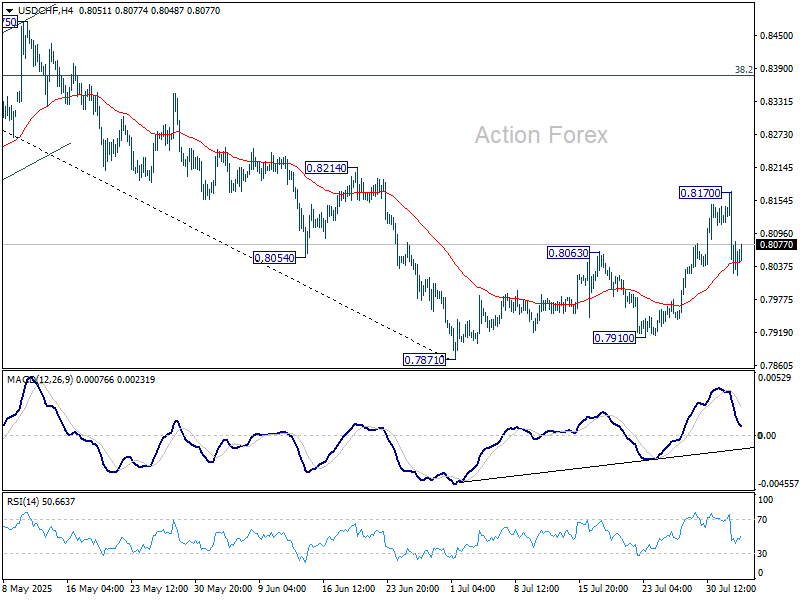
In the bigger picture, long term down trend from 1.0342 (2017 high) is still in progress. Next target is 100% projection of 1.0146 (2022 high) to 0.8332 from 0.9200 at 0.7382. In any case, outlook will stay bearish as long as 0.8475 resistance holds.
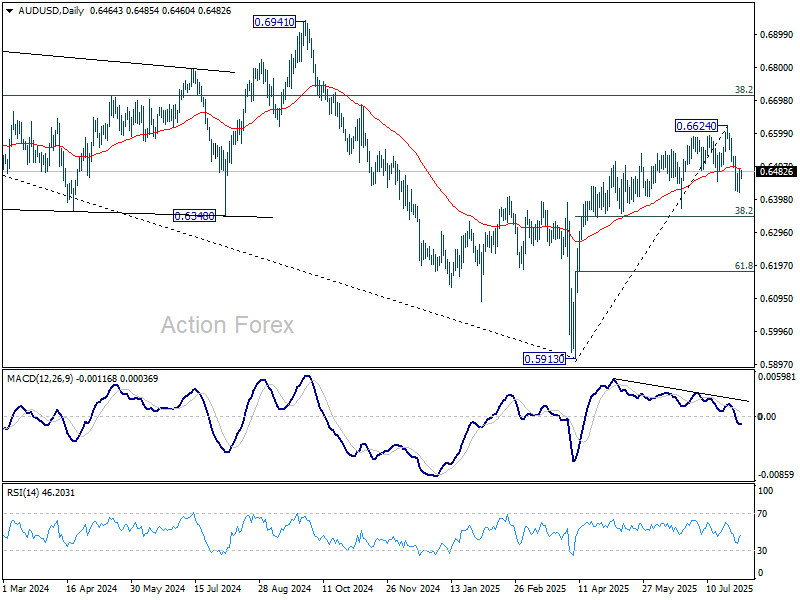
AUD/USD Daily Report
Daily Pivots: (S1) 0.6428; (P) 0.6461; (R1) 0.6502; More...
Intraday bias in AUD/USD remains neutral for the moment. Fall from 0.6624 is at least correcting the rally from 0.5913. Risk will stay on the downside as long as this resistance holds. On the downside, break of 0.6148 will target 38.2% retracement of 0.5913 to 0.6624 at 0.6352.
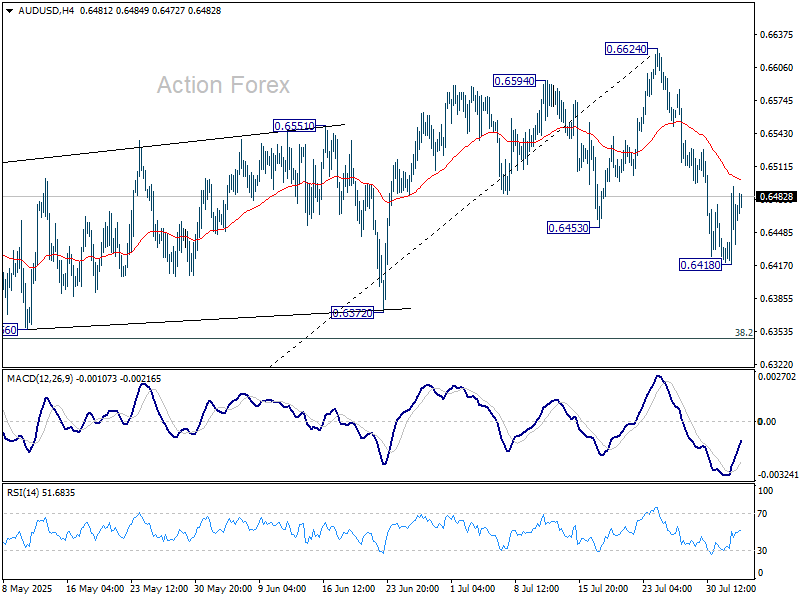
In the bigger picture, there is no clear sign that down trend from 0.8006 (2021 high) has completed. Rebound from 0.5913 is seen as a corrective move. While stronger rally cannot be ruled out, outlook will remain bearish as long as 38.2% retracement of 0.8006 to 0.5913 at 0.6713 holds. Nevertheless, considering bullish convergence condition in W MACD, even in case of another fall through 0.5913, downside should be contained above 0.5506 (2020 low).
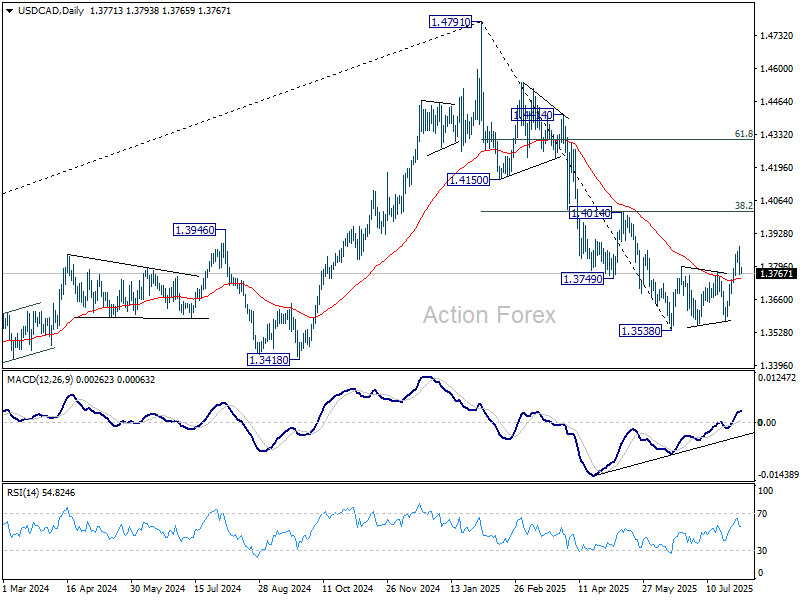
USD/CAD Daily Outlook
Daily Pivots: (S1) 1.3742; (P) 1.3810; (R1) 1.3858; More...
Intraday bias in USD/CAD stays neutral for the moment. On the upside, break of 1.3878 bring stronger rally, but upside should be limited by 1.4014 cluster resistance (38.2% retracement of 1.4791 to 1.3538 at 14017) to complete the correction. On the downside, sustained trading below 55 4H EMA (now at 1.3755) will bring retest of 1.3538 low.
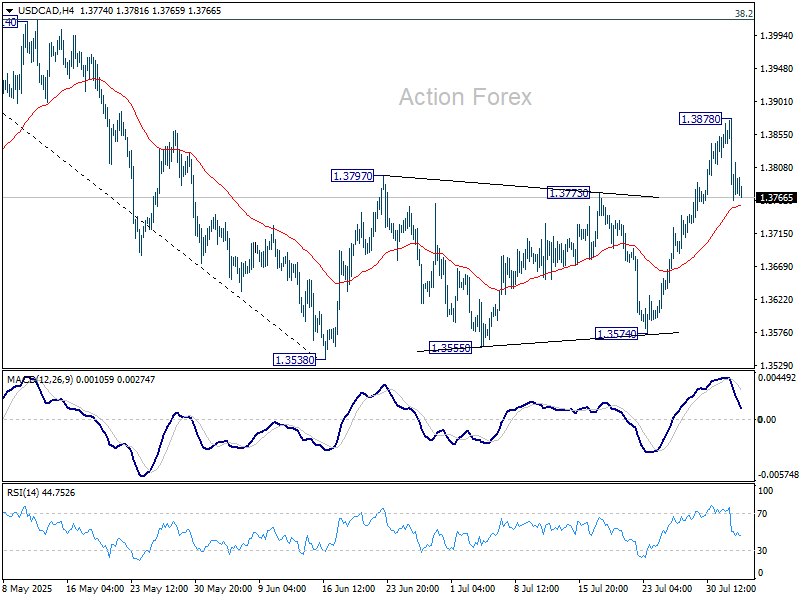
In the bigger picture, price actions from 1.4791 medium term top could either be a correction to rise from 1.2005 (2021 low), or trend reversal. In either case, further decline is expected as long as 1.4014 resistance holds. Next target is 61.8% retracement of 1.2005 (2021 low) to 1.4791 at 1.3069.
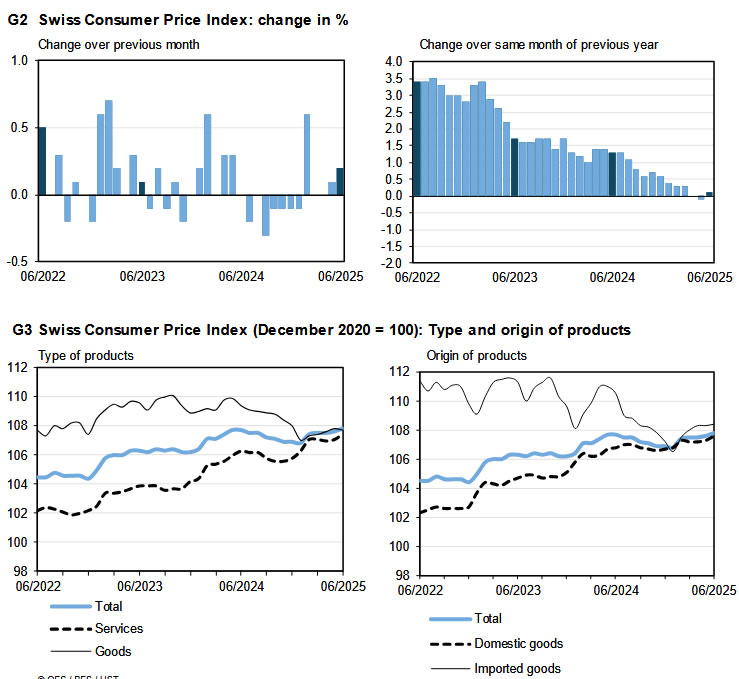
Swiss CPI beats forecast, easing pressure on SNB to go negative
Swiss CPI came in firmer than expected in July, with headline inflation unchanged mom versus forecasts of a -0.2% mom decline. Core CPI — which excludes fresh and seasonal products, energy, and fuel — fell slightly by -0.1% mom, while domestic product prices rose 0.2% mom and imported product prices dropped -0.9% mom.
On an annual basis, headline CPI ticked up to 0.2% yoy from 0.1% yoy, also ahead of the 0.1% yoy forecast. Core CPI accelerated from 0.6% yoy to 0.8% y/y yoy. Domestic product inflation remained steady at 0.7% yoy, while imported product prices, although still negative, improved from -1.9% yoy to -1.4% yoy.
Today’s data modestly ease concerns that Switzerland is slipping back into outright deflation. There has been persistent speculation that the SNB might resume negative interest rates following a series of cuts that brought the policy rate back to 0.00%. But July’s inflation uptick may buy policymakers time ahead of the next meeting on September 25.
In the background, the slight weakening in Swiss Franc, as global markets stabilize and trade tensions ease, helps reduce deflationary pressure. If August CPI data show further improvement, expectations will likely shift toward a steady hold in September rather than another policy adjustment.