

Sample Category Title
USD/CHF Weekly Outlook
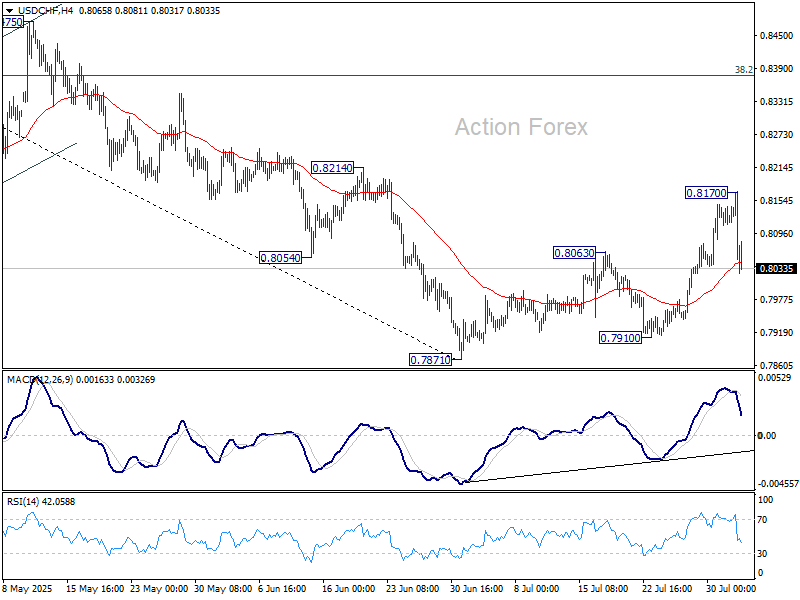
USD/CHF's rebound from 0.7871 extended higher last week but reversed after hitting 0.8170. Initial bias is mildly on the downside this week for retesting 07871/7910 support zone. Firm break there will resume larger down trend. On the upside, though, break of 0.8170 will resume the corrective bounce to 38.2% retracement of 0.9200 to 0.7871 at 0.8379 next.
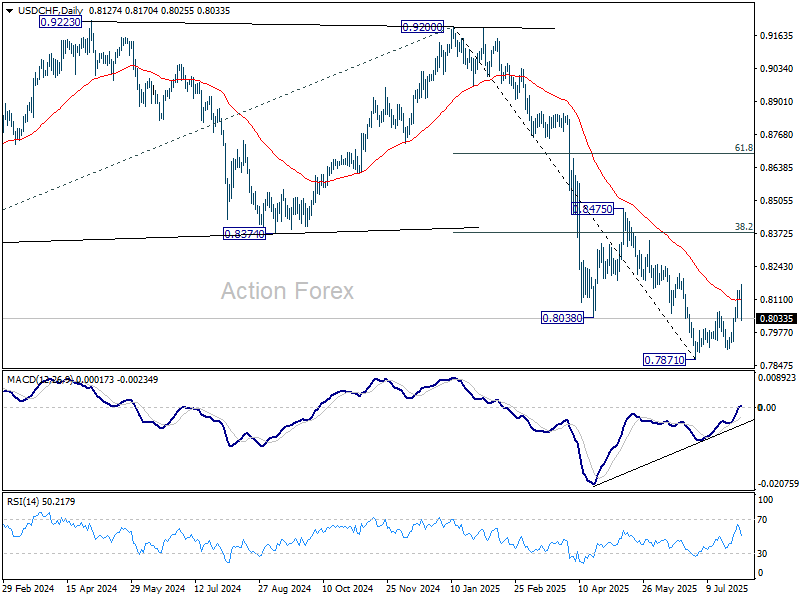
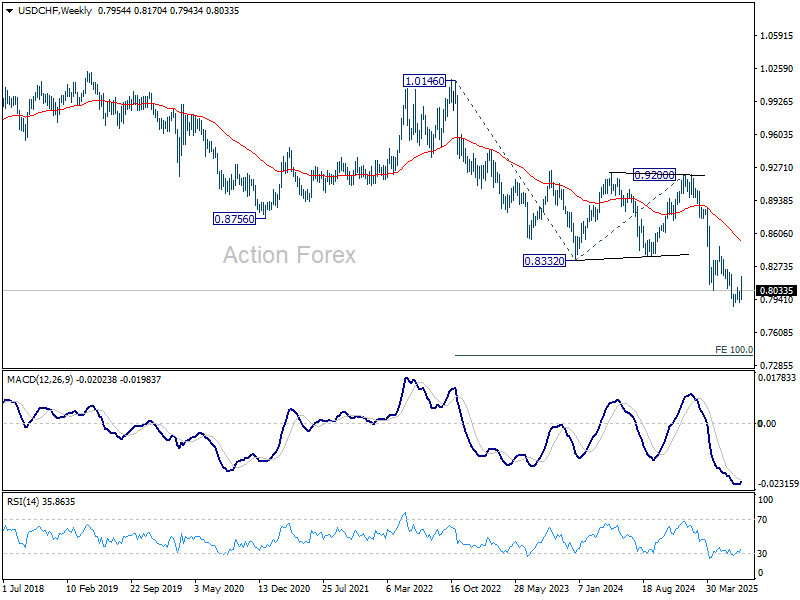
In the bigger picture, long term down trend from 1.0342 (2017 high) is still in progress. Next target is 100% projection of 1.0146 (2022 high) to 0.8332 from 0.9200 at 0.7382. In any case, outlook will stay bearish as long as 0.8475 resistance holds.
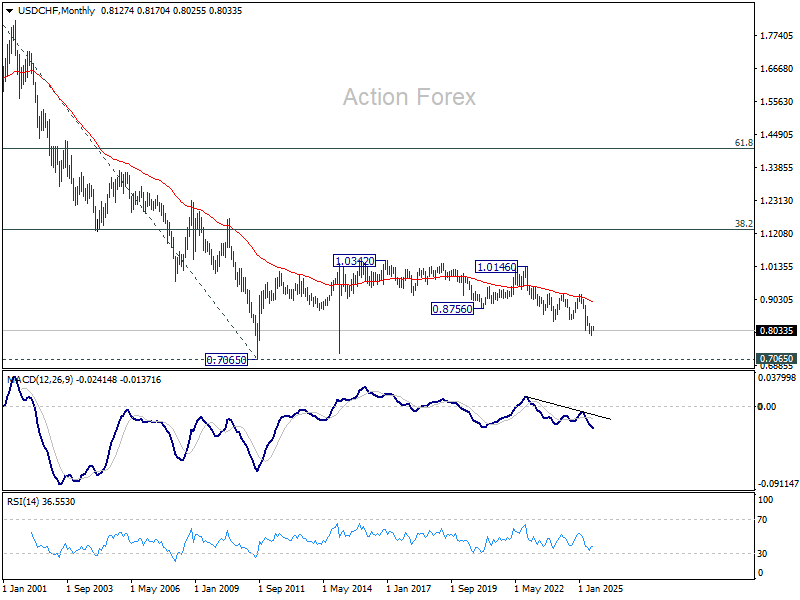
In the long term picture, price action from 0.7065 (2011 low) are seen as a corrective pattern to the multi-decade down trend from 1.8305 (2000 high). It's uncertain if the fall from 1.0342 is the second leg of the pattern, or resumption of the down trend. But in either case, outlook will stay bearish as long as 0.9200 resistance holds. Retest of 0.7065 should be seen next.
AUD/USD Weekly Report
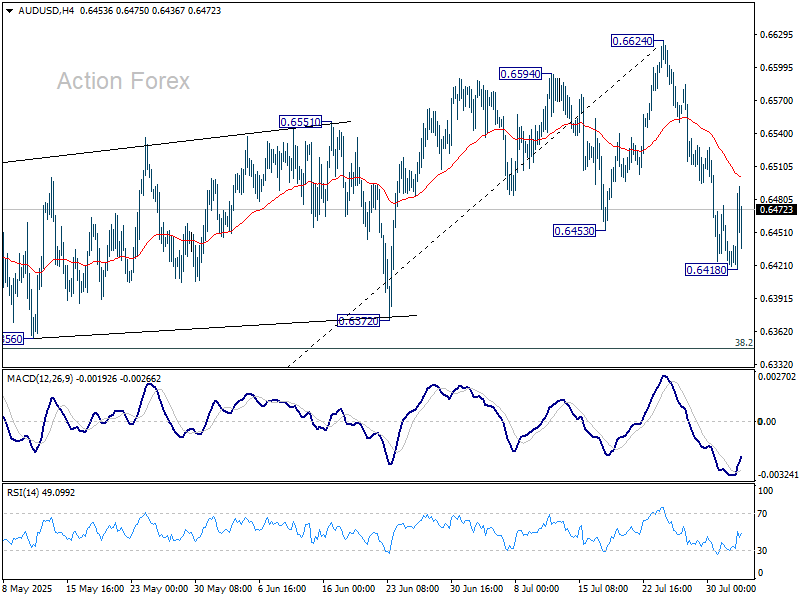
AUD/USD's fall from 0.6624 extended lower to 0.6418 last week but recovered since then. Initial bias is turned neutral this week first. Fall from 0.6624 is at least correcting the rally from 0.5913. Risk will stay on the downside as long as this resistance holds. On the downside, break of 0.6148 will target 38.2% retracement of 0.5913 to 0.6624 at 0.6352.
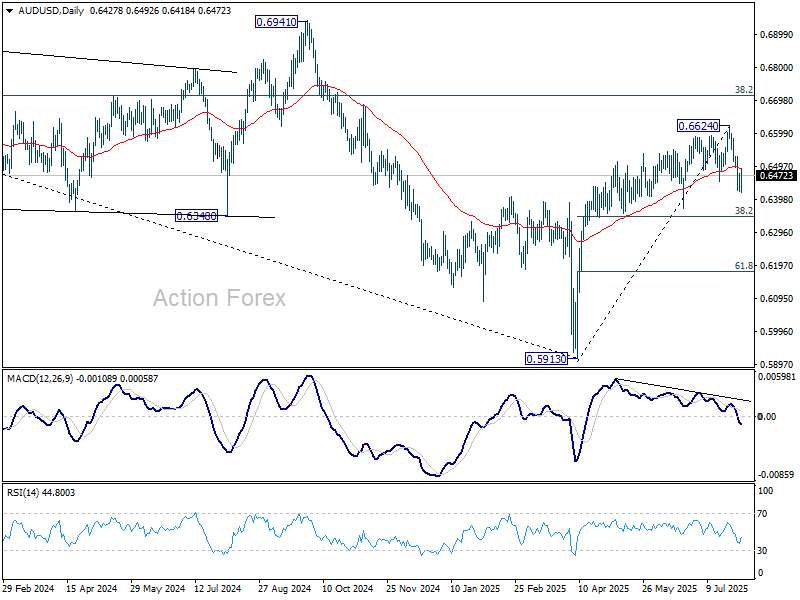
In the bigger picture, there is no clear sign that down trend from 0.8006 (2021 high) has completed. Rebound from 0.5913 is seen as a corrective move. While stronger rally cannot be ruled out, outlook will remain bearish as long as 38.2% retracement of 0.8006 to 0.5913 at 0.6713 holds. Nevertheless, considering bullish convergence condition in W MACD, even in case of another fall through 0.5913, downside should be contained above 0.5506 (2020 low).
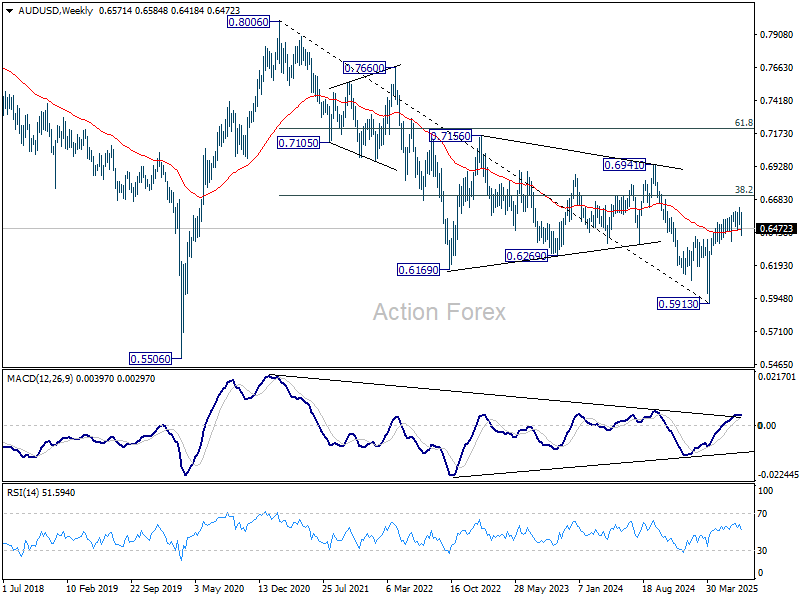
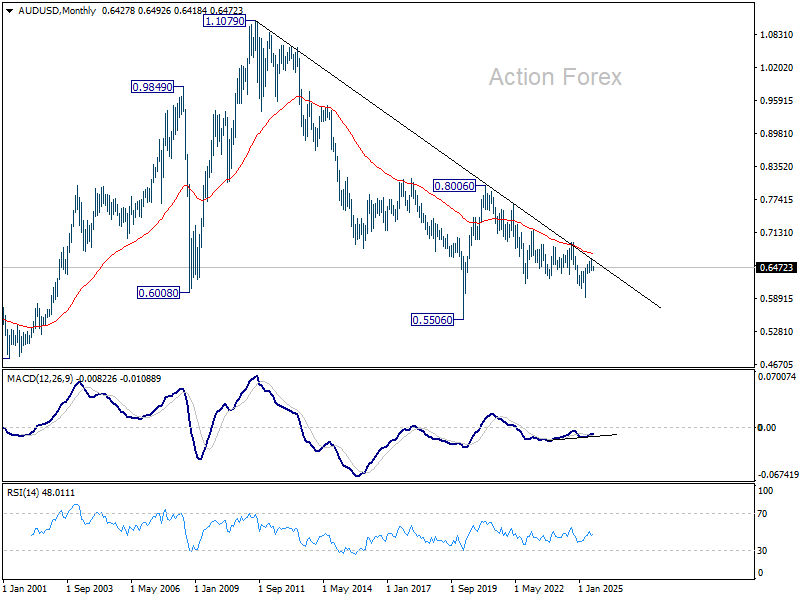
In the long term picture, fall from 0.8006 is seen as the second leg of the corrective pattern from 0.5506 long term bottom (2020 low). Hence, in case of deeper decline, strong support should emerge above 0.5506 to contain downside to bring reversal. On the upside, firm break of 0.6941 will argue that the third leg has already started back to 0.8006.
USD/CAD Weekly Outlook
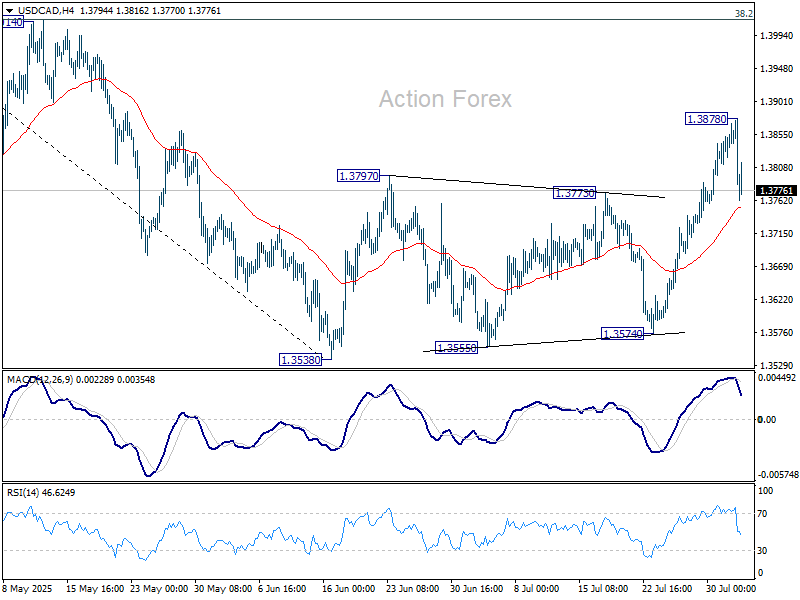
USD/CAD's corrective rebound from 1.3538 extended higher last week but retreated after hitting 1.3787. Initial bias is turned neutral this week first. On the upside, break of 1.3878 bring stronger rally, but upside should be limited by 1.4014 cluster resistance (38.2% retracement of 1.4791 to 1.3538 at 14017) to complete the correction. On the downside, sustained trading below 55 4H EMA (now at 1.3751) will bring retest of 1.3538 low.
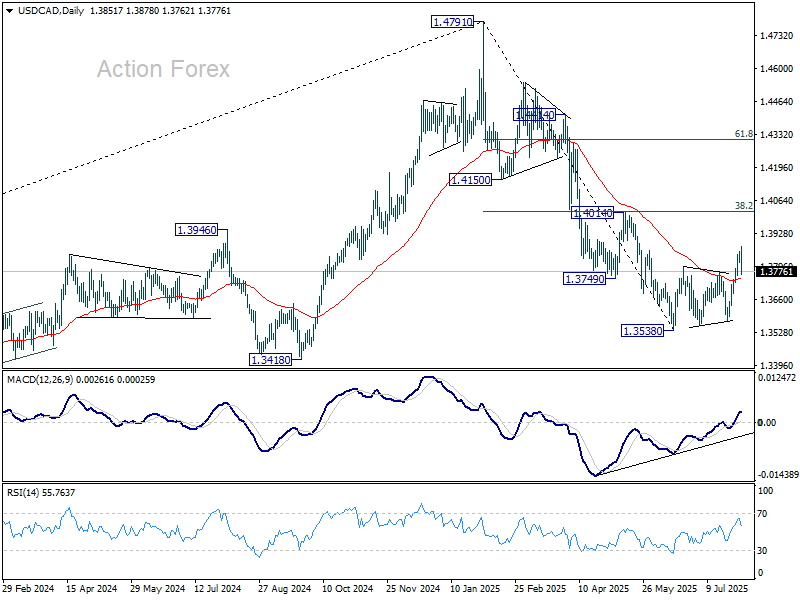
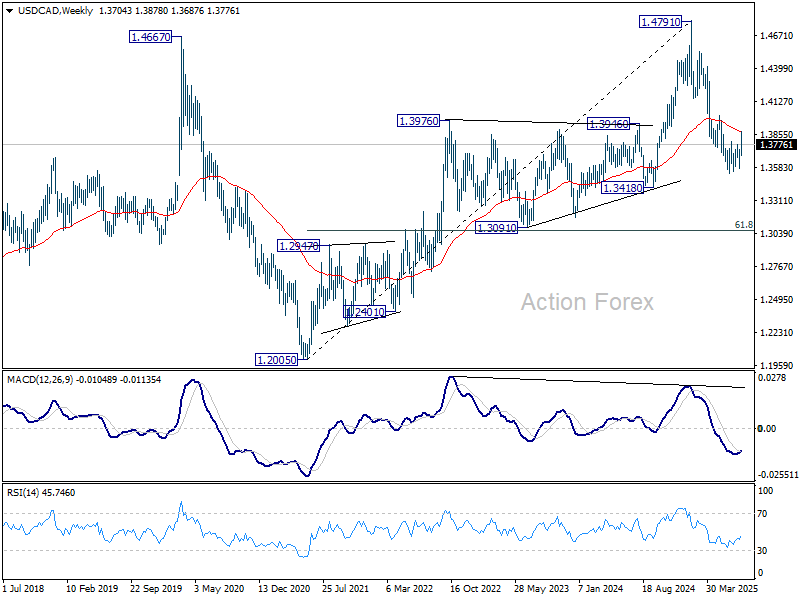
In the bigger picture, price actions from 1.4791 medium term top could either be a correction to rise from 1.2005 (2021 low), or trend reversal. In either case, further decline is expected as long as 1.4014 resistance holds. Next target is 61.8% retracement of 1.2005 (2021 low) to 1.4791 at 1.3069.
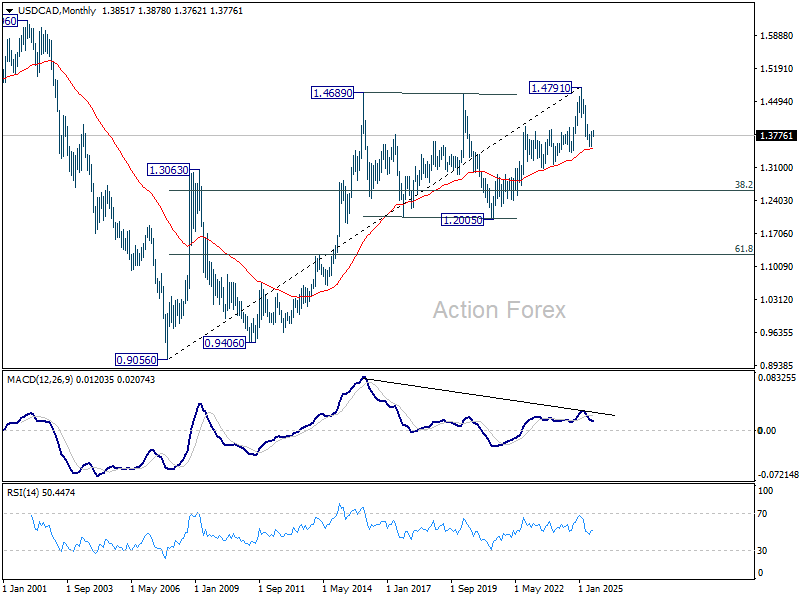
In the long term picture, as long as 55 M EMA (now at 1.2512) holds, up trend from 0.9056 (2007 low) should still resume through 1.4791 at a later stage. However, sustained trading below 55 M EMA will argue that the up trend has already completed, with rise from 1.2005 to 1.4791 as the fifth wave. 1.4791 would then be seen as a long term top and deeper medium term down trend should then follow.
GBP/JPY Weekly Outlook
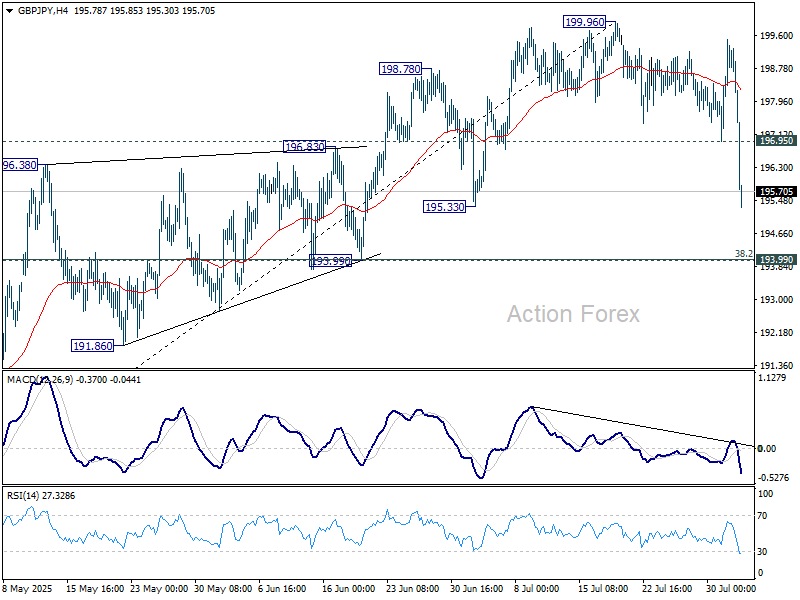
GBP/JPY's corrective pattern from 199.96 continued last week and resumed after brief recovery. Initial bias is now on the downside this week for 193.99 cluster support (38.2% retracement of 184.35 to 199.96 at 193.99). On the upside, above 196.95 support turned resistance will turn intraday bias neutral again first.
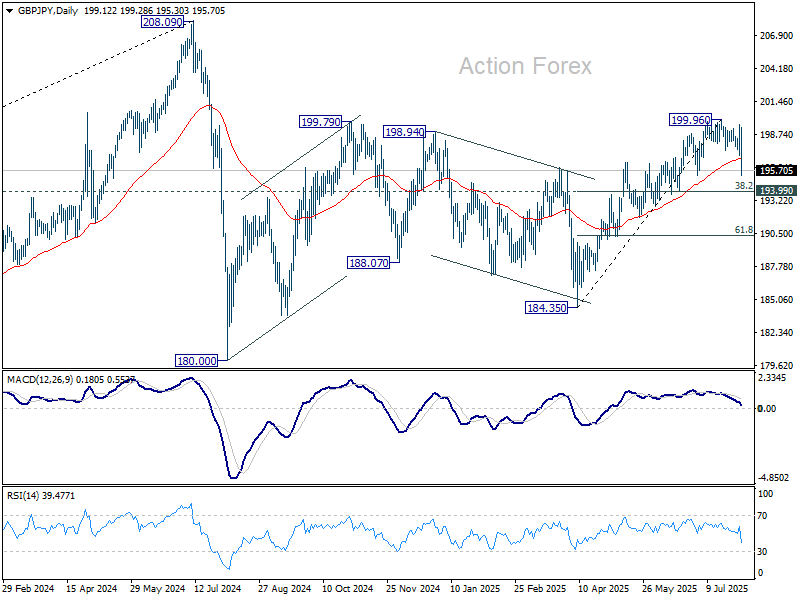
In the bigger picture, price actions from 208.09 (2024 high) are seen as a correction to rally from 123.94 (2020 low). The pattern might still extend with another falling leg. But in that case, strong support should be seen from 38.2% retracement of 123.94 to 208.09 at 175.94 to contain downside. Meanwhile, decisive break of 208.09 will confirm long term up trend resumption.
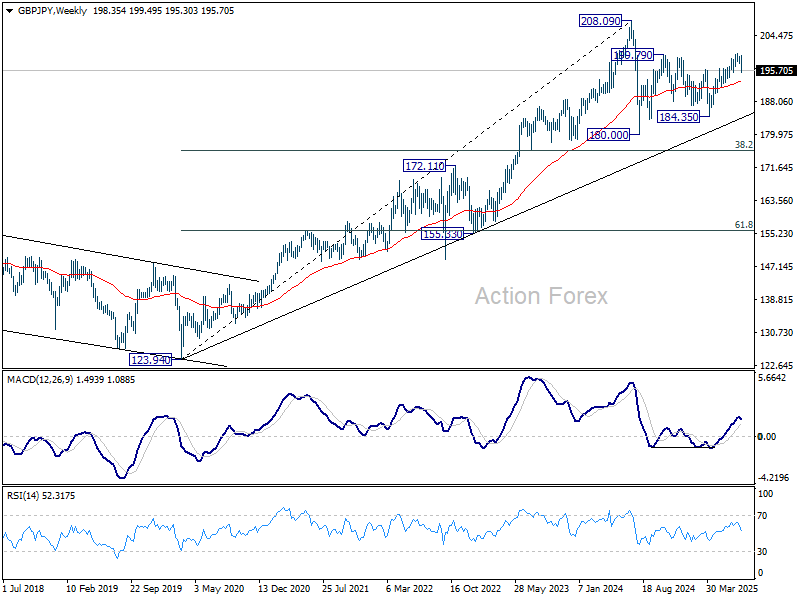
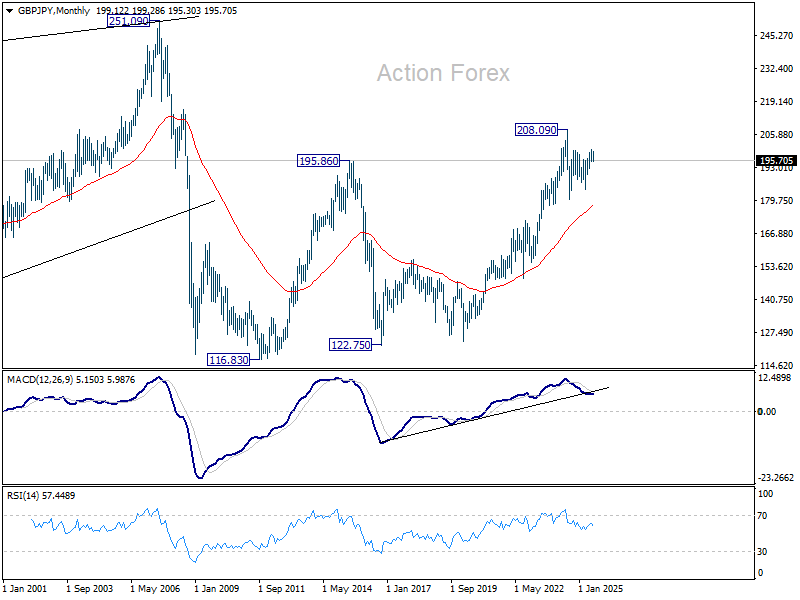
In the long term picture, there is no sign that the long term up trend from 122.75 (2016 low) has concluded. But firm break of 208.09 is needed to confirm resumption. Otherwise, more medium term range trading could still be seen.
EUR/JPY Weekly Outlook
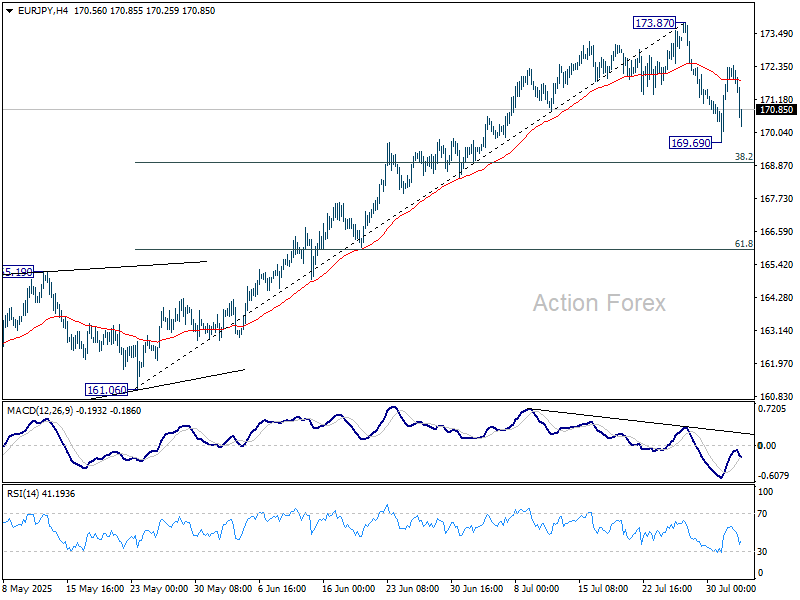
EUR/JPY's steep pullback from 173.87 last week indicates short term topping, and a consolidation phase is now in progress. Initial bias is neutral this week first. Downside should be contained by 38.2% retracement of 161.06 to 173.87 at 168.97 to bring rebound. On the upside, firm break of 173.87 will resume larger rally from 154.77 to retest 175.41 high.
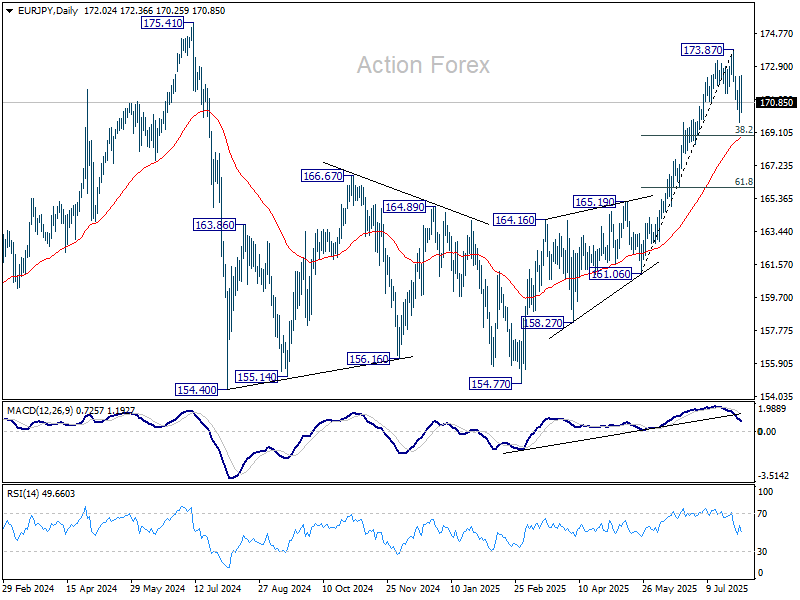
In the bigger picture, considering current strong momentum as seen in the rally from 154.77, corrective pattern from 175.41 could have already completed. Decisive break there will confirm long term up trend resumption. Next target is 61.8% projection of 124.37 to 175.41 from 154.77 at 186.31. However, rejection by 175.41, followed by firm break of 55 D EMA (now at 168.80) will delay this bullish case.
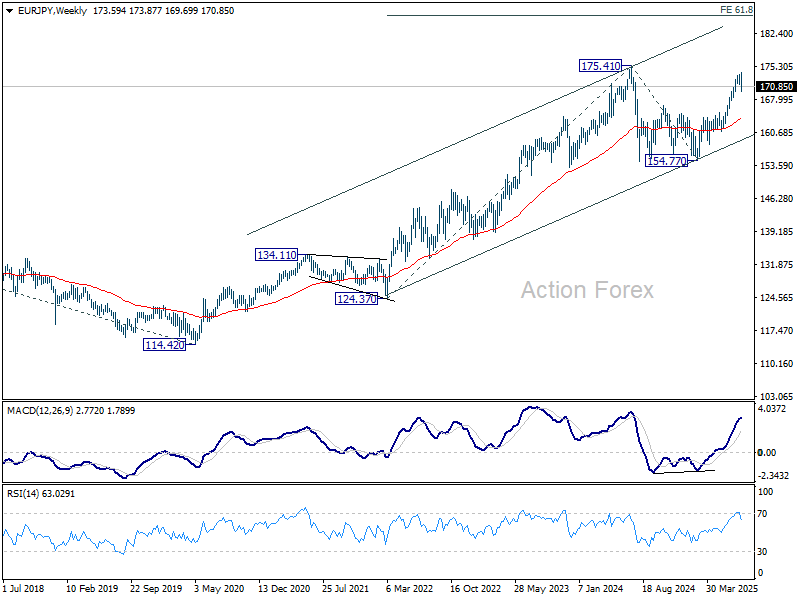
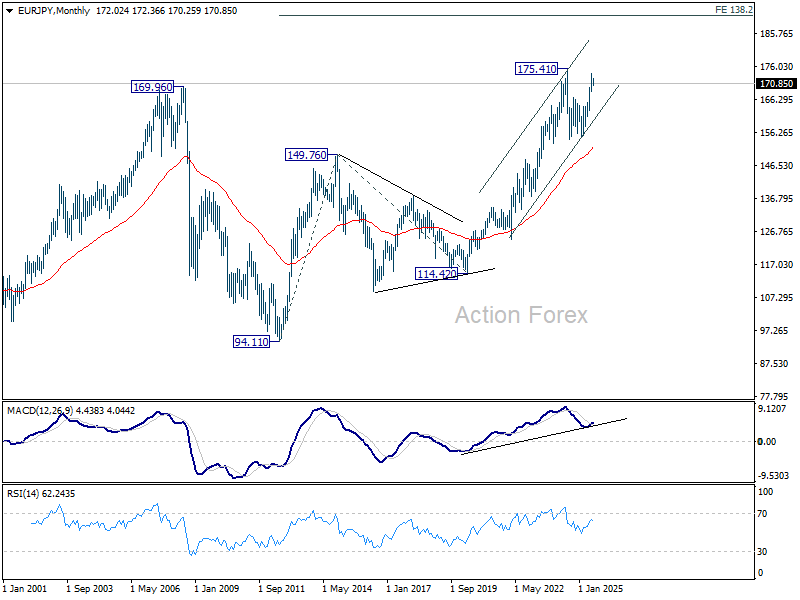
In the long term picture, up trend fro 94.11 (2021 low) is still in progress. On resumption, next target is 138.2% projection of 94.11 to 149.76 (2014 high) from 114.42 (2020 low) at 191.32.
EUR/GBP Weekly Outlook
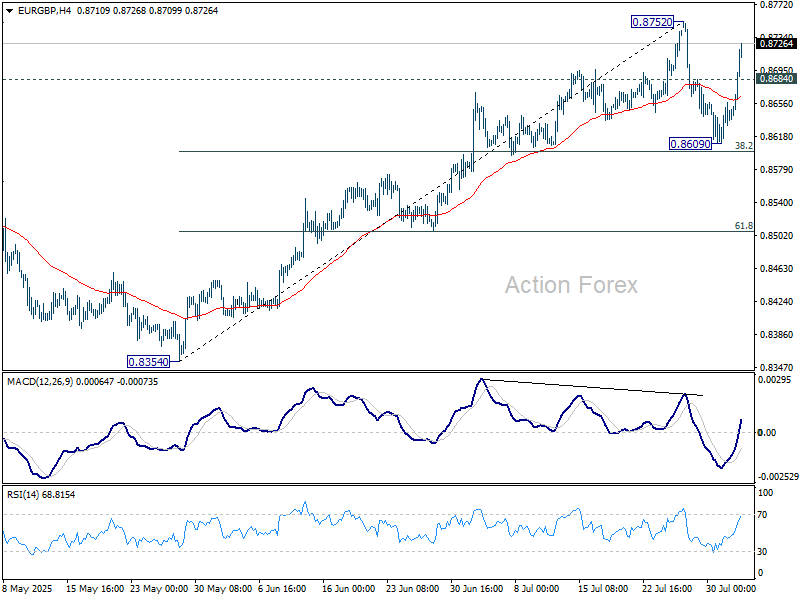
EUR/GBP staged a deep pullback to 0.8609 last week but rebounded just ahead of 38.2% retracement of 0.8354 to 0.8752 at 0.8600. Initial bias is turn neutral this week first. Corrective pattern from from 0.8752 could still extend. But in case of another fall, downside should be contained by 0.8600. Firm break of 0.8752 will resume the rise from 0.8354 towards 0.8867 fibonacci level.
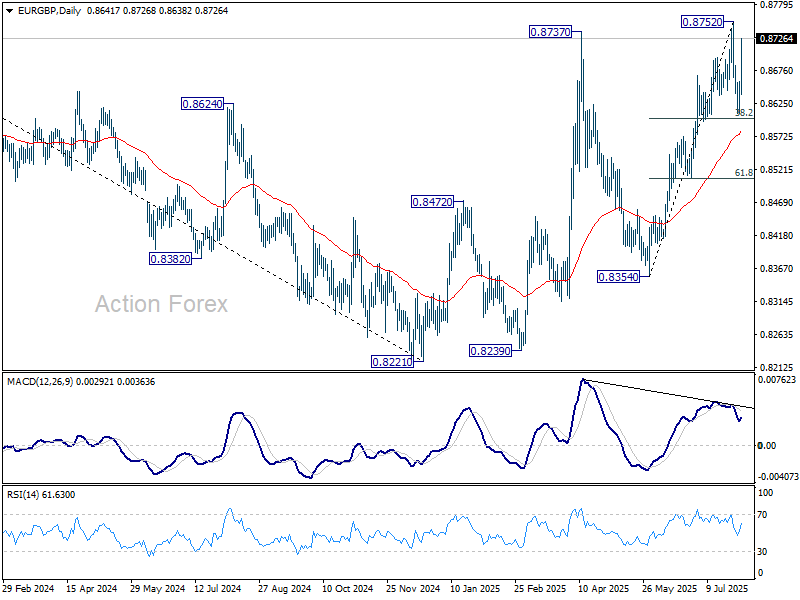
In the bigger picture, the structure from 0.8221 medium term bottom are not impulsive enough to suggest that it's reversing the down trend from 0.9267 (2022 high). But even if it's a correction, further rise is expected to 61.8% retracement of 0.9267 to 0.8221 at 0.8867. This will remain the favored case as long as 55 W EMA (now at 0.8485) holds.
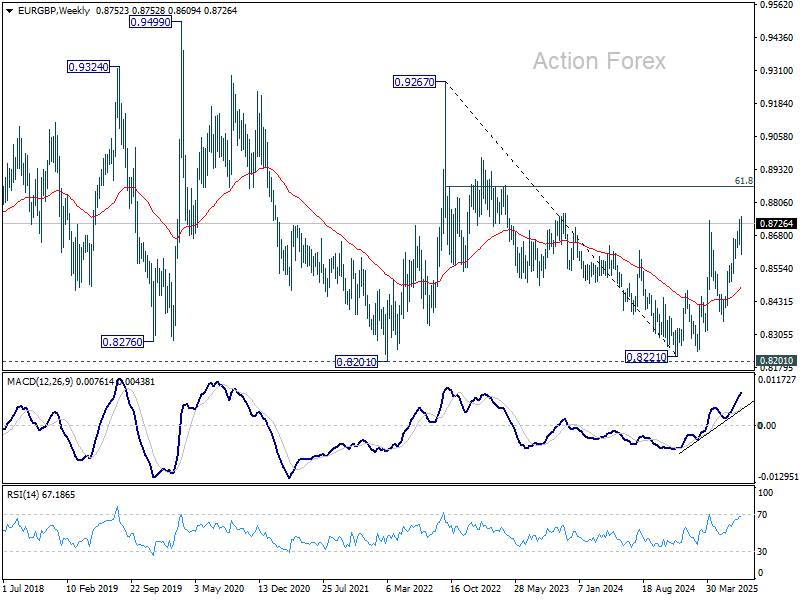
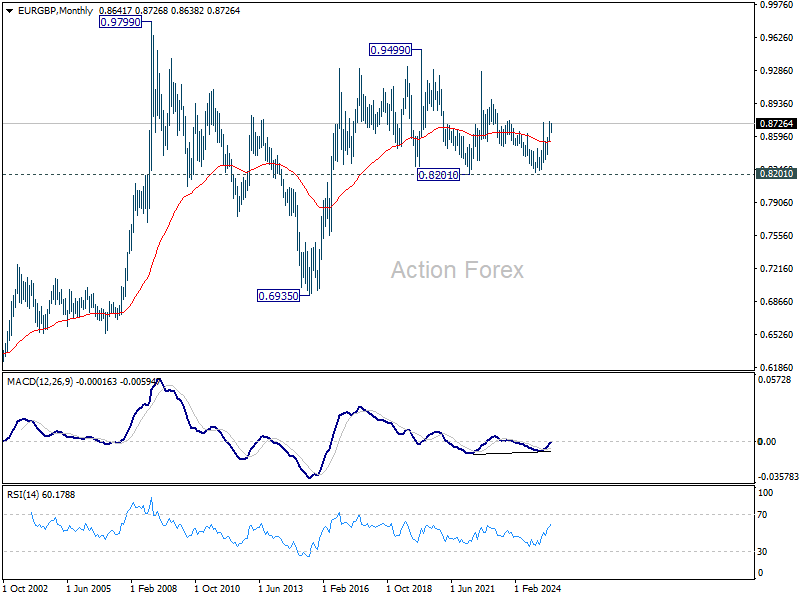
In the long term picture, price action from 0.9499 (2020 high) is seen as part of the long term range pattern from 0.9799 (2008 high). Range trading should continue between 0.8201 and 0.9499, until there is clear signal of imminent breakout.
EUR/AUD Weekly Outlook
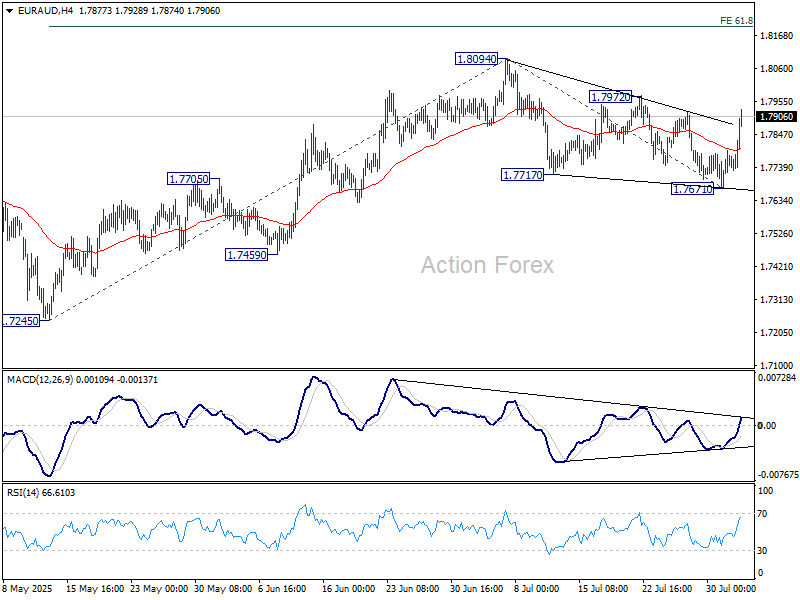
EUR/AUD resumed the decline from 1.8094 last week but quickly rebounded after hitting 1.7671. Initial bias stays neutral this week first. On the upside, break of 1.7972 resistance should resume the whole rally from 1.7245 through 1.8094 to 61.8% projection of 1.7245 to 1.8094 from 1.7671 at 1.8196. On the downside, below 1.7671 will bring deeper fall back to 1.7459 support instead.
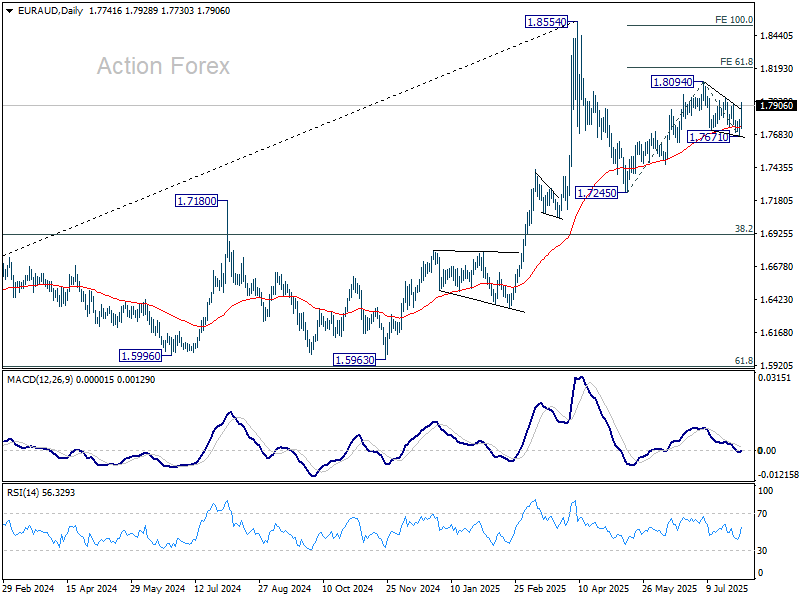
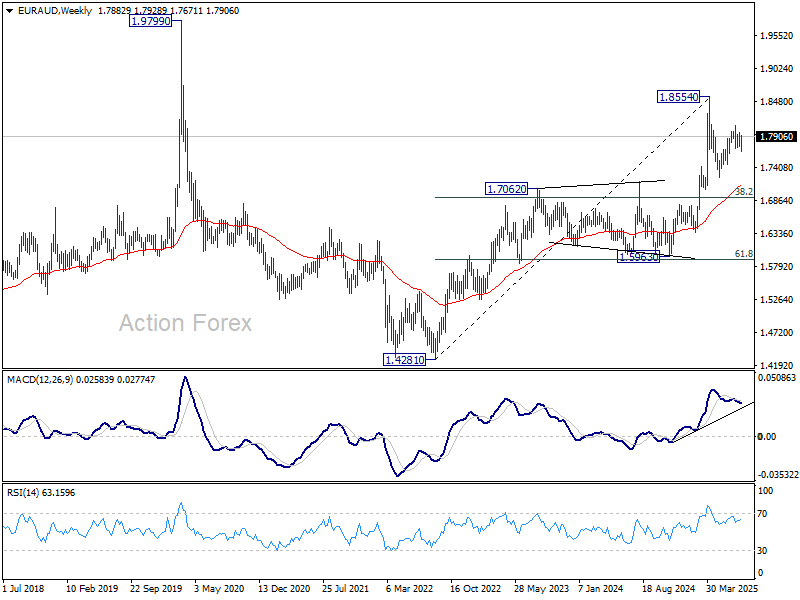
In the bigger picture, price actions from 1.8554 medium term top are seen as a corrective pattern. Such pattern could extend further with another falling leg. But even in that case, downside should be contained by 38.2% retracement of 1.4281 (2022 low) to 1.8554 at 1.6922 to bring rebound. Up trend from 1.4281 is expected to resume at a later stage.
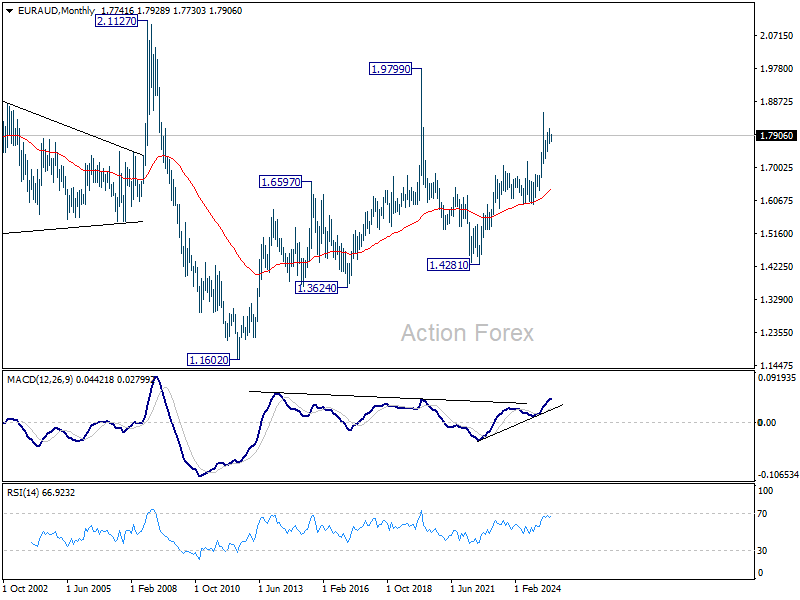
In the longer term picture, rise from 1.4281 is seen as the second leg of the pattern from 1.9799 (2020 high), which is part of the pattern from 2.1127 (2008 high). As long as 55 M EMA (now at 1.6414) holds, this second leg could still extend higher.
EUR/CHF Weekly Outlook
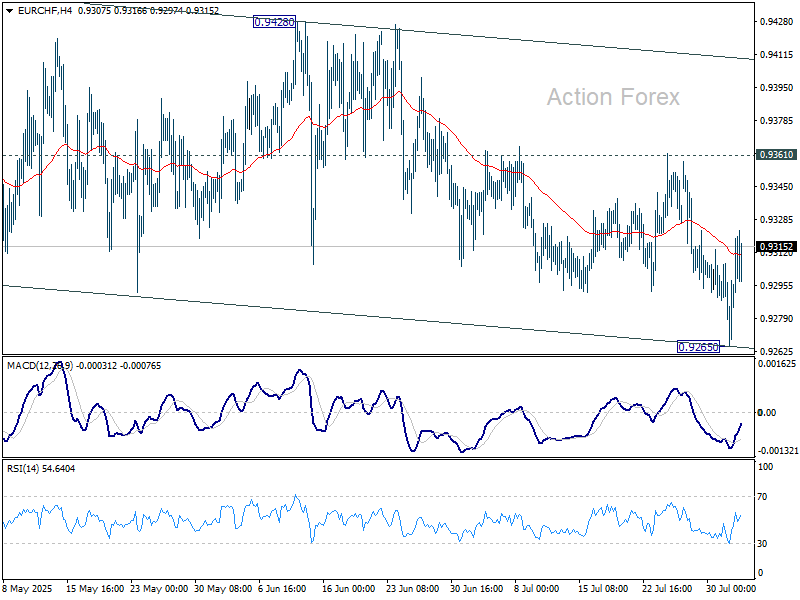
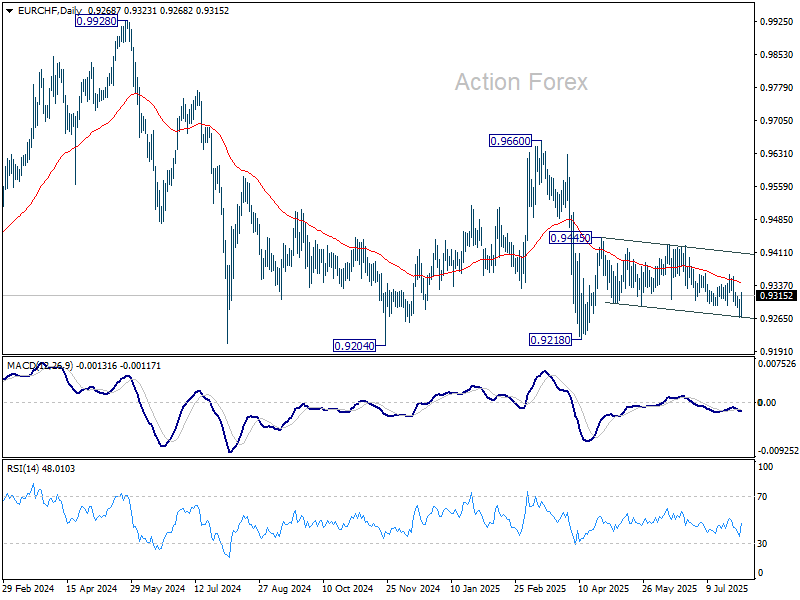
EUR/CHF fell further to 0.9265 last week but lost momentum again and recovered. Initial bias is turned neutral this week first. Price actions from 0.9445 could still be considered a corrective pattern. On the upside, above 0.9361 resistance will target 0.9428 resistance first. However, below 0.9265 will bring another fall back to retest 0.9218 low.
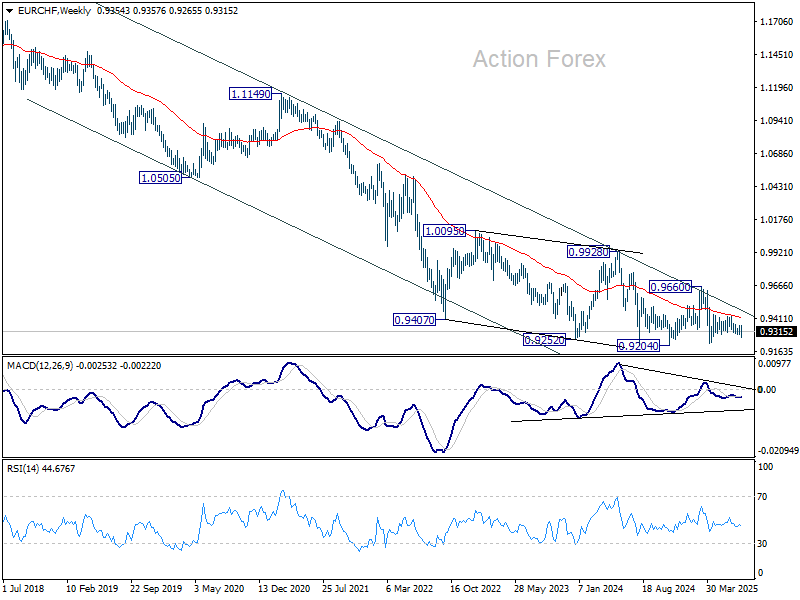
In the bigger picture, the down trend from 0.9204 (2018 high) might still be in progress considering that EUR/CHF is staying well inside the long term falling channel. However, with bullish convergence condition in W MACD, downside position should be limited in case of another fall. Instead, firm break of 0.9660 resistance will be an important sign of medium term bullish trend reversal.
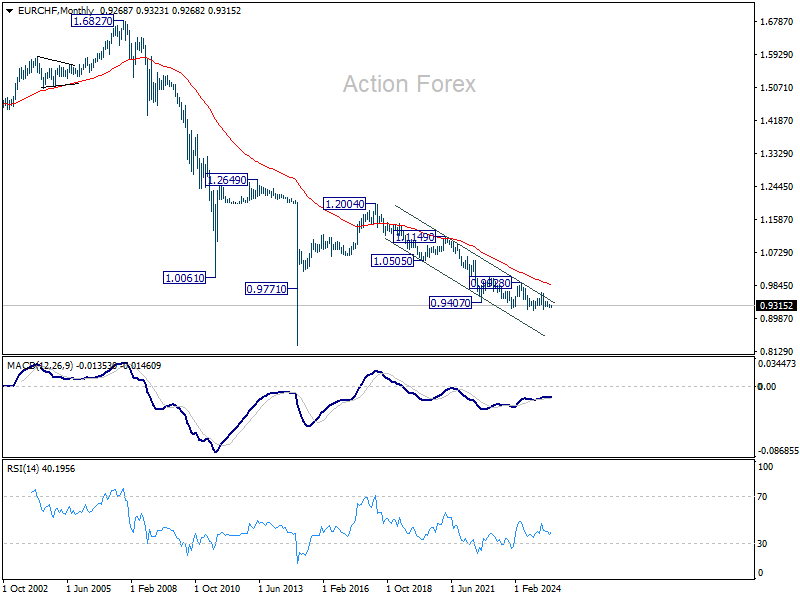
In the long term picture, overall long term down trend is still in progress in EUR/CHF. Outlook will continue to stay bearish as long as 55 M EMA (now at 0.9855) holds.
Unpacking the New Tariffs & Updating the Tracker
Summary
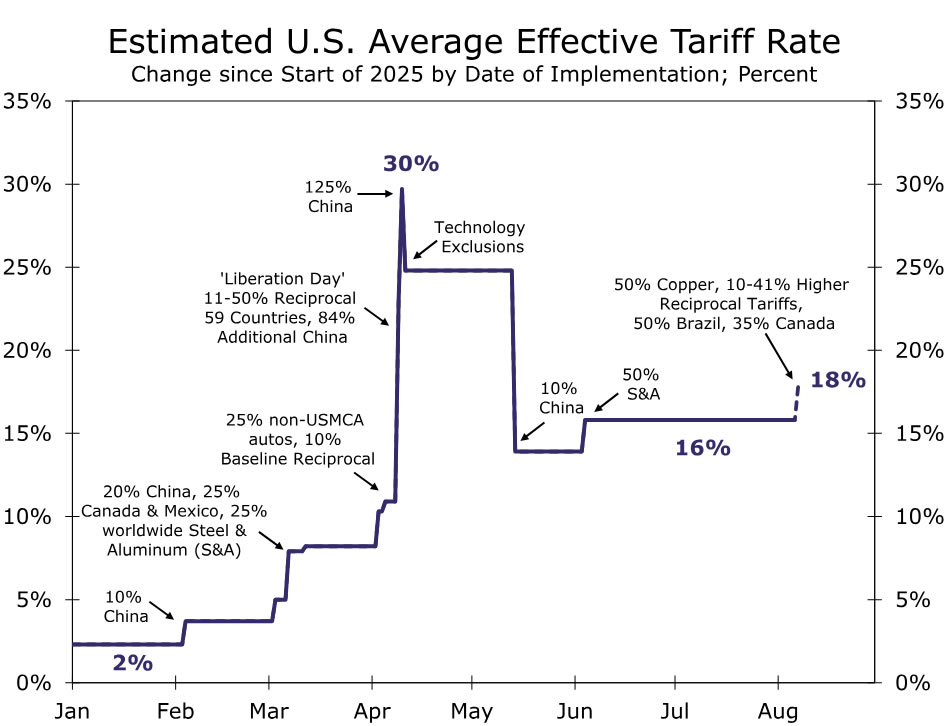
Recent trade announcements have been billed as an escalation in the trade war. By our reckoning, the upshot is actually an effective tariff rate of 18%. That is the midpoint between the 16% rate in place prior to yesterday’s announcement and the roughly 20% rate that would have been in effect today in the absence of it.
Can You Keep Up?
Yesterday evening President Trump announced updated tariff rates of 10-41% on over 60 countries. This comes after Trump twice paused higher reciprocal rates originally announced in early April to allow for negotiations. Yesterday's announcement has been billed as a complete reshaping of global commerce, yet that is really not quite the way to think of this.
The reshaping already happened on April 2 when the President offered his opening bid in his campaign to force a new global trade system. The sweeping tariff orders announced yesterday effectively create a more practical framework and in many cases offer a lower tariff rate than would have been the case had things reset on August 1. Beyond the latest round of reciprocal rates, the Administration announced tariffs on copper products as well as a trade deal with the European Union and additional tariffs on Brazil this week. Yet, even with this latest codification of tariff rates, much remains in flux as deal-making continues and as the President continues to use tariffs for leverage in foreign affairs.
State of Play: What's in Effect and What Do we Know?
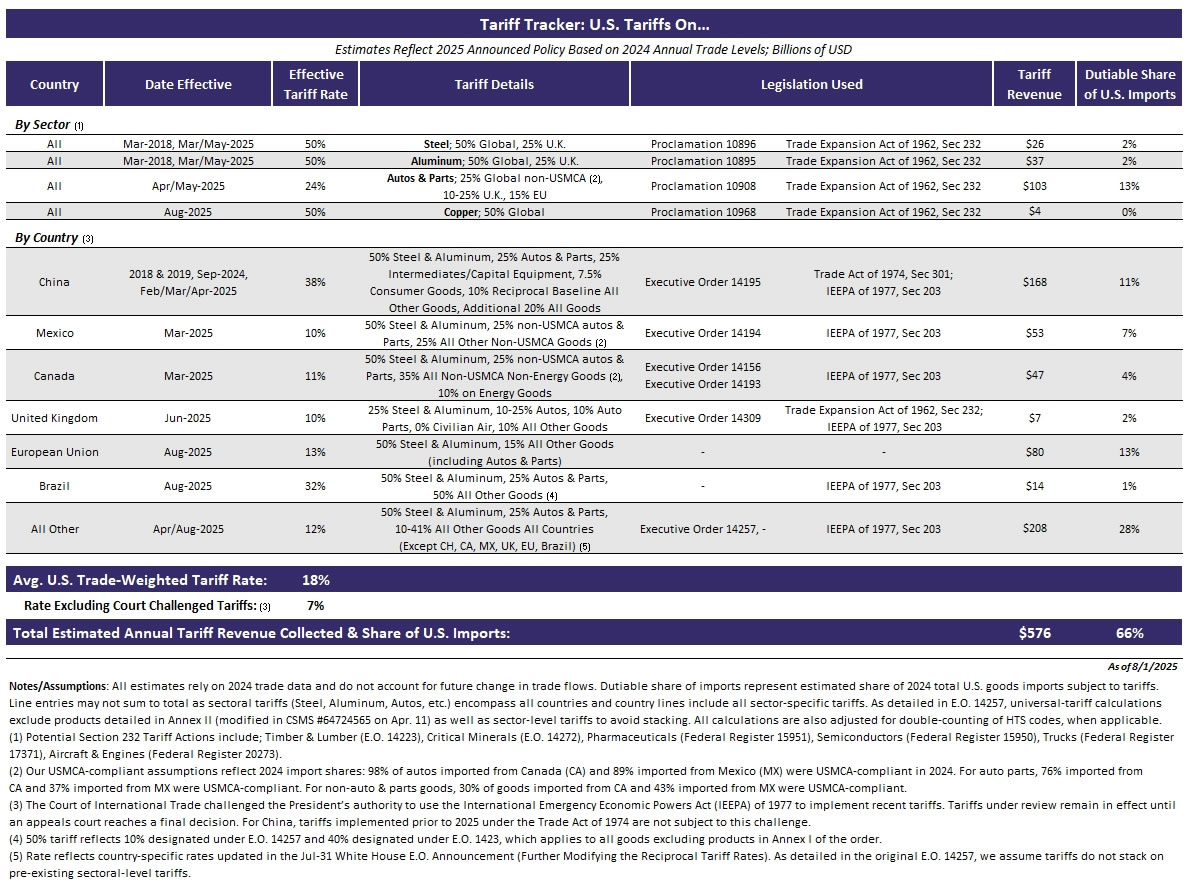
Here is a summary of the main tariff changes as of today, August 1:
- Copper: 50% on exposed copper products from every country (Effective August 1).
- Previously: 0%
- European Union: 50% on steel, aluminum, copper. 15% tariff on all other exposed goods (including autos & parts). Official Executive Order not yet available (Effective August 7).
- Previously: 50% on steel, aluminum. 0% copper. 25% autos & parts. 10% tariff on all other goods.
- Brazil: 50% steel, aluminum, copper. 25% autos & parts. 50% all other exposed goods (Effective August 1).
- Previously: 50% on steel, aluminum. 0% copper. 25% autos & parts. 10% all other goods and additional 40% all goods.
- All countries, other than China, Canada, Mexico: 50% on steel, aluminum, copper. 25% autos & parts. 10-41% on all other exposed goods (Effective August 7).
- Previously: 50% on steel, aluminum. 0% copper. 25% autos & parts. 10% on all other goods.
Nailing down the precise effective tariff rate in such an ever-changing environment is a never-ending task for economists and trade experts and a source of enduring uncertainty for businesses weighing cap-ex decisions. We estimate that once all these recent changes to tariff policy go into effect, it will lift the average trade-weighted tariff rate to ~18% in the United States, from 16% prior to these adjustments (chart). Despite the August 1 deadline bringing clarity for some countries, the can was kicked down the road for others such as China and Mexico. Trump extended the 90-day pause on China and imposed a similar pause on Mexico, making the start of November another key deadline.
Despite recent announcements, uncertainty lingers. The higher reciprocal rates are also not set to go into effect until next week on August 7, which leaves some time for potential changes to be made. There is also a grace period for product in shipment, meaning goods shipped within the next seven days and entering the country ahead of October 5 will be tariffed at the previous lower 10% rate. This could push firms that rely on goods from countries where rates have risen most dramatically, such as Switzerland and India, to rush and get orders shipped, which could again lead to a spurt of import growth and also delay any potential pricing impact from the escalation.
Another extension to the 90-day pause on higher reciprocal rates with China has also been floated by U.S. Treasury Secretary Scott Bessent this week, but Trump has not yet formally confirmed this. Additionally, while the Administration released a Fact Sheet on the trade deal with the European Union, it has not yet released a formal executive order, leaving some of the exact details of the deal unclear. This not only breeds confusion for businesses determining what rates their products are now exposed to, but prevents U.S. Customs and Border Protection from being able to accurately enforce tariff rates.
Summary of the pending changes:
- China: 90-day pause on higher reciprocal tariff extended (through October). No change to existing tariffs.
- Mexico: 90-day pause on higher reciprocal tariff (through October). No change to existing tariffs.
- Section 232 Tariffs: Investigations into Timber & Lumber (investigation started Mar-2025), Critical Minerals (Apr-2025), Pharmaceuticals (Apr-2025), Semiconductors (Apr-2025), Trucks (Apr-2025), and Aircrafts & Engines (May-2025) are ongoing. No tariffs added.
- Legal Authority: The tariffs Trump imposed under the International Emergency Economic Powers Act (IEEPA), which includes country-specific tariffs related to Fentanyl, immigration and trade-deficits, are being reviewed by a federal appeals court. In a hearing Thursday, media reports suggest judges express skepticism that the IEEPA gives the President such broad authority when it comes to imposing tariffs. It remains to be seen how the case is eventually decided, and these tariffs will remain in effect until a ruling is made, but if they are determined illegal, tariffs paid would be refunded.
We include all of this in our updated Tariff Tracker below, and as always will continue to update it as the details become available. Ultimately once you get past a certain threshold, the rejiggering of rates doesn't matter all that much at the macro level unless you adjust your major partners: China, Mexico, Canada and the European Union, which together accounted for around 60% of total U.S. imports last year.
As such, we'll be paying close attention to any adjustments to these partners. Where tariffs settle on China, for example, will be one of the biggest determinants of the average U.S. effective rate and how much revenue is ultimately raised through tariffs due to how much we import from the country. But given how elevated tariffs already are on the country, we expect it has already disincentivized import demand.
Section 232 tariffs also have our attention, though they come with a little more lead time. Unlike tariffs under the IEEPA, sector-level tariffs are implemented with Section 232 of the Trade Expansion Act of 1962, which requires an investigation and public comment period. It also means the legal-authority of these tariffs isn't currently being debated, meaning firms may be viewing them as more lasting. The investigation for the copper tariffs that went into effect today began in February, providing a six-month lead time. Most other investigations began in April, suggesting a bit more time before we see the results of those investigations. Tariffs on pharmaceutical products are getting a lot of attention given recent comments from Trump that they are coming. Even though the U.S. and the European Union have reached a trade agreement, that doesn't mean Europe is now safe from additional tariffs and pharmaceuticals in particular would sting given the large amount of product we bring in from the region.
While many economic indicators have revealed only a benign impact from tariffs so far, we have been arguing that the negative impacts of the tariffs are hiding in plain sight. Consumers have cutback on discretionary spending, and the soft July jobs report confirmed the concerns we have been articulating. To the degree that more negative news piles up, there is apt to be growing political pressure to back off from some of the more aggressive aspects of tariff policies.
Markets Weekly Outlook – US Services PMI, Bank of England Rate Decision and Canadian/NZ Employment
Week in review: Volatile week between Trade Deals, the FOMC Meeting and the Non-Farm Payrolls report
The week kicked off with a risk-positive tone as headlines around a Euro–US trade breakthrough triggered a sharp gap higher in global markets. As a result, the US Dollar caught a strong bid, with the Euro and Yen notably losing ground amid improving US trade positioning and capital rotation into USD assets.
Midweek, the FOMC held rates steady as expected, but the tone was less dovish than markets hoped. With no signal for a September cut, rate futures quickly repriced, sending the Dollar even higher and pressuring risk assets globally. The move extended a USD run that was already in motion.
The Dollar Index, which touched 97.20 last Wednesday, ripped through the 100 handle, peaking near 100.20 by Friday morning. That strength started to shake broader markets, especially in FX, commodities, and rate-sensitive sectors.
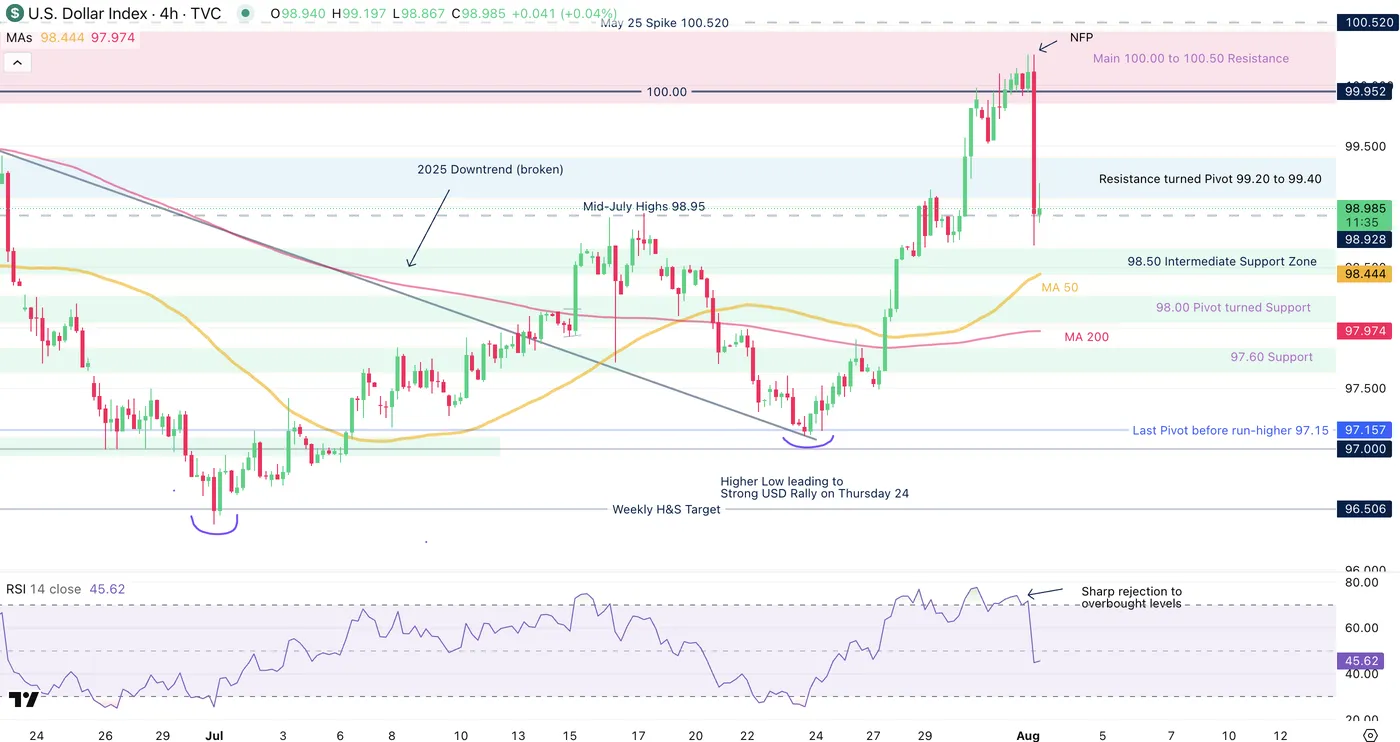
Dollar Index 4H Chart, August 1, 2025 – Source: TradingView
Then came the NFP report. A messy release with mixed revisions sent shockwaves across asset classes.
Bonds and gold rallied hard on safe-haven flows, while equities took a hit as traders digested the combo of slowing growth and hawkish policy repricing.
It seems that the Goldilocks conditions for stocks have found some resistance.
Earnings Season
The strong Earnings season kept on providing good results, with notable tenace releases from 4 of the Magnificent 7 including Amazon, Apple, Meta and Microsoft.
This has kept boosting the Nasdaq and S&P 500 towards their most recent all-time highs before the mood got dampened by this morning's data.
The Week Ahead: Less market-moving than last week, but emphasis on US Services PMIs and the Bank of England rate decision
Last week was a composed salad of key data, particularly for the US – Between ADP employment, the July FOMC, GDP, Core PCE, and finally this morning’s NFP.
Now, Markets are on edge going into the weekend after a reality check that things are not all so easy in the end. Firms face the consequences of the Trump Administration’s policies, which will keep influencing the data as the August 1 deadline bell rings.
Asia Pacific Markets - US/China Trade Talks pursue, NZ employment data
This week saw the further pushback of US-China trade talks for 90 more days, leaving Markets awaiting again for more concrete developments between the Strongest nation and the World's largest manufacturer.
In terms of key data for APAC nations, we will be expecting the Caixin Services PMIs (Monday evening) and the Inflation Data (Friday evening) from the Middle Kingdom.
NZD traders will await their Employment numbers on Tuesday end-afternoon and some more key releases with Wednesday's RBNZ Inflation Expectations survey for Q3.
AUD traders will also have to attentive to the Australian trade balance numbers, also releasing on Wednesday evening.
Economic Data from Europe, UK and the US
The EU will not provide much high-tier data for Markets, so traders will have to look elsewhere for Euro movement – Focus on US Dollar demand (or lack thereof) if you want to get a clear picture of FX flows.
For the US, the most important data of the week is expected on Tuesday at 10:00 A.M. with the ISM Services PMI release (consensus 51.5, previous 50.8).
The Bank of England notably releases their rate decision on Thursday August 7th morning, with a cut from 4.25% to 4% largely expected.
CAD traders will have to take a look for three important data points next week: the Canadian Trade Balance (releasing on Tuesday), both Services and Manufacturing PMIs releasing on Wednesday and finally, the Canadian Employment data on Friday.
Don't forget the key Earnings that Equity markets are awaiting with names like Mcdonald's, Palantir, Disney and Pfizer.
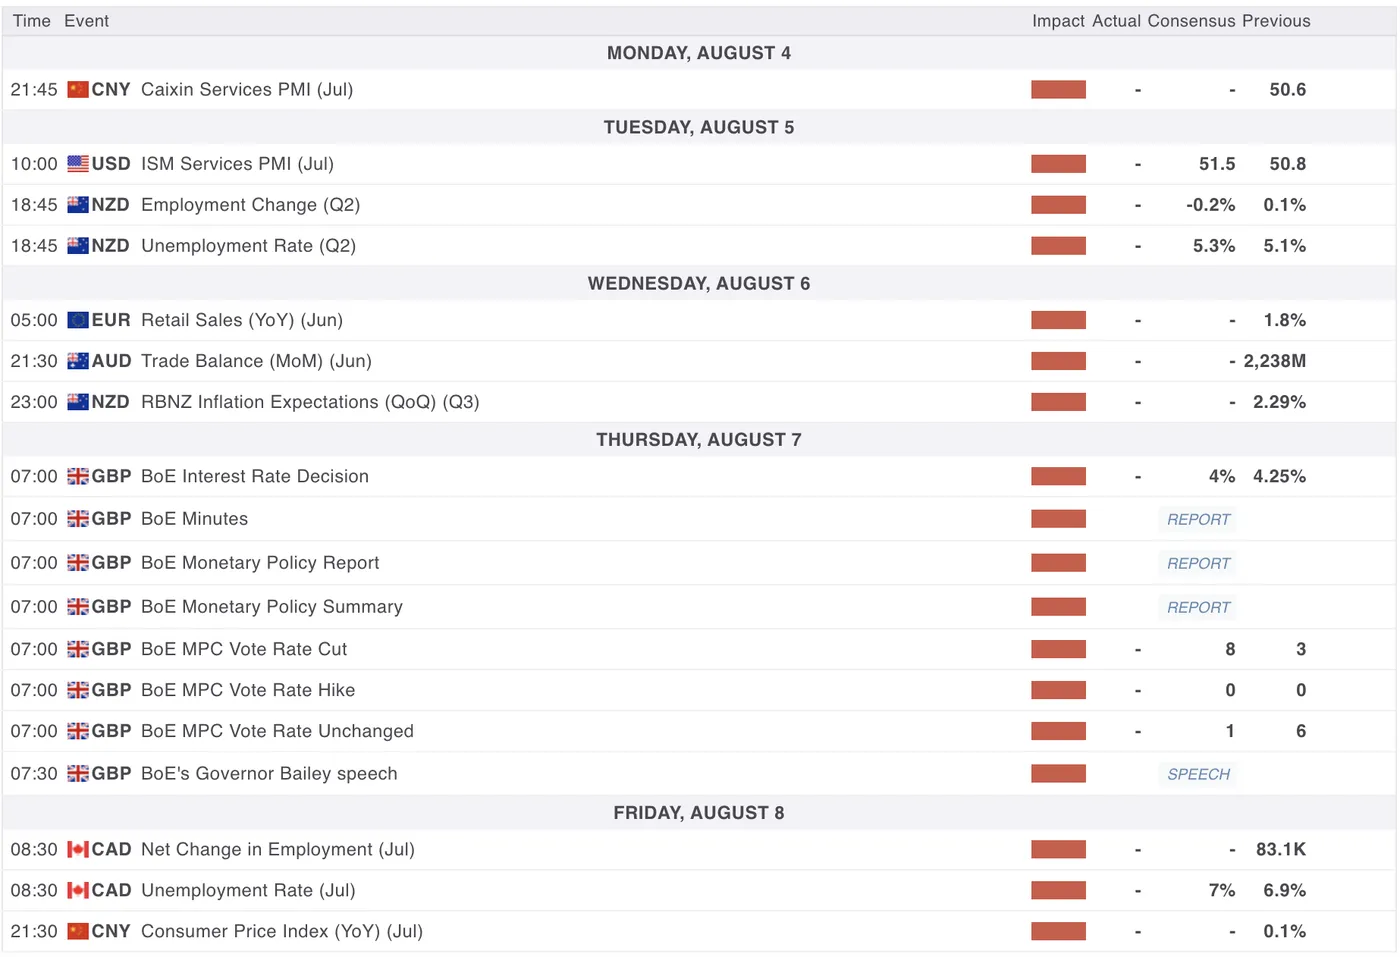
For all market-moving economic releases and events, see the MarketPulse Economic Calendar. (High-tier data only)
Safe Trades and enjoy your weekend as next week should be another rollercoaster!