Sample Category Title
The Weekly Bottom Line: Trade Deals Trickle in Ahead of August 1st
Canadian Highlights
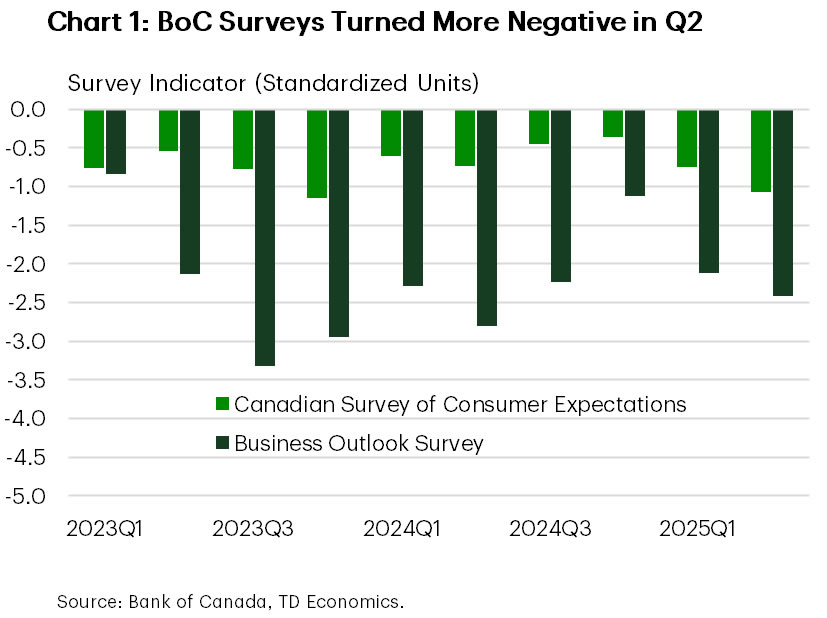
- This week offered a clearer picture of business and consumer sentiment. Both surveys turned more negative in Q2, with domestic demand expected to remain soft and investment outlook flashing a weak signal for Q3.
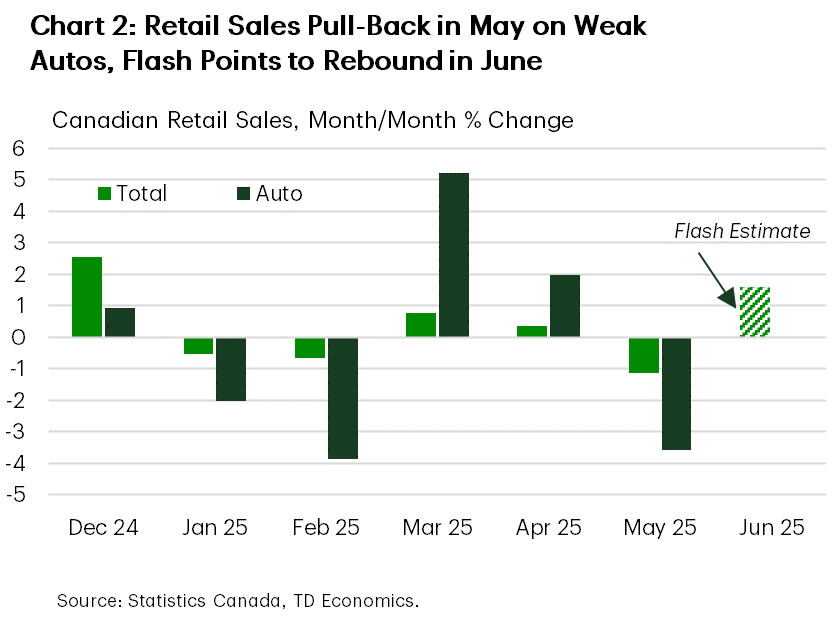
- The retail sales report showed a sharp pull-back in May spending, led by autos. The advance estimate for June suggests a rebound, likely keeping quarterly goods spending steady overall.
- Longer-term consumer inflation expectations ticked slightly higher, though are unlikely to cause much concern for the BoC. July’s rate decision is essentially locked in as a hold – the real question is whether the Bank stays on hold in September and beyond.
U.S. Highlights
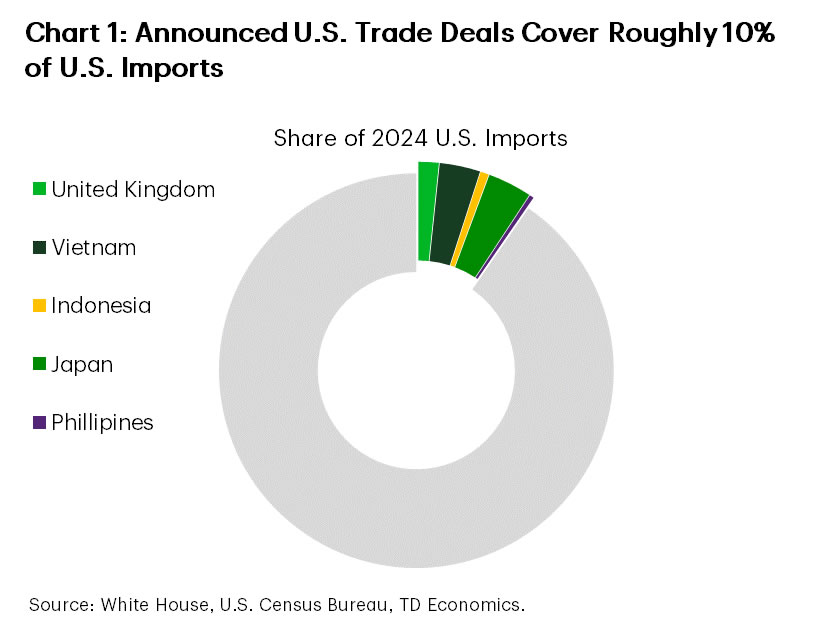
- President Trump announced a few trade deals this week, most importantly with Japan. Under this “deal” Japanese imports will still face a 15% “reciprocal” tariff, which is lower than the 25% threatened in the past. The deal included a $550 billion Japanese investment package, but the details remain scarce.
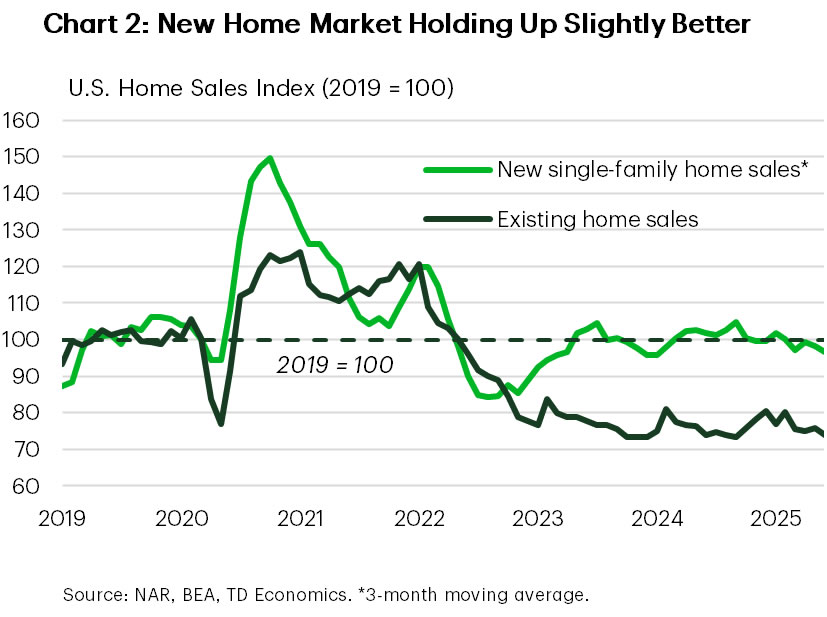
- Existing home sales weakened more than expected in June, with the level of sales holding near GFC lows. However, median home prices rose 2.0% y/y, a slight improvement from the month prior.
Canada – Not Strong Enough to Cheer, Not Weak Enough to Cut
This week’s economic calendar wasn’t expected to move markets. Equity markets drifted higher on optimism around U.S. trade deals, while bond yields edged up modestly after falling for most of the week.
Instead, the data offered a clearer picture of business and consumer sentiment, along with a detailed look at May’s retail spending. Both the business and consumer surveys turned more negative in Q2, reversing the cautious optimism that had emerged late last year (Chart 1). However, the interviews, conducted from late April through May, came after the temporary relief was granted to CUSMA-compliant trade, which helped ease some pressure. Recession fears among firms and households ticked lower, and businesses reported modest improvement in some areas affected by trade.
Despite easing recession fears, the tone from businesses was far from upbeat. Domestic demand is expected to stay soft. Firms’ future sales expectations turned negative for the first time in a year. The outlook for exports sales improved for all but the manufacturing and auto-related sectors. The investment outlook, while slightly better than last quarter, remains well below average and just a quarter of where it stood in late 2024. Even then, most firms are sticking to routine maintenance rather than expanding capacity or improving productivity – a weak signal for the third quarter investment outlook.
On the consumer side, the Bank’s new sentiment index showed a second straight quarterly decline, reflecting slowing spending growth. That was confirmed by May’s retail sales report, which showed nominal spending down 1.1% and inflation-adjusted spending down 1.4% month-on-month. The sharp pull-back was led by auto sales, as the tariff-driven front-loading in March and April reversed course (Chart 2). Core sales, which excludes auto sales and receipts at gas stations, were flat in nominal and real terms. The flash estimate for June sales points to a rebound, which could keep quarterly goods spending steady overall. But services will determine the broader trajectory of personal consumption – and if consumers act on what they are saying in the survey, it will likely remain subdued.
Meanwhile, longer-term consumer inflation expectations ticked slightly higher, though are unlikely to cause much concern for the Bank of Canada. Firms also expect somewhat stronger input costs due to tariffs, though most say that they’ll absorb them through profit margins given weak demand. Services inflation remains the sticking point. According to CMHC, new rents are falling thanks to increased supply. However, existing rent inflation remains elevated, even as it has slowed relative to last year.
In short, the data doesn’t signal a collapse, but it doesn’t suggest strength either. This week’s releases don’t shift the dial for the Bank with July’s rate decision now essentially locked in – the employment report sealed a hold. The real question now is whether it stays on hold in September and beyond. For now, markets are only pricing in half a cut by year-end.
U.S. – Trade Deals Trickle in Ahead of August 1st
This fourth week of July was light on the data front, with only housing data on the docket. Trade developments continued to dominate the limelight, with trade “deals” announced with Japan, the Philippines and Indonesia. Progress on the trade front appeared to prop up financial markets, with the S&P 500 up 1.3% on the week.
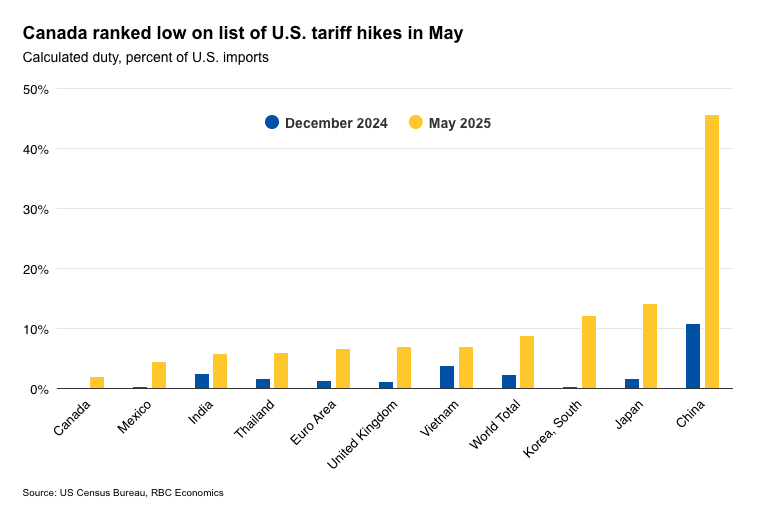
U.S.-Japan goods trade is worth about $227 billion, so a trade deal is certainly a welcome development. Imports from Japan ($148.4 billion last year) will now face a 15% so-called reciprocal tariff, which is lower than the 25% that had been threatened in the past. The deal also reportedly included a $550 billion Japanese investment package, but the fine details on it remain scarce. Shares of Japanese carmakers rose on the news, but the largest American carmakers expressed concern that the deal could put them at a disadvantage. The trade deal with the Philippines received less attention. Imports from the Philippines will face a slightly higher tariff of 19%, slightly higher than the 17% announced on Liberation Day. This adds to a string of recent agreements, including those with the U.K., Vietnam and Indonesia (Chart 1). But the more important ones, such as those with China, Canada, Mexico and the EU, have yet to be reached.
On the data front, the housing market continues to struggle under the weight of high mortgage rates. Existing home sales fell 2.7% m/m in June, coming in well-below expectations for a lighter pullback. Sales were down 8% from the end of last year and at a level of 3.93 million (seasonally adjusted annual rate) continued to hover near GFC lows. The months’ supply of inventory improved slightly, coming in at a seasonally adjusted 4.4 months from 4.3 in May. Amidst this backdrop, home price growth remained in the slow lane, but did see a modest improvement, rising to 2.0% year-on-year (y/y) from 1.6% in the month prior. With mortgage rates holding stubbornly near 7%, we’re unlikely to see a sustained turnaround in resale activity over the near-term. An improved interest rate backdrop expected later this year should help at the margin. High mortgage rates also continue to take a toll on the new home market, even as activity in this small corner of housing is holding up slightly better, with builder incentives likely providing some modest support (Chart 2).
Next week is sure to be more action packed. Aside from the potential for more trade deals to emerge ahead of Trump’s August 1st deadline, a host of important data reports are slated to be released next week. This includes second-quarter GDP, June’s PCE inflation, the July jobs report, and an FOMC rate-setting meeting. Market odds suggest the Fed is all but certain to keep the policy rate unchanged next week. That said, it appears that there will be at least one dissenter among the voters with Fed Gov. Waller recently urging for a July cut, while Fed Gov. Bowman has also expressed her openness to this. Signs of a growing divide within the Fed could lead to more volatility. In this vein, next week’s FOMC decision will be parsed over thoroughly for any of these signs and any potential clues as to how soon the committee could begin cutting rates, with September our current base case.
Weekly Economic & Financial Commentary: To Cut or Not to Cut?
Summary
United States: The Week Data Converged to Reveal a Clear Slowing in Activity
- Roughly four months since Liberation Day and after a run of broadly benign initial readings on the economy, data this week revealed broad and unambiguous signals that growth has slowed markedly in the first half of the year.
- Next week: Trade Balance (Tues.), ISM Services (Tues.)
International: Foreign Central Banks at the Forefront
- Foreign central banks were at the forefront this week. Central banks in Japan, Canada, Brazil, Colombia and Singapore held monetary policy steady, while central banks in Chile and South Africa all delivered 25 bps policy rate cuts. In economic data, Eurozone Q2 GDP was firmer than expected, edging up 0.1% quarter-over-quarter, while July core inflation was steady at 2.3% year-over-year. China's July PMIs softened, suggesting slower growth over the second half of this year.
- Next week: NZ Labor Market Data (Wed.), Bank of England Policy Rate (Thu.), Banxico Policy Rate (Thu.)
Interest Rate Watch: To Cut or Not to Cut?
- As widely expected, the FOMC left the fed funds rate unchanged at the conclusion of its meeting on Wednesday. The Committee has now held the policy rate steady at 4.25%-4.50% for five consecutive meetings. A cut at the FOMC's next meeting in September is still up in the air, and upcoming economic data will be critical in determining the future path of monetary policy.
Credit Market Insights: Signs of Consumer Caution in Credit Card Borrowing
- Household finances are looking stronger than they have, but consumers aren't celebrating just yet. While debt levels are cooling and balance sheets are improving, rising savings and lingering uncertainty hint at a more cautious, uneven path ahead for spending.
Topic of the Week: Housing Prices Fall but Affordability Contracts
- Housing affordability remains under pressure despite recent declines in home prices. Although prices have softened slightly, elevated mortgage rates and rising ownership costs—including insurance, taxes and maintenance—continue to make homeownership unaffordable for many families. The Atlanta Fed reports that owning a median-priced home now consumes 53% of median household income, the highest on record.
CUSMA Exemption Holds Up Despite Latest U.S. Tariff Hike; Canada’s Jobs to Show Stabilization
Tariffs on Canadian goods announced by the U.S. on July 31 do not significantly alter Canada’s economic outlook.
The International Emergency Economic Powers Act (IEEPA) tariff increased from 25% to 35%, but still only applies to the portion of trade that is not compliant with the free trade CUSMA/USMCA. That exemption is maintaining duty free access to the U.S. market for the majority of Canadian exports by our calculations, and remains in place.
Overnight tariffs hikes on other countries will still push the effective U.S. tariff rate higher to the top end of the 10-15% range that we have been assuming for our base case outlook.
This outcome, while impactful, remains less severe than the more negative scenarios that appeared more possible earlier this year. Canada should maintain among the lowest (if not the lowest) effective tariff rate of any major U.S. trade partner under the updated rules.
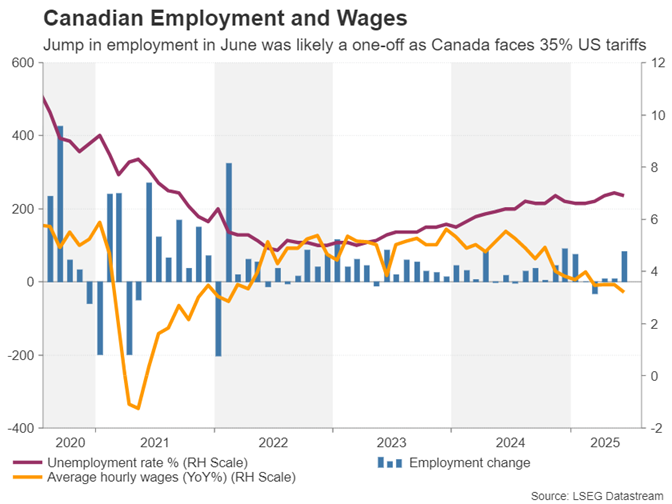
Canadian labour markets to show further signs of resilience
We expect employment and the unemployment rate ticked higher in July after an outsized 83,100 jobs’ gain in June pushed the unemployment rate unexpectedly lower.
One upside surprise in employment doesn’t negate months of prior softening, and the 6.9% unemployment rate in June was still up half a percent from a year ago, and is historically elevated.
The nuance is that much of the deterioration in the labour market had been concentrated in goods-producing industries, particularly manufacturing, which has lost jobs from international trade headwinds. Meanwhile, services sectors have been broadly resilient, accounting for nearly all of the job growth in Canada since last summer.
We expect this bifurcation to continue, resulting in modest job growth in July with the unemployment rate edging slightly higher to 7%. Education is a sector to keep an eye on as seasonal patterns around summer can create volatility. Beyond July, we believe deterioration in the labour market is likely approaching a bottom if it hasn’t already.
That outlook is contingent on the assumption of limited additional erosion in trade relations between Canada and the U.S. Evidence has been mounting, including from Statistics Canada’s early Q2 gross domestic product estimates, that existing U.S. tariffs on Canada are having a less severe impact than initially feared.
Exports to tick higher on oil price surge
But, that doesn’t mean tariffs aren’t damaging trade. June’s international trade data on Tuesday is expected to show Canadian exports ticked higher, but only due to a 10% jump in oil prices.
Export volumes likely declined again after accounting for the price changes, consistent with another significant drop in U.S. imports. Nevertheless, we expect those exports were still subject to lower average U.S. tariffs compared to exports from other major U.S. trade partners.
Negotiation between Canada and the U.S. on a trade deal is ongoing and the outcome is uncertain. But we expect growth in the economy will stay soft, but positive, and the Bank of Canada is not expected to cut interest rates again.
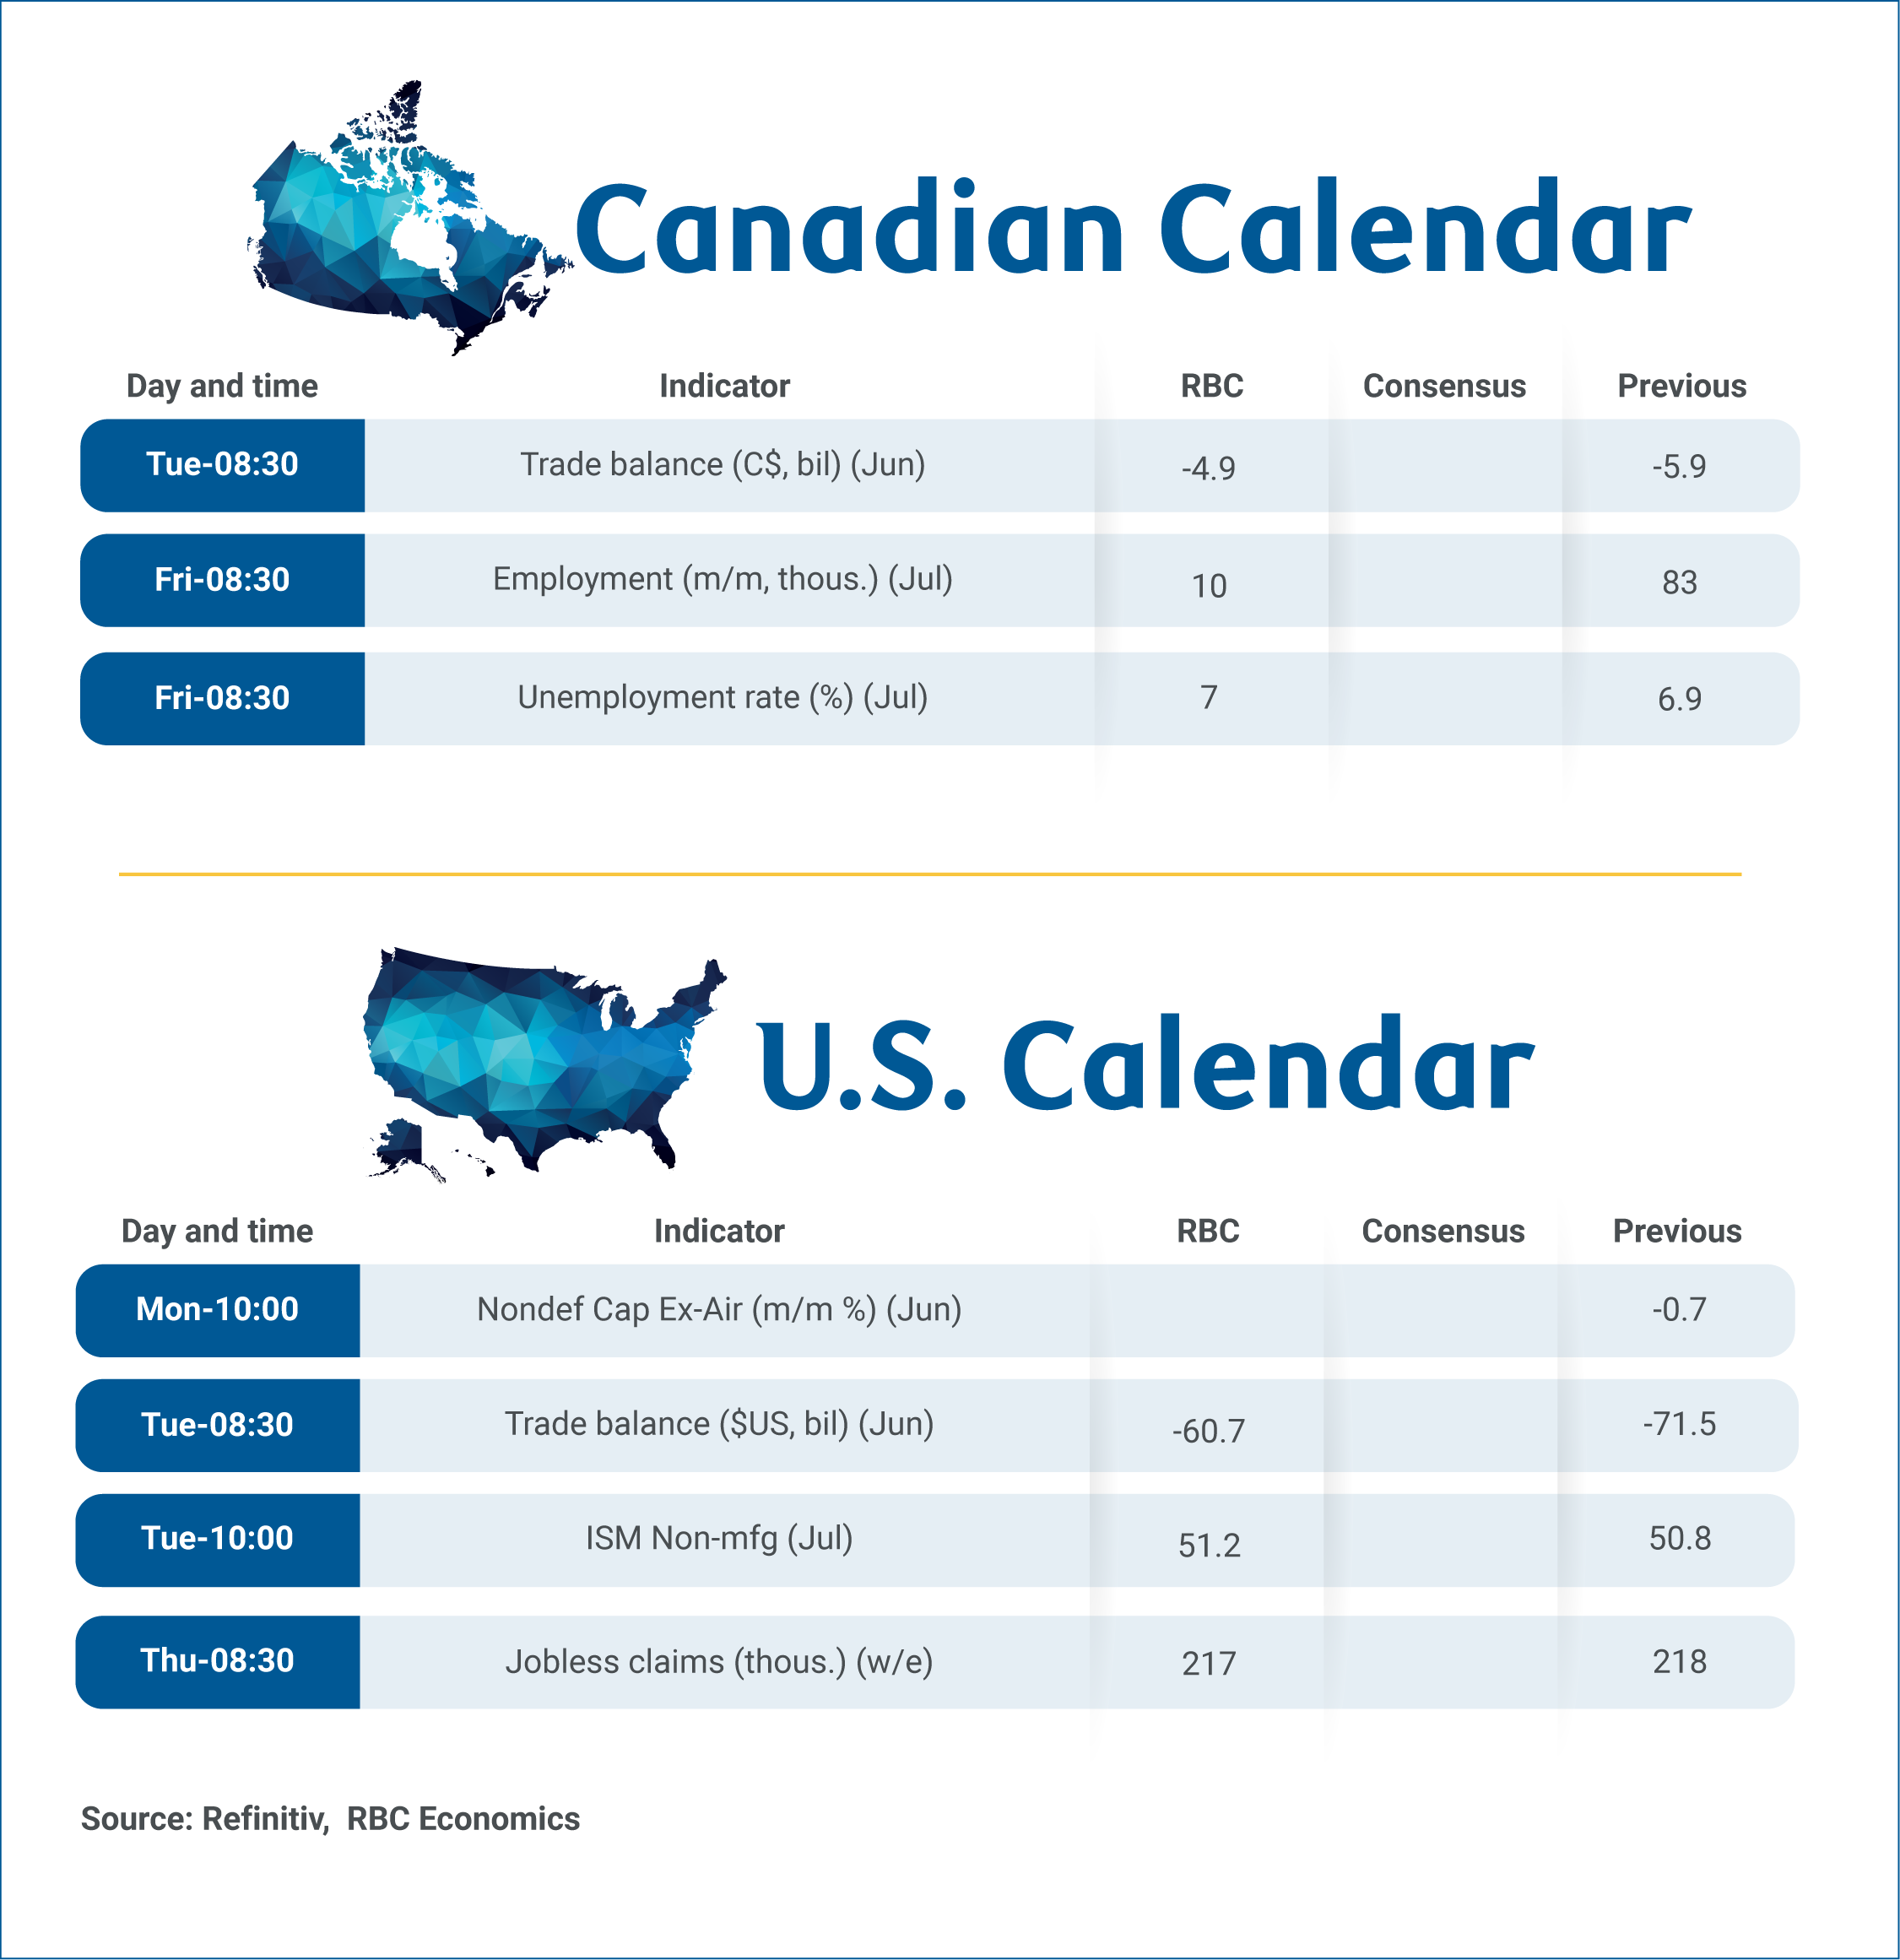
Week ahead data watch:
In Canada, we anticipate the trade deficit narrowed to $4.9 billion in June. Export growth was likely supported by higher oil prices. Meanwhile, a decline in motor vehicle unit production likely restrained import growth once again.
In the U.S., the trade deficit is expected to be about US$60.7 billion in June. Based on advance economic indicators, the goods trade deficit narrowed by 10.8% with both goods exports and imports declining by 0.6% and 4.2%, respectively.
Summary 8/4 – 8/8
Monday, Aug 4, 2025
| GMT | Ccy | Events | Consensus | Previous |
|---|---|---|---|---|
| 23:50 | JPY | Monetary Base Y/Y Jul | -2.80% | -3.50% |
| 01:00 | AUD | TD-MI Inflation Gauge M/M Jul | 0.10% | |
| 06:30 | CHF | CPI M/M Jul | -0.20% | 0.20% |
| 06:30 | CHF | CPI Y/Y Jul | 0.10% | 0.10% |
| 07:30 | CHF | Manufacturing PMI Jul | 49.9 | 49.6 |
| 08:30 | EUR | Eurozone Sentix Investor Confidence Aug | 6.2 | 4.5 |
| 14:00 | USD | Factory Orders M/M Jun | -5.20% | 8.20% |
| 23:50 | JPY | BoJ Minutes |
| GMT | Ccy | Events | |
|---|---|---|---|
| 23:50 | JPY | Monetary Base Y/Y Jul | |
| Forecast: -2.80% | Previous: -3.50% | ||
| 01:00 | AUD | TD-MI Inflation Gauge M/M Jul | |
| Forecast: | Previous: 0.10% | ||
| 06:30 | CHF | CPI M/M Jul | |
| Forecast: -0.20% | Previous: 0.20% | ||
| 06:30 | CHF | CPI Y/Y Jul | |
| Forecast: 0.10% | Previous: 0.10% | ||
| 07:30 | CHF | Manufacturing PMI Jul | |
| Forecast: 49.9 | Previous: 49.6 | ||
| 08:30 | EUR | Eurozone Sentix Investor Confidence Aug | |
| Forecast: 6.2 | Previous: 4.5 | ||
| 14:00 | USD | Factory Orders M/M Jun | |
| Forecast: -5.20% | Previous: 8.20% | ||
| 23:50 | JPY | BoJ Minutes | |
| Forecast: | Previous: | ||
Tuesday, Aug 5, 2025
| GMT | Ccy | Events | Consensus | Previous |
|---|---|---|---|---|
| 00:30 | JPY | Services PMI Jul F | 53.5 | 53.5 |
| 01:45 | CNY | Caixin Services PMI Jul | 50.4 | 50.6 |
| 06:45 | EUR | France Industrial Output M/M Jun | 0.80% | -0.50% |
| 07:50 | EUR | France Services PMI Jul F | 49.7 | 49.7 |
| 07:55 | EUR | Germany Services PMI Jul F | 50.1 | 50.1 |
| 08:00 | EUR | Eurozone Services PMI Jul F | 51.2 | 51.2 |
| 08:30 | GBP | Services PMI Jul F | 51.2 | 51.2 |
| 09:00 | EUR | Eurozone PPI M/M Jun | 0.90% | -0.60% |
| 09:00 | EUR | Eurozone PPI Y/Y Jun | 0.30% | |
| 12:30 | CAD | Trade Balance (CAD) Jun | -5.8B | -5.9B |
| 12:30 | USD | Trade Balance (USD) Jun | -62.6B | -71.5B |
| 13:45 | USD | Services PMI Jul F | 55.2 | 55.2 |
| 14:00 | USD | ISM Services PMI Jul | 51.5 | 50.8 |
| 22:45 | NZD | Employment Change Q2 | -0.10% | 0.10% |
| 22:45 | NZD | Unemployment Rate Q2 | 5.30% | 5.10% |
| 22:45 | NZD | Labour Cost Index Q/Q Q2 | 0.50% | 0.40% |
| 23:30 | JPY | Labor Cash Earnings Y/Y Jun | 3.20% | 1.40% |
| GMT | Ccy | Events | |
|---|---|---|---|
| 00:30 | JPY | Services PMI Jul F | |
| Forecast: 53.5 | Previous: 53.5 | ||
| 01:45 | CNY | Caixin Services PMI Jul | |
| Forecast: 50.4 | Previous: 50.6 | ||
| 06:45 | EUR | France Industrial Output M/M Jun | |
| Forecast: 0.80% | Previous: -0.50% | ||
| 07:50 | EUR | France Services PMI Jul F | |
| Forecast: 49.7 | Previous: 49.7 | ||
| 07:55 | EUR | Germany Services PMI Jul F | |
| Forecast: 50.1 | Previous: 50.1 | ||
| 08:00 | EUR | Eurozone Services PMI Jul F | |
| Forecast: 51.2 | Previous: 51.2 | ||
| 08:30 | GBP | Services PMI Jul F | |
| Forecast: 51.2 | Previous: 51.2 | ||
| 09:00 | EUR | Eurozone PPI M/M Jun | |
| Forecast: 0.90% | Previous: -0.60% | ||
| 09:00 | EUR | Eurozone PPI Y/Y Jun | |
| Forecast: | Previous: 0.30% | ||
| 12:30 | CAD | Trade Balance (CAD) Jun | |
| Forecast: -5.8B | Previous: -5.9B | ||
| 12:30 | USD | Trade Balance (USD) Jun | |
| Forecast: -62.6B | Previous: -71.5B | ||
| 13:45 | USD | Services PMI Jul F | |
| Forecast: 55.2 | Previous: 55.2 | ||
| 14:00 | USD | ISM Services PMI Jul | |
| Forecast: 51.5 | Previous: 50.8 | ||
| 22:45 | NZD | Employment Change Q2 | |
| Forecast: -0.10% | Previous: 0.10% | ||
| 22:45 | NZD | Unemployment Rate Q2 | |
| Forecast: 5.30% | Previous: 5.10% | ||
| 22:45 | NZD | Labour Cost Index Q/Q Q2 | |
| Forecast: 0.50% | Previous: 0.40% | ||
| 23:30 | JPY | Labor Cash Earnings Y/Y Jun | |
| Forecast: 3.20% | Previous: 1.40% | ||
Wednesday, Aug 6, 2025
| GMT | Ccy | Events | Consensus | Previous |
|---|---|---|---|---|
| 06:00 | EUR | Germany Factory Orders M/M Jun | 1.00% | -1.40% |
| 08:30 | GBP | Construction PMI Jul | 49.2 | 48.8 |
| 09:00 | EUR | Eurozone Retail Sales M/M Jun | 0.40% | -0.70% |
| 14:30 | USD | Crude Oil Inventories | 7.7M |
| GMT | Ccy | Events | |
|---|---|---|---|
| 06:00 | EUR | Germany Factory Orders M/M Jun | |
| Forecast: 1.00% | Previous: -1.40% | ||
| 08:30 | GBP | Construction PMI Jul | |
| Forecast: 49.2 | Previous: 48.8 | ||
| 09:00 | EUR | Eurozone Retail Sales M/M Jun | |
| Forecast: 0.40% | Previous: -0.70% | ||
| 14:30 | USD | Crude Oil Inventories | |
| Forecast: | Previous: 7.7M | ||
Thursday, Aug 7, 2025
| GMT | Ccy | Events | Consensus | Previous |
|---|---|---|---|---|
| 01:30 | AUD | Trade Balance (AUD) Jun | 3.25B | 2.24B |
| 03:00 | CNY | Trade Balance (USD) Jul | 107.9B | 114.8B |
| 03:00 | NZD | RBNZ Inflation Expectations Q3 | 2.29% | |
| 05:00 | JPY | Leading Economic Index Jun P | 104.8 | |
| 06:00 | EUR | Germany Industrial Production M/M Jun | -0.60% | 1.20% |
| 06:00 | EUR | Germany Trade Balance (EUR) Jun | 18.3B | 18.4B |
| 06:45 | EUR | France Trade Balance (EUR) Jun | -7.5B | -7.8B |
| 07:00 | CHF | Foreign Currency Reserves (CHF) Jul | 713B | |
| 07:00 | CHF | Unemployment Rate Jul | 2.90% | 2.90% |
| 08:00 | EUR | ECB Economic Bulletin | ||
| 11:00 | GBP | BoE Interest Rate Decision | 4.00% | 4.25% |
| 11:00 | GBP | MPC Official Bank Rate Votes | 0--8--1 | 0--3--6 |
| 12:30 | USD | Initial Jobless Claims (Aug 1) | 220K | 218K |
| 12:30 | USD | Nonfarm Productivity Q2 P | 1.90% | -1.50% |
| 12:30 | USD | Unit Labor Costs Q2 P | 1.40% | 6.60% |
| 14:00 | USD | Wholesale Inventories Jun F | 0.20% | 0.20% |
| 14:00 | CAD | Ivey PMI Jul | 55.2 | 53.3 |
| 14:30 | USD | Natural Gas Storage | 48B | |
| 23:30 | JPY | Household Spending Y/Y Jun | 2.80% | 4.70% |
| 23:50 | JPY | Bank Lending Y/Y Jul | 2.70% | 2.80% |
| 23:50 | JPY | BoJ Summary of Opinions | ||
| 23:50 | JPY | Current Account (JPY)) Jun | 2.76T | 2.82T |
| GMT | Ccy | Events | |
|---|---|---|---|
| 01:30 | AUD | Trade Balance (AUD) Jun | |
| Forecast: 3.25B | Previous: 2.24B | ||
| 03:00 | CNY | Trade Balance (USD) Jul | |
| Forecast: 107.9B | Previous: 114.8B | ||
| 03:00 | NZD | RBNZ Inflation Expectations Q3 | |
| Forecast: | Previous: 2.29% | ||
| 05:00 | JPY | Leading Economic Index Jun P | |
| Forecast: | Previous: 104.8 | ||
| 06:00 | EUR | Germany Industrial Production M/M Jun | |
| Forecast: -0.60% | Previous: 1.20% | ||
| 06:00 | EUR | Germany Trade Balance (EUR) Jun | |
| Forecast: 18.3B | Previous: 18.4B | ||
| 06:45 | EUR | France Trade Balance (EUR) Jun | |
| Forecast: -7.5B | Previous: -7.8B | ||
| 07:00 | CHF | Foreign Currency Reserves (CHF) Jul | |
| Forecast: | Previous: 713B | ||
| 07:00 | CHF | Unemployment Rate Jul | |
| Forecast: 2.90% | Previous: 2.90% | ||
| 08:00 | EUR | ECB Economic Bulletin | |
| Forecast: | Previous: | ||
| 11:00 | GBP | BoE Interest Rate Decision | |
| Forecast: 4.00% | Previous: 4.25% | ||
| 11:00 | GBP | MPC Official Bank Rate Votes | |
| Forecast: 0--8--1 | Previous: 0--3--6 | ||
| 12:30 | USD | Initial Jobless Claims (Aug 1) | |
| Forecast: 220K | Previous: 218K | ||
| 12:30 | USD | Nonfarm Productivity Q2 P | |
| Forecast: 1.90% | Previous: -1.50% | ||
| 12:30 | USD | Unit Labor Costs Q2 P | |
| Forecast: 1.40% | Previous: 6.60% | ||
| 14:00 | USD | Wholesale Inventories Jun F | |
| Forecast: 0.20% | Previous: 0.20% | ||
| 14:00 | CAD | Ivey PMI Jul | |
| Forecast: 55.2 | Previous: 53.3 | ||
| 14:30 | USD | Natural Gas Storage | |
| Forecast: | Previous: 48B | ||
| 23:30 | JPY | Household Spending Y/Y Jun | |
| Forecast: 2.80% | Previous: 4.70% | ||
| 23:50 | JPY | Bank Lending Y/Y Jul | |
| Forecast: 2.70% | Previous: 2.80% | ||
| 23:50 | JPY | BoJ Summary of Opinions | |
| Forecast: | Previous: | ||
| 23:50 | JPY | Current Account (JPY)) Jun | |
| Forecast: 2.76T | Previous: 2.82T | ||
Friday, Aug 8, 2025
| GMT | Ccy | Events | Consensus | Previous |
|---|---|---|---|---|
| 05:00 | JPY | Eco Watchers Survey: Current Jul | 45.5 | 45 |
| 07:00 | CHF | SECO Consumer Climate Q3 | -30 | -32 |
| 12:30 | CAD | Net Change in Employment Jul | 15.3K | 83.1K |
| 12:30 | CAD | Unemployment Rate Jul | 7.00% | 6.90% |
| GMT | Ccy | Events | |
|---|---|---|---|
| 05:00 | JPY | Eco Watchers Survey: Current Jul | |
| Forecast: 45.5 | Previous: 45 | ||
| 07:00 | CHF | SECO Consumer Climate Q3 | |
| Forecast: -30 | Previous: -32 | ||
| 12:30 | CAD | Net Change in Employment Jul | |
| Forecast: 15.3K | Previous: 83.1K | ||
| 12:30 | CAD | Unemployment Rate Jul | |
| Forecast: 7.00% | Previous: 6.90% | ||
New ECB Call: No Further Cuts in Scope
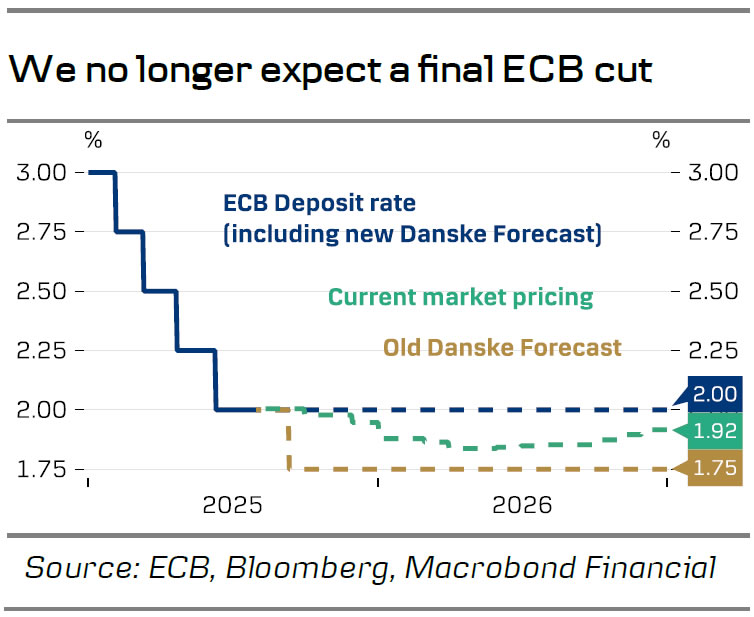
- We remove our previous call for a final September cut by the ECB and expect no further easing in 2025 and 2026, leaving a terminal deposit rate of 2.0%.
- The euro area economy has shown surprising resilience over the summer, with the outlook bolstered by the EU-US deal and accelerated German spending plans.
- Risks are still tilted towards a final cut later this year or in early 2026. Further softening of wage indicators could open the door for a final ‘insurance cut’
We revise our ECB call following the recent string of events, which have reduced the chances of a September cut substantially. We now expect the ECB to keep its policy rates unchanged throughout the entire 2025-26 forecast period. Markets discount roughly 12.5bp worth of ECB cuts by year-end. Previously, our main arguments for a final 25bp cut in September were 1) the elevated trade policy uncertainty, 2) the slowdown in domestic growth, and 3) the ongoing softening of wage growth. As we will elaborate below, trade policy and domestic growth arguments have lost considerable weight. Monetary policy is in a ‘good place’, and recent events have made it less likely ECB will conclude otherwise.
The European economy has proved surprisingly resilient to the elevated trade policy uncertainty that characterized the spring and early summer. Business confidence indicators have improved, and a declining euro area unemployment rate suggests that slack is still being depleted in the region. The US-EU trade deal has provided much-needed clarity, and the US tariff hike on European goods (roughly 10pp) fits well with the ECB baseline scenario from June. Even though we will eventually see some reversal effects of the heavy front-loading of goods in H1, the ECB will most likely interpret this as a temporary distortion without meaningful monetary policy implications.
Apart from trade policy, we have also revised our expected timeframe for the German fiscal policy boost. Earlier this week, the German cabinet agreed on a draft budget that will fast-track new public investments and a set of ‘growth booster’ initiatives, such as electricity tax cuts and accelerated depreciation rules for investments. Parliament will vote on the budget in September. If approved, the measures are set to drive up deficits as early as 2025. Even though the fiscal effect will likely not be felt before 2026, this is still a faster impact than previously assumed. Hence, the German fiscal boost risk coinciding with the lagged effects of the past year’s monetary policy easing, which will continue to strengthen.
Softening of inflationary forces leaves risks for policy rates tilted to the downside. Even though we are now calling for ECB policy rates to remain unchanged through 2025- 26, we still perceive the risk as being tilted to the downside. Euro area wage growth continues to moderate, and the most recent ECB tracker suggests that wage growth (including one-offs) is set to reach 1.7% y/y by Q1/2026. The July inflation report showed core services inflation declining to 3.1% y/y and the most recent momentum fell to the lowest since January, at 3.0% in the 3m/3m SAAR measure. Depending on the development in domestic inflation at the end of this year and the fiscal outlook by then, these factors could give room for taking rates slightly below neutral. However, based on Lagarde’s comments in the July meeting, more easing will require the ECB to reassess its baseline for the underlying inflationary outlook.

Week Ahead – BoE to Likely Cut in Split Vote – Trade Turmoil Unlikely to End
- Bank of England decision to be the week’s main event.
- ISM services PMI is only other highlight in relatively quiet week.
- Market sentiment might struggle in aftermath of Trump’s August 1 tariffs.
BoE faces tough balancing act
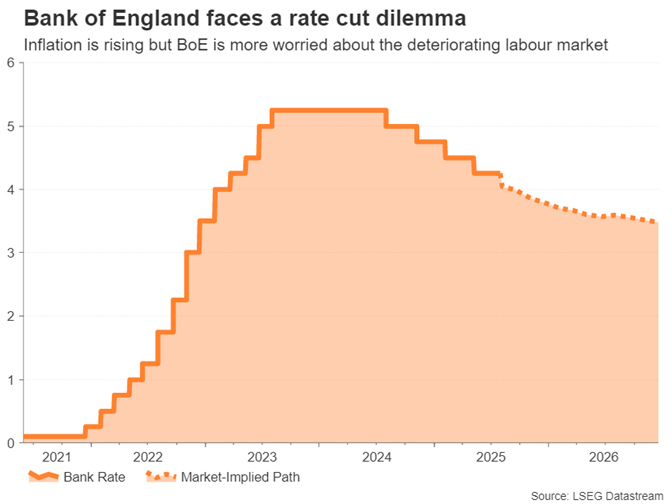
The Bank of England will keep the central bank theme going over the coming week as it’s next in line to set interest rates. Policymakers are headed for a fraught decision amid a dilemma between taming resurgent inflationary pressures and supporting growth in a slowing economy.
The UK’s headline CPI rate climbed to 3.6% year-on-year in June and the core rate also edged up. Aside from higher energy prices, whose effect is likely to be temporary, a bigger concern for the BoE is the substantial rise in food prices, with the British Retail Consortium warning that food inflation could hit 6% by year end.
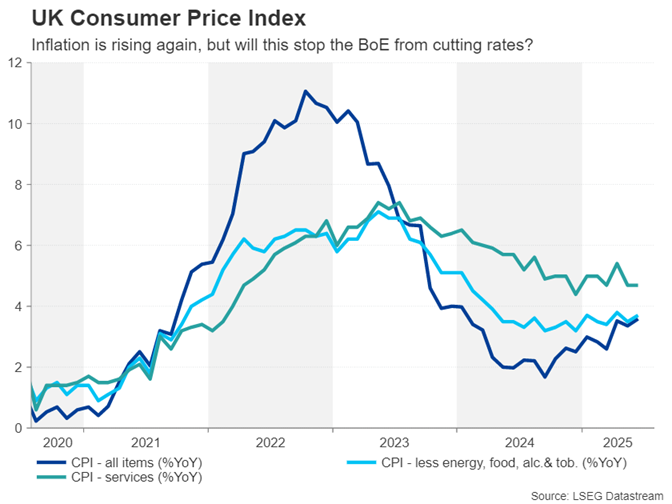
Yet, Governor Andrew Bailey has been beating the dovish drum lately, as the UK economic outlook has deteriorated following Chancellor Rachel Reeves’ Autumn budget in November. As widely predicted, Reeves’ hike in employers’ national insurance is prompting many businesses to cut back on staff, while job vacancies have plunged to the lowest since 2021.
Earlier in July, Bailey sounded worried about slack opening up in the economy, which would normally be grounds for a rate cut. The drop in GDP in both April and May supports this view. But with the upswing in inflation potentially not over, can the Bank risk lowering rates further?
The most likely outcome is that the BoE will trim rates by 25 basis points, sticking to its ‘gradual and careful’ approach of one reduction per quarter. But the decision will be split, possibly three ways, with some MPC members voting to keep rates on hold, others voting to cut by 25 bps, and one or two members even opting for a 50-bps reduction.
The reaction in the pound will probably be limited in the event of a three-way split as it will be hard to get a clear message on the interest rate outlook. But should the vote turn out to be much tighter, with no MPC member voting for a 50-bps cut and Bailey having the casting vote, the pound could strengthen somewhat on the back of it.
ISM services PMI on tap after Fed
Across the Atlantic, the Fed is also facing an inflation problem but unlike the UK where stagflationary risks are more prominent, the US economy is for the moment humming along quite nicely with few visible scars from the trade war.
It may take several months for the impact of the higher tariffs to fully reflect in the inflation data, while the cooldown in hiring appears to be offset by fewer people entering the workforce, amid President Trump’s migration crackdown. Fed chief Jerome Powell appeared to acknowledge this in his press conference that followed the July FOMC decision.
Although two governors voted to cut rates by 25 bps, the overall tone of the statement and Powell’s commentary was very neutral, suggesting that the Fed is not ruling out a rate increase should higher tariffs and a tighter labour market push inflation higher even as it opens the door to a September cut.
But it’s also possible that the labour market is much weaker than implied by the official data and tariffs may only modestly lift inflation. Investors are therefore keeping a close watch on the more forward-looking data such as the PMIs to gauge what’s happening to both price pressures and employment.
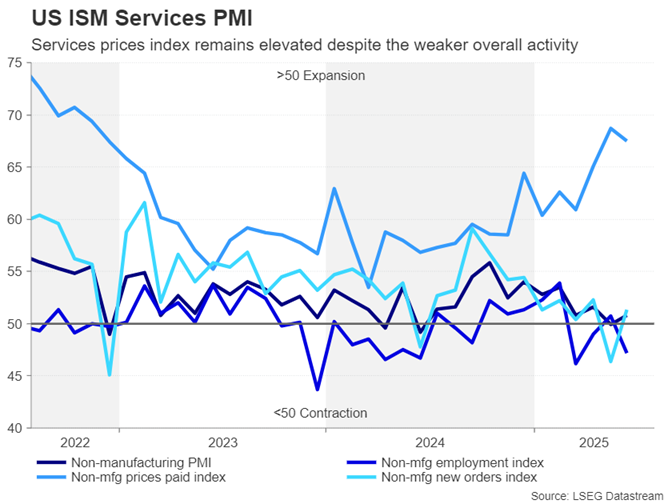
Tuesday’s ISM services PMI for July could sway the US dollar in either direction depending on whether it tips the balance towards a rate cut or a prolonged pause.
Trade uncertainty persists despite deals
But with not much else on the US agenda, traders will also be paying attention to the latest developments in the ongoing trade negotiations between the US and the remaining countries that haven’t signed a deal.
The United States has reached trade deals with most of its major partners such as the UK, EU, Japan and South Korea. But there is no firm agreement with China to extend their trade truce beyond August 12 when the current one expires. More importantly, the White House is still engaged in talks with its closest neighbours, Canada and Mexico, to find a resolution to their trade disputes. Mexico has been granted an extension, Canada has not, and it now faces duties of 35% on its goods.
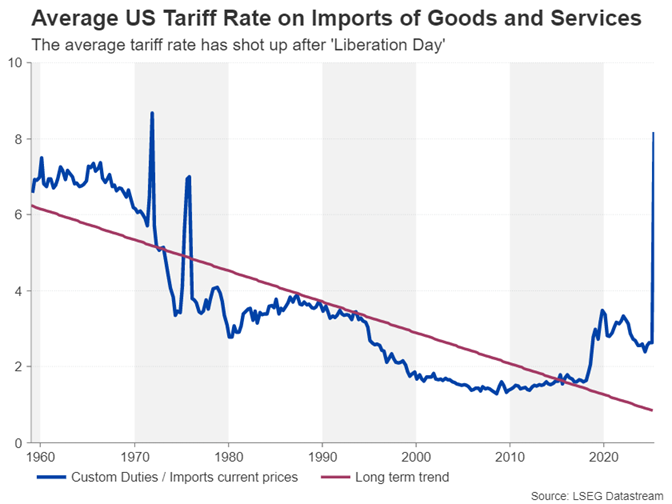
Tariffs on all other countries have been set at a minimum of 10%, with several countries such as Switzerland and India receiving punitive rates of 39% and 25%, respectively. It’s possible that some countries might still manage to negotiate lower rates, as the new tariffs won’t go into effect until August 7 and there have also been indications that the White House is open to more talks.
But markets are only just starting to realise that the new tariff levels represent a significant increase from the pre-trade war average and the implications of this on domestic inflation in America and on growth prospects around the world could be far more severe than anticipated by most investors. Hence, a fresh tariff-related volatility episode cannot be ruled out.
Next week’s Treasury issuance further risks roiling markets if negative trade headlines knock confidence in the US economy, leading to poor demand at the auctions and pushing up the yields on the 10- and 30-year bonds.
Canada misses out on trade deal, jobs report eyed
One of the toughest negotiations during Trade War II have been between the US and Canada. President Trump has certainly not made things easy for Prime Minister Mark Carney, deciding to impose 35% tariffs on all goods that are not covered by the USMCA agreement.
Doubts about whether Canada will be able to convince Trump to agree to reduced levies have pushed the Canadian dollar to two-month lows against the US dollar.
For the Bank of Canada, the uncertain outlook hasn’t been its only headache as a pickup in underlying inflation has complicated matters for policymakers. However, at its July meeting, Governor Tiff Macklem said that “there are reasons to think that the recent increase in underlying inflation will gradually unwind”, while the announcement statement suggested that a further reduction in interest rates might be needed if the economy were to continue to weaken.
One key indicator of how well the economy is faring will be Friday’s employment report. Canada’s labour market added a solid 83k jobs in June. Another strong print in July would lessen the need for an immediate cut, lending some support to the loonie.
Will the BoJ Summary ease the Yen’s pain?
The yen has also fallen sharply against the US dollar lately, as investors have not been convinced that the US-Japan trade deal will provide much of a boost to the Japanese economy. A year-end rate hike is only about 70% priced in as the Bank of Japan declined to strongly hint at further tightening at its July meeting.
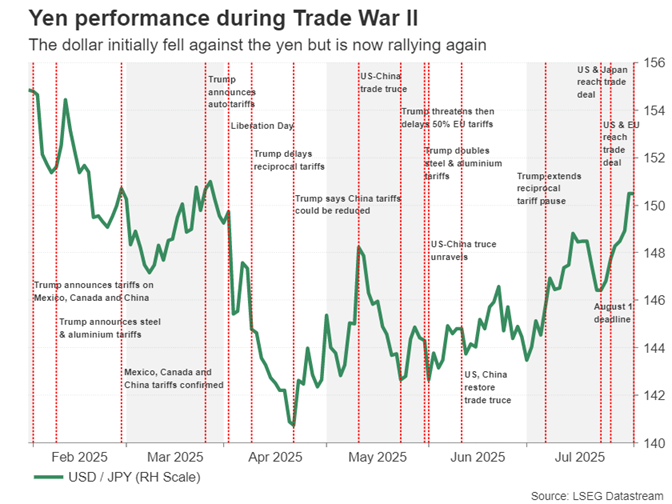
Should next week’s wage growth (Wednesday) and household spending (Friday) data point to faster pay increases and higher consumption in June, the yen could benefit from renewed rate hike bets.
Investors will also be keeping an eye on Friday’s Summary of Opinions of the BoJ’s latest meeting. A more hawkish tone in the summary than that presented by Governor Ueda in his press conference could also bolster the yen.
Elsewhere, trade data out of China might attract some attention on Thursday, while in New Zealand, quarterly employment stats will be watched on Wednesday. But potentially of greater significance for RBNZ rate cut speculation will be the latest inflation expectation numbers due on Thursday from the central bank’s quarterly survey.
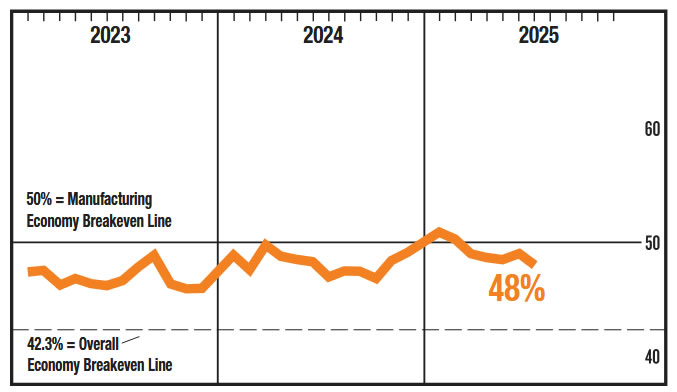
US ISM manufacturing contracts further, employment weakness deepens
US ISM Manufacturing PMI slipped further to 48.0 in July, down from 49.0 and missing expectations of 49.6. This marks the fifth straight month of contraction in factory activity.
While production rose slightly from 50.3 to 51.4 and new orders improved from 46.4 to 47.1, both remained in contractionary territory.
Employment was a particular weak spot, with the sub-index dropping from 45.0 to 43.4—its lowest since the start of the year and the sixth consecutive month of contraction.
The share of manufacturing GDP in contraction jumped sharply, with 79% now shrinking in July versus 46% the month prior. A full 31% is deemed to be “strongly contracting,” suggesting growing stress across the sector.
Input costs also eased, with the prices index falling notably from 69.7 to 64.8.
Despite the weak PMI headline, ISM noted the historical correlation still points to modest growth in the broader economy, equating to roughly 1.6% annualized GDP growth. But signs of deeper employment cuts and broadening factory weakness raise concerns about the resilience of the industrial economy in H2.
Sunset Market Commentary
Markets
Dubbed “Liberation Day 2.0”, US president Trump’s adjusted tariffs now the August 1 deadline has lapsed had by far the largest negative impact on equity markets. Asian stocks withstood the long list of unilateral tariffs relatively well but European equities have a much harder time. The EuroStoxx50 slumps >2%, adding to yesterday’s -1.3%. Trump maintained a 10% minimum rate, applicable to countries with a trade deficit with the US (yes, you read that right) while those with a limited trade surplus face 15% (about 40 countries). Countries without a trade agreement or higher surpluses would pay a sometimes significantly higher rate. Switzerland (39%) serves as a case in point. The new rates kick in on August 7 and need yet to be complemented by any sectoral tariffs (pharma, semiconductors, rare metals …). FI and FX markets trade surprisingly resilient. We’re not seeing any safe haven flows to German Bunds, on the contrary: yields rise between 0.7 (bps) to 5.4 (30-yr) bps. US rates eke out up to 2.6 bps. Wednesday’s two dissenters simultaneously hit the wires today, repeating their calls for cuts. Waller said the Fed shouldn’t wait for the labour market to deteriorate while Bowman said slowing growth allows for gradual rate reductions. The USD has a minor upper hand against most G10 peers but its within the margin of error as markets hold the sidelines going into the July Labour market report. EUR/USD hovers around the 1.14 barrier. The trade-weighted dollar index extends this week strong rally to beyond 100. GBP trades in the defensive, allowing EUR/GBP to rebound for a second day straight back to the 0.866 area. The Swiss franc obviously underperforms peers. EUR/CHF jumps north of 0.93.
Enter the payrolls to completely wipe out the pre-labour market picture. July employment was a meagre 73k, falling short of an already low bar of 104k. The previous two months faced a significant cumulative downward revision of 258k, meaning there was barely any employment growth in May (19k) and June (14k). That brings the 3mMA to the lowest since 2010 (35k). A 96k job increase in the services sector (private education & health) compensated an 11k drop in manufacturing and a 12k drop in the government sector. The unemployment rate ticked higher as expected, to 4.2%. That’s still low but it’s despite the participation rate easing to 62.2%. Wages grew largely in line with expectations (0.3% m/m and 3.9%). The market reaction is textbook: front end US yield curves tank up to 21 bps as markets ramp up Fed easing bets again just after the central bank told they won’t just yet. A September cut is priced in for 85% vs 40% pre-payrolls. If future labour market reports confirm the weakening state, we wouldn’t rule out the Fed going big in its opener, similar to last year. Longer maturities drop 8-13 bps too. German yields swap gains for losses in sympathy. The greenback takes a sucker punch, ending in what otherwise have been a stellar week with a downer. EUR/USD shoots up from <1.14 to 1.156 currently. DXY nosedives back towards 99.4 and USD/JPY returns to 149.04. Wall Street opens more than 1% lower but the majority of (futures) losses were already prior to the release. The US manufacturing ISM is still scheduled for release after the wrap-up of this report.
News & Views
The IMF’s executive board approved a $2bn disbursement to Argentina after concluding its first review of the country’s $20bn deal with the Washington-based institution. The approval is seen as a sign of confidence in president Milei and his government since it missed a key mid-June target for building up its net international reserves at the central bank. With the approval, total IMF financing for Argentina adds up to $14bn after an initial and upfront release of an unusually large $12bn chunk. IMF director Georgieva said Milei’s economic program is off to a “strong start” and said that “Exchange rate flexibility should be preserved, while sustained efforts continue to rebuild reserves buffer” in being critical for Argentina to better manage shocks and have durable access to international capital markets.
July and the No Good, Very Bad Jobs Report
Summary
The July employment report was a dud. Nonfarm payrolls rose by 73K in July, coming in short of the consensus forecast of 104K. Employment growth was approximately zero outside the health care and social assistance industries. Revisions to job growth in the previous two months were substantial and shaved 258K off of total employment growth in May and June. In the household survey, the unemployment rate rose from 4.1% to 4.2%, but the rounding masks that the unemployment rate just barely missed reaching a cycle-high of 4.3% (4.248% to be exact). The rise in the unemployment rate came despite another tick lower in the labor force participation rate, the third consecutive monthly decline.
Coming into today's report, our base case forecast was that the FOMC would cut the federal funds rate by 25 bps at its September, October and December meetings, with no additional rate cuts in 2026. Based on today's data, we are inclined to leave that projection unchanged for the time being. Given both the downside risks to the Fed's employment mandate and the upside risks to inflation, we think the Committee will move monetary policy toward a more neutral stance in the coming months to better reflect the two-way risks to the economy.
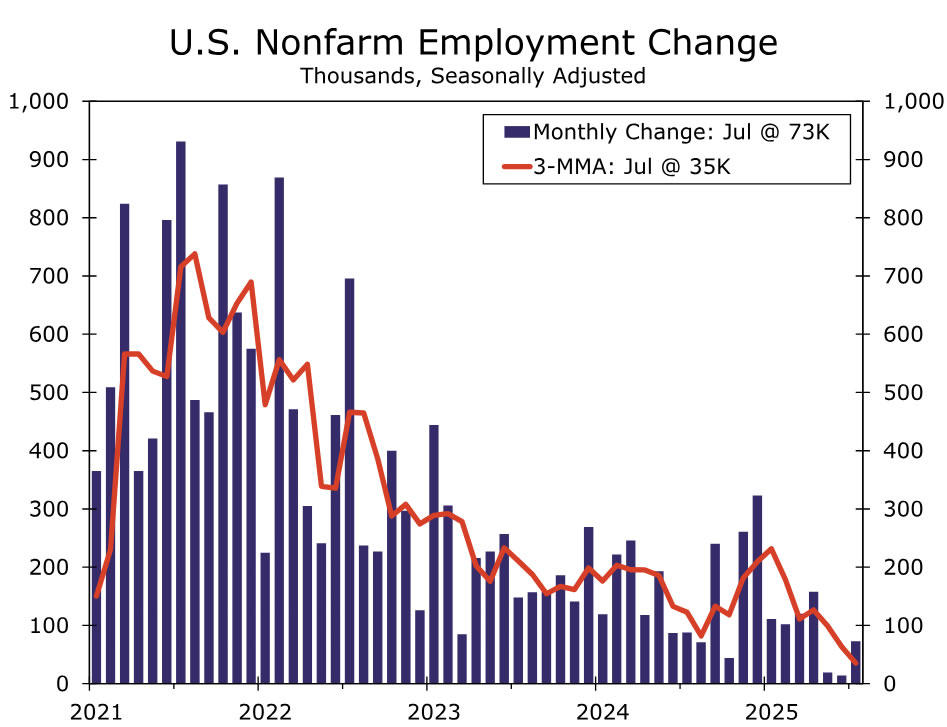
Clear Signs of Weakness
The "solid" state of the labor market described by the FOMC earlier this week looks more questionable after the July employment report. Nonfarm payrolls rose a weaker-than-expected 73K in July. More jarring, the below-consensus print came with the steepest downward net revision to the prior two months data (-258K) since May 2020. The three-month average of payroll growth was 150K coming into this report, and when incorporating revisions, the pace has lurched lower to just 35K.
Downward revisions to the prior months were broad-based. June's initially reported 74K gain in private sector hiring was shaved down to a scant 3K rise, with notable declines in retail trade and professional & technical services. Similarly, updated information from government agencies led June's solid 73K gain in total government payrolls to be revised down to a much more modest 11K increase. In short, hiring was not as stable as previously thought.
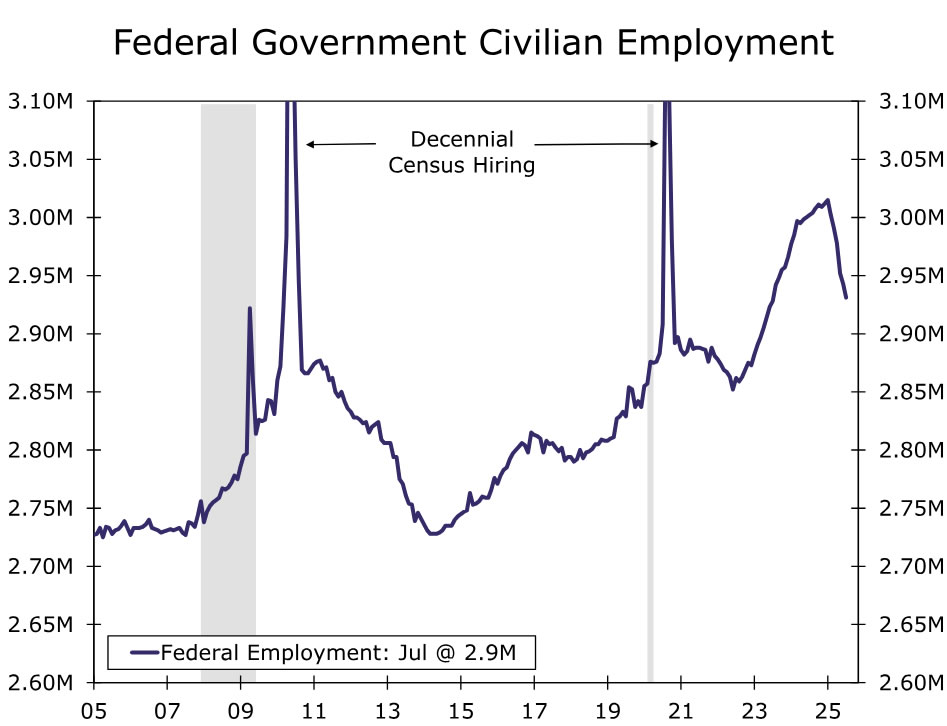
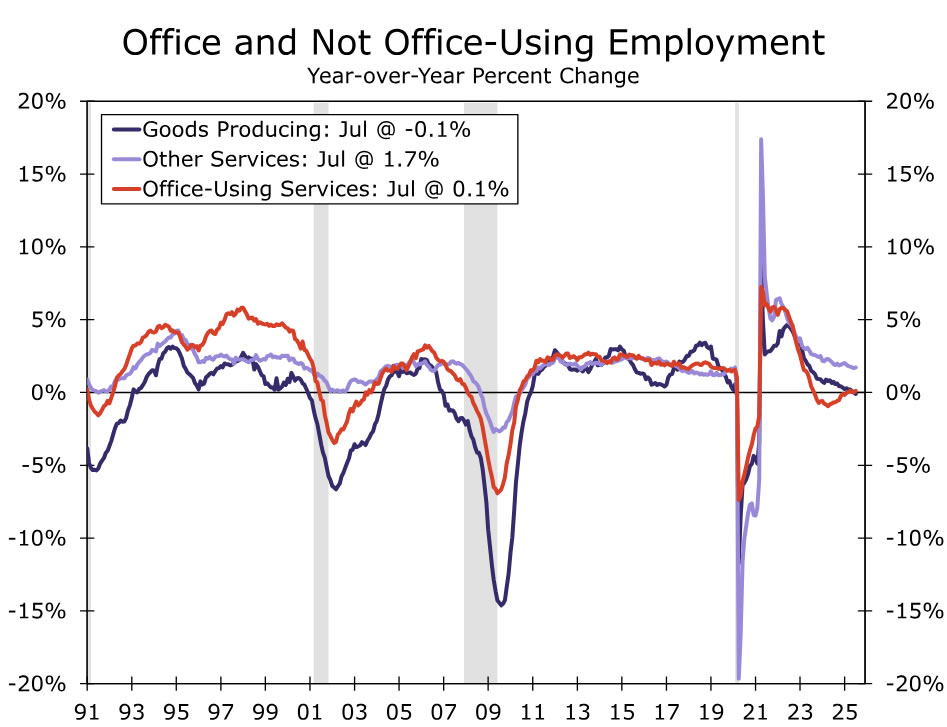
Hiring weakness across industries carried into July. The ongoing federal government hiring freeze pulled total government payrolls into the red in July (-10K), leaving employment down 84K since the start of the year (chart). Outside government, private sector hiring rebounded to a 83K gain, but the details continue to point to a narrow range of industries expanding headcount. Healthcare & social assistance (+73K) continues to be the stalwart of growth, but "white collar" jobs like professional & business services (-14K), information (-2K) and finance continue to struggle (chart). Goods related industries also remain under pressure, as shown by additional declines in wholesale trade (-8K) and manufacturing (-11K). The industry mix is illustrative of cyclically sensitive industries wobbling underneath the weight of stalling demand.
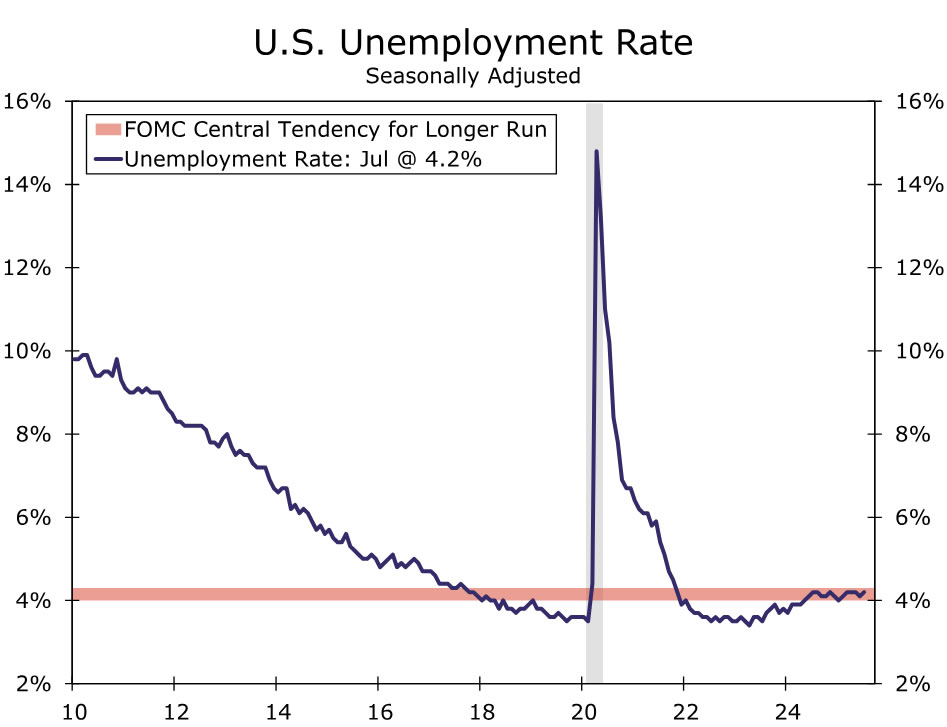
The sharp reduction in immigration this year has made the unemployment rate that much more important in assessing the health of the labor market. Amid tepid demand for workers, slower growth in the labor supply has helped to keep the labor market in balance. In July, the jobless rate ticked back up to 4.2%. That keeps it within the range Fed officials estimate is consistent with the full employment side of their mandate and moving sideways over the past year or so (chart).
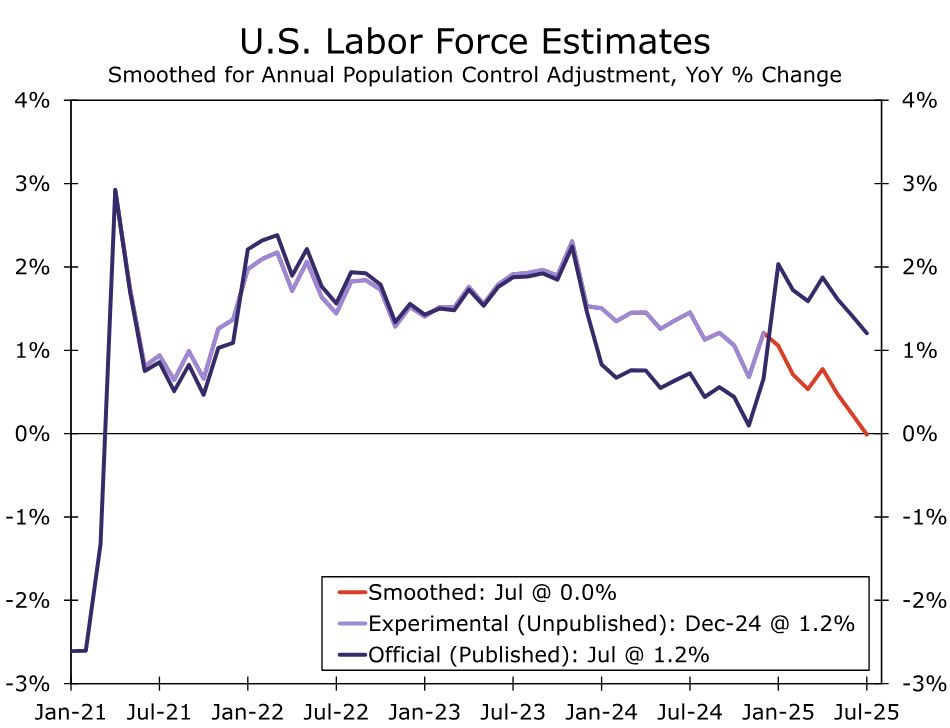
However, the increase in July looked a little more troubling underneath the surface. On an unrounded basis, the unemployment rate printed 4.248%, barely avoiding what would have been a cycle-high print of 4.3%. Moreover, the rise came amid a drop in the household measure of employment (-260K) and another decline in the labor force (-38K), not for the benign reason of more individuals looking for work. The labor force participation fell for a third consecutive month, and when smoothing through the household survey's annual population control adjustments, the size of labor force is now unchanged from a year ago (chart). We continue to expect the unemployment rate to move a bit higher before the year is out, but we look for the rise to be limited to only another couple tenths due to the sharp slowing in labor supply growth.
Average hourly earnings rose 0.3% in the month, and the year-ago pace climbed to 3.9%. This brings it a bit more in line with the recent trend in the Employment Cost Index, which shows signs of a leveling off in wage growth this year. Even with the beat, overall compensation growth is more or less consistent with the Fed's inflation goal once accounting for the recent trend in labor productivity, keeping us of the view that the labor market is not a source of significant inflationary pressure at present.
September Rate Cut Remains the Base Case
Coming out of this week's FOMC meeting, Chair Powell generally characterized the labor market as solid and in a good enough position that the Committee could continue to adopt a wait-and-see approach to monetary policy. But, some Committee members, most notably Governors Bowman and Waller, stressed that downside risks to the labor market warranted a rate cut at the July meeting. Those downside risks materialized in today's employment report, with slower nonfarm payroll growth, higher unemployment and generally crummy details under the hood.
Our base case forecast coming into today's report was that the FOMC would cut the federal funds rate by 25 bps at its September, October and December meetings, with no additional rate cuts in 2026. Based on today's data, we are inclined to leave that projection unchanged for the time being. Given both the downside risks to the Fed's employment mandate and the upside risks to inflation, we think the Committee will move monetary policy toward a more neutral stance in the coming months to better reflect the two-way risks to the economy.
That said, we do not think this is the end of the debate over whether to cut rates in September. There is one more employment report between now and the September 17 meeting, and it will be critical to either confirming or dispelling the weakness seen in today's employment data. Furthermore, there are two CPI reports between now and the next FOMC meeting. With higher prices from tariffs still slowly working their way to consumer products, an upside surprise on inflation would not be surprising. If the inflation data are hot, the FOMC will be in the ultimate bind, and the split on the Committee likely will get worse.
USD/JPY Mid-Day Outlook
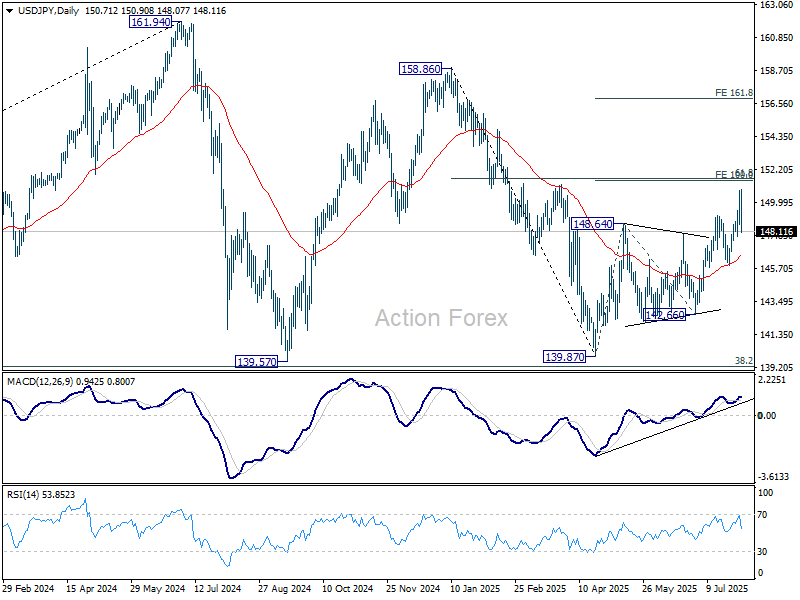
Daily Pivots: (S1) 149.29; (P) 150.07; (R1) 151.54; More...
Intraday bias in USD/JPY is turned neutral first with current steep decline. Further rally is still expected as long as 145.84 support holds. Above 150.90 will resume the rise from 139.87 to 100% projection of 139.87 to 148.64 from 142.66 at 151.43. However, firm break of 145.84 will indicate near term reversal and turn outlook bearish.
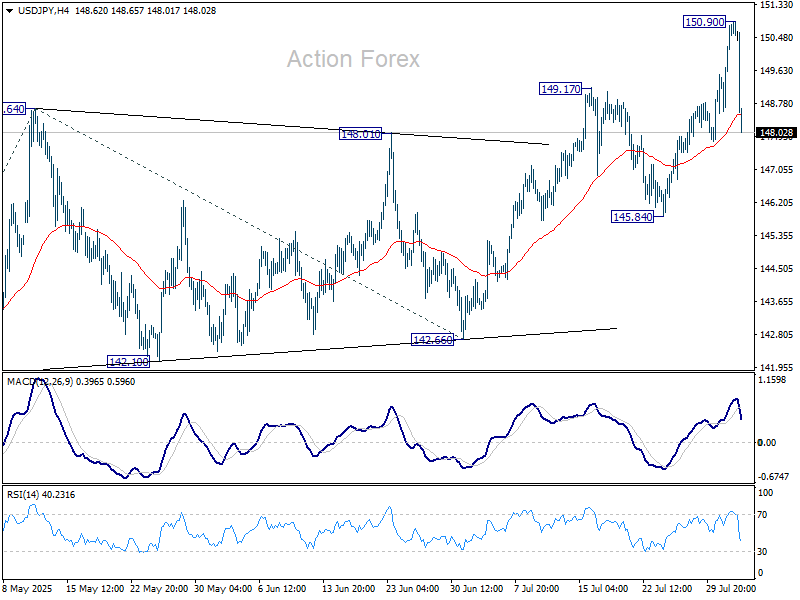
In the bigger picture, price actions from 161.94 (2024 high) are seen as a corrective pattern to rise from 102.58 (2021 low). Decisive break of 61.8% retracement of 158.86 to 139.87 at 151.22 will argue that it has already completed with three waves at 139.87. Larger up trend might then be ready to resume through 161.94 high. In case the corrective pattern extends with another fall, strong support is expected from 38.2% retracement of 102.58 to 161.94 at 139.26 to bring rebound.