
Sample Category Title
USD/JPY Daily Outlook
Daily Pivots: (S1) 149.29; (P) 150.07; (R1) 151.54; More...
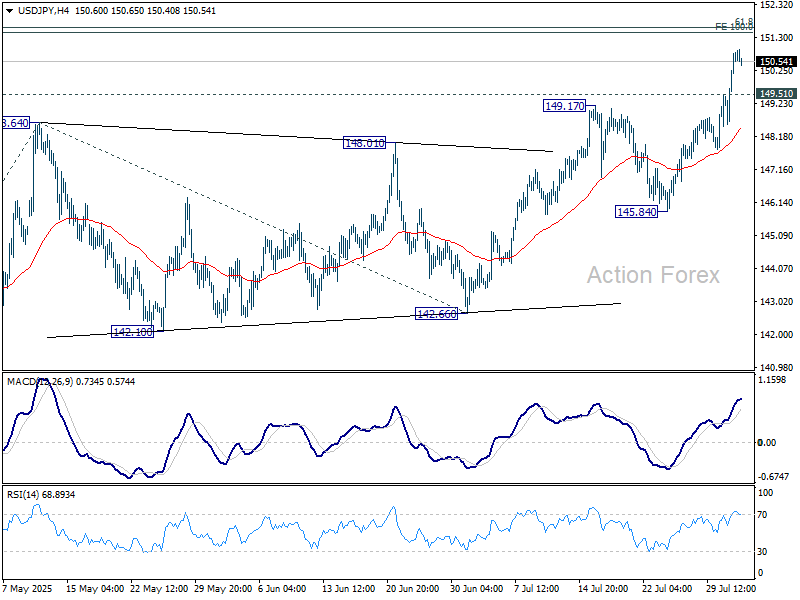
Intraday bias in USD/JPY remains on the upside for 100% projection of 139.87 to 148.64 from 142.66 at 151.43, which is close to 151.22 fibonacci level. Decisive break there could prompt upside acceleration to 161.8% projection at 156.84 next. On the downside, below 149.51 minor support will turn intraday bias neutral and bring consolidations first, before staging another rally.
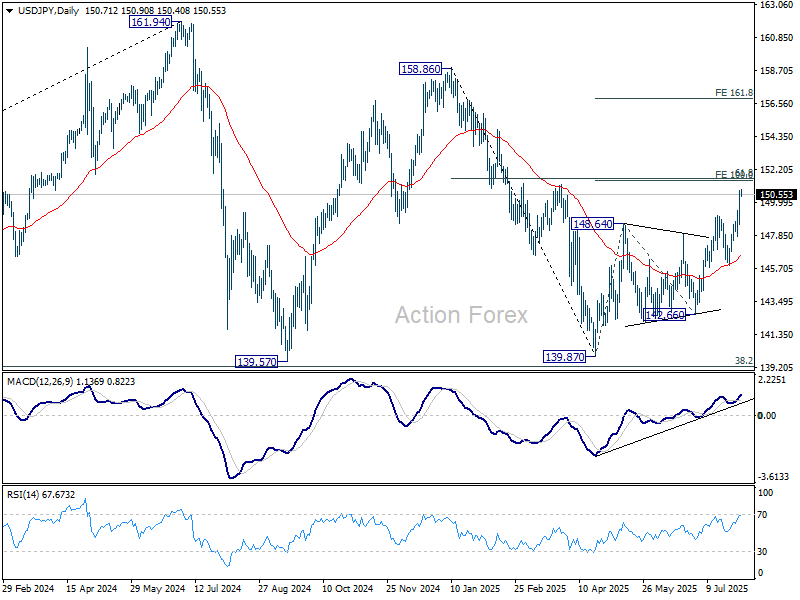
In the bigger picture, price actions from 161.94 (2024 high) are seen as a corrective pattern to rise from 102.58 (2021 low). Decisive break of 61.8% retracement of 158.86 to 139.87 at 151.22 will argue that it has already completed with three waves at 139.87. Larger up trend might then be ready to resume through 161.94 high. In case the corrective pattern extends with another fall, strong support is expected from 38.2% retracement of 102.58 to 161.94 at 139.26 to bring rebound.
GBP/USD Daily Outlook
Daily Pivots: (S1) 1.3167; (P) 1.3225; (R1) 1.3263; More...
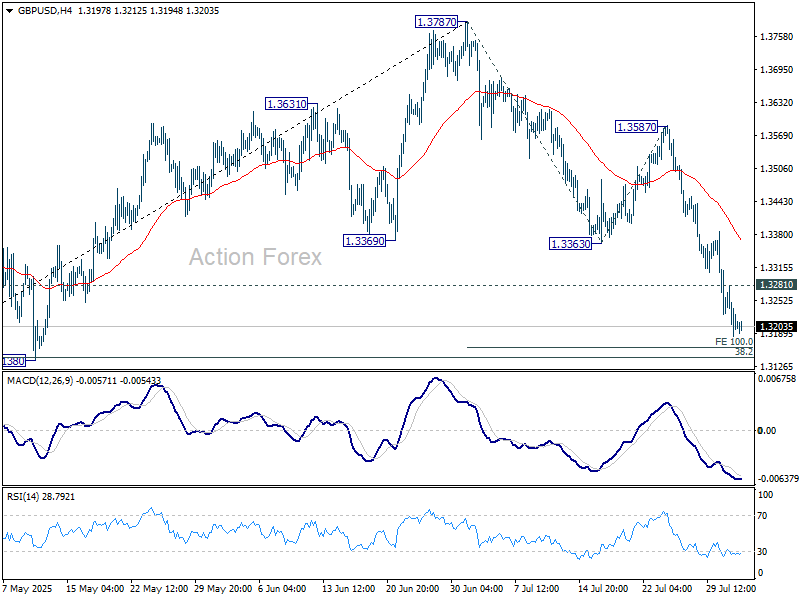
Intraday bias in GBP/USD remains on the downside as fall from 1.3787 short term top is in progress for 100% projection of 1.3787 to 1.3363 from 1.3587 at 1.3163. Firm break there will target 161.8% projection 1.2901 next. On the upside, above 1.3281 minor resistance will turn intraday bias neutral first. But risk will stay on the downside as long as 1.3363 support turned resistance holds, in case of recovery.
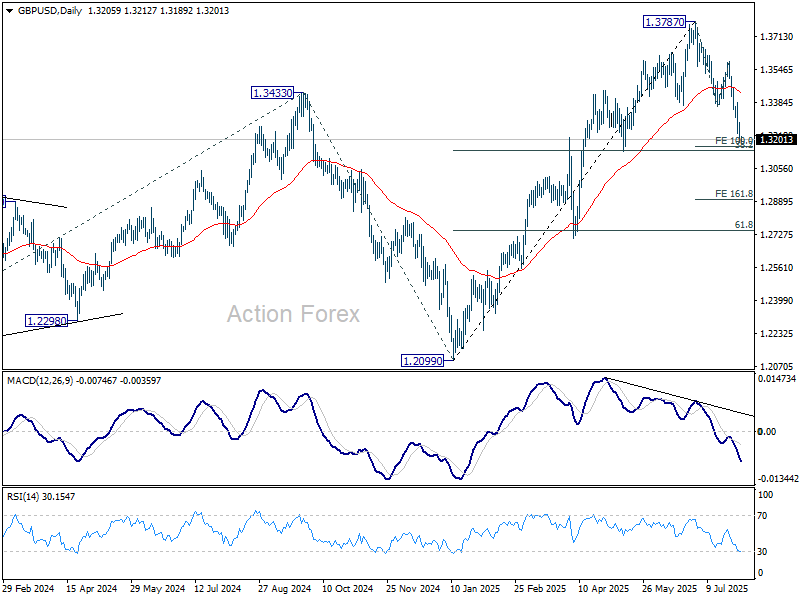
In the bigger picture, up trend from 1.3051 (2022 low) is in progress. Next medium term target is 61.8% projection of 1.0351 to 1.3433 from 1.2099 at 1.4004. Outlook will now stay bullish as long as 55 W EMA (now at 1.3045) holds, even in case of deep pullback.
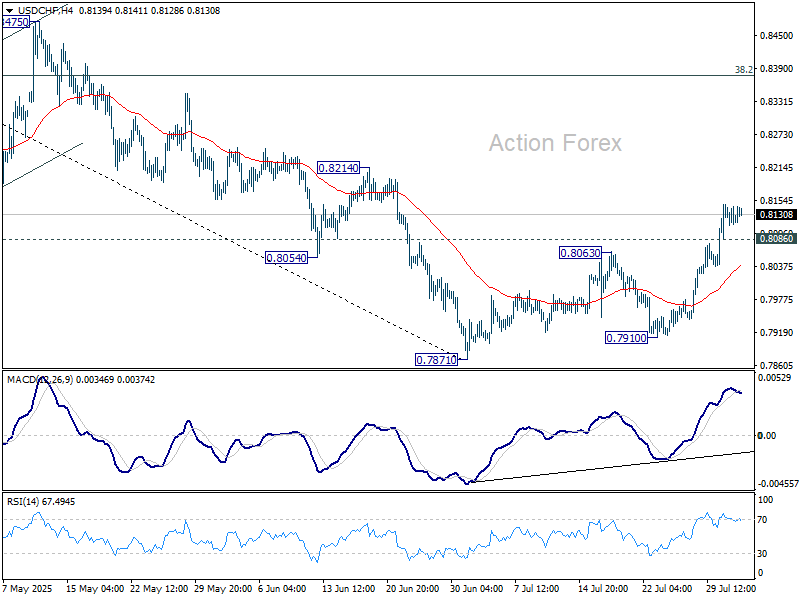
USD/CHF Daily Outlook
Daily Pivots: (S1) 0.8105; (P) 0.8130; (R1) 0.8148; More….
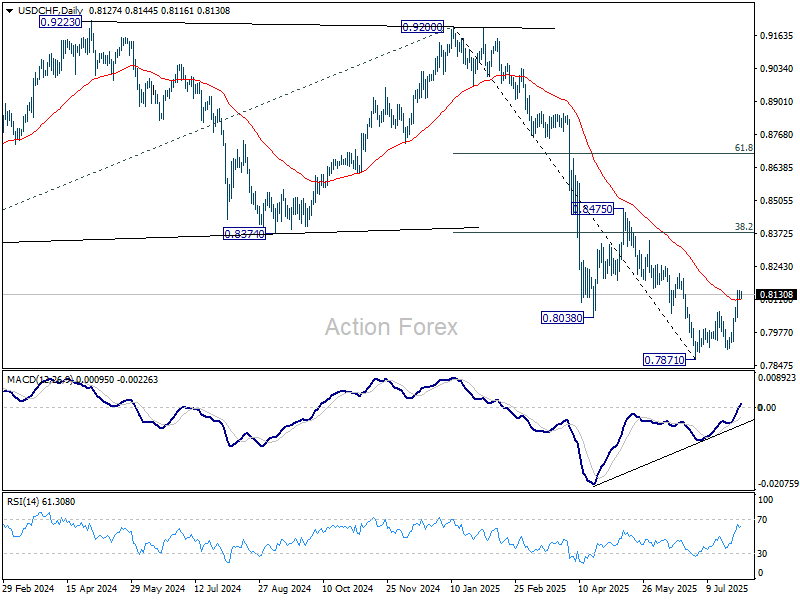
Intraday bias in USD/CHF stays on the upside for the moment. Rise from 0.7871 is at least correcting the fall from 0.9200. Further rally should be seen to 38.2% retracement of 0.9200 to 0.7871 at 0.8379 next. On the downside, below 0.8086 minor support will turn intraday bias neutral and bring consolidations first.
In the bigger picture, long term down trend from 1.0342 (2017 high) is still in progress. Next target is 100% projection of 1.0146 (2022 high) to 0.8332 from 0.9200 at 0.7382. In any case, outlook will stay bearish as long as 0.8475 resistance holds.
Cliff Notes: Guarded Optimism
Key insights from the week that was.
All eyes were on the long-awaited Q2 CPI in Australia. In the event, the data confirmed that inflation is on track to sustainably return to the centre of the RBA’s 2-3% target range. The disinflationary pulse was clearly on display across the bulk of the consumer basket, with the crucial trimmed mean measure tracking a 6-month annualised pace only a whisker above the midpoint (2.6%yr). The 0.7% gain in headline inflation brought the annual pace down towards the bottom of the band at 2.1%yr, as energy rebates continued to supress electricity prices through the year – note, this dynamic is set to reverse in coming quarters.
Following the Q2 CPI release, Chief Economist Luci Ellis reaffirmed our call for RBA rate cuts in August, November, February and May for a terminal rate of 2.85% -- which we see as the lower end of the neutral range. With inflation now clearly on a sustainable path towards the midpoint, the other side of the Board’s mandate – full employment – will become the focus of analysis. This was alluded to in the RBA Deputy Governor’s ‘fireside chat’ this week, with Hauser stating that keeping the economy balanced “won’t be an easy task” and that, if unemployment were to rise sharply, they would “have to react”.
We also received constructive updates on the Australian consumer this week. For retail sales, nominal trade beat expectations, rising 1.2% in June and 0.8% through Q2. However, price growth was the primary support for nominal sales during the quarter, real retail sales rising just 0.3%. The signal from personal credit growth was also promising, suggesting credit card activity may have picked up towards the end of Q2. While it remains to be seen if these outcomes are more signal than noise, following such a lengthy period of disappointment, these outcomes are certainly welcome. For our in-depth take on the health of the Australian consumer, please see our latest Red Book.
Before moving offshore, it is also worth noting that dwelling approvals surprised sharply to the upside in June, up 11.9% (27.4%yr). Most of the heavy lifting was done by the often-volatile private units component, while the more stable private detached houses segment continued to track a flat trend. The outlook remains positive given the promise of RBA rate cuts, a labour market in robust health and housing demand clearly in excess of available supply.
Offshore, the US was the dominant market for both policy and data developments this week.
At their July meeting, the FOMC voted to leave the fed funds rate unchanged, albeit with two dissents – Bowman and Waller preferring to cut. The statement outlined that, while growth moderated in H1 2025, labour market conditions remain solid. Inflation meanwhile "remains somewhat elevated", running at an above-target rate abstracting from the impact of tariffs. Made clear in the press conference is that while activity growth is positive and the labour market in balance, i.e. the unemployment rate is stable, the majority of the Committee believe it is appropriate to keep pressure on inflation to bring it closer to target.
The FOMC are mindful of the potential for downside risks to compound, however. While US GDP rose 3.0% annualised in Q2, this was primarily the result of a reversal of Q1’s abnormal trade flows to get ahead of the implementation of tariffs. Domestic demand grew just 1.4% annualised through H1 2025, half the average of the prior 10 years. Consumption was weaker still, registering growth of just 0.9% annualised over the first 6 months of the year while housing investment contracted 3.0% annualised. Government demand was flat over the period, and business investment growth weak at 1.9% annualised in Q2 after Q1’s 10.3% annualised surge. If these trends continue, the labour market will weaken further in coming months and the FOMC will be justified in moving closer towards a neutral setting. Note though, because of the presence of structural supports for inflation as well as tariffs, we continue to expect just 50bps of easing in H2 2025 and an unchanged stance thereafter versus the market expectation of around 110bps of easing through to end-2026. We also see the US 10-year continuing to drift higher on fiscal concerns.
Other data released this week was relatively insignificant. And both the Bank of Canada and Bank of Japan kept their policy stance and tone unchanged.
In the Bank of Canada’s messaging, notable was the resilience of Canada and the global economy to the trade uncertainty created by the US. In Canada, trade-exposed sectors have shown weaker demand for labour, but other sectors are in robust shape, seeing excess supply only slowly trend up in aggregate. Ahead, this disinflationary pressure will be judged against the inflationary consequence of tariffs to gauge the appropriate stance for policy. Downside risks for employment and activity will also be closely monitored but, to a degree, have already been protected against by the Bank of Canada returning policy near neutral.
For the Bank of Japan, higher near-term inflation has not shifted their perspective on policy or the known risks to the outlook. FY2025 annual inflation (to March 2026) is now expected to come in at 2.7%yr, up from 2.2%yr. However, being the result of a one-off surge in the price of rice, it is being looked through, with the BoJ’s focus remaining on wage outcomes and their impact on demand-driven inflation. Corporate profit margins are supportive of further robust wage gains, but the uncertainty clouding the global outlook is not. Our base expectation is that the BoJ will remain patient and only raise their policy rate again in March 2026. But we are mindful of their take on the summer bonuses data due late August. If this shows enough promise, and global uncertainty ebbs, the next rate hike could come in January 2026 instead.
Before concluding for the week, it is worth highlighting that the White House continues to announce updated tariff rates for nations across the world, effective 7 August. This week, the administration announced that country’s who have a trade deficit with the US will have a minimum tariff of 10% (Australia included), and those with a trade surplus a minimum rate of 15%. Individual country rates vary significantly though, with recent examples including: Switzerland, 39%; Canada, 35% (excluding USMCA goods); South Africa, 30%; India, 25%; Taiwan, 20%; and Thailand / Cambodia, 19%. Industry tariffs are still be assessed by the administration and there is the potential for retaliation. US trade policy is therefore likely to remain a focus for markets in the weeks to come ahead of clear evidence of the policy’s impact on the US economy – which is likely into Q4.
Elliott Wave Analysis Points to Gold (XAUUSD) Support Near 3320
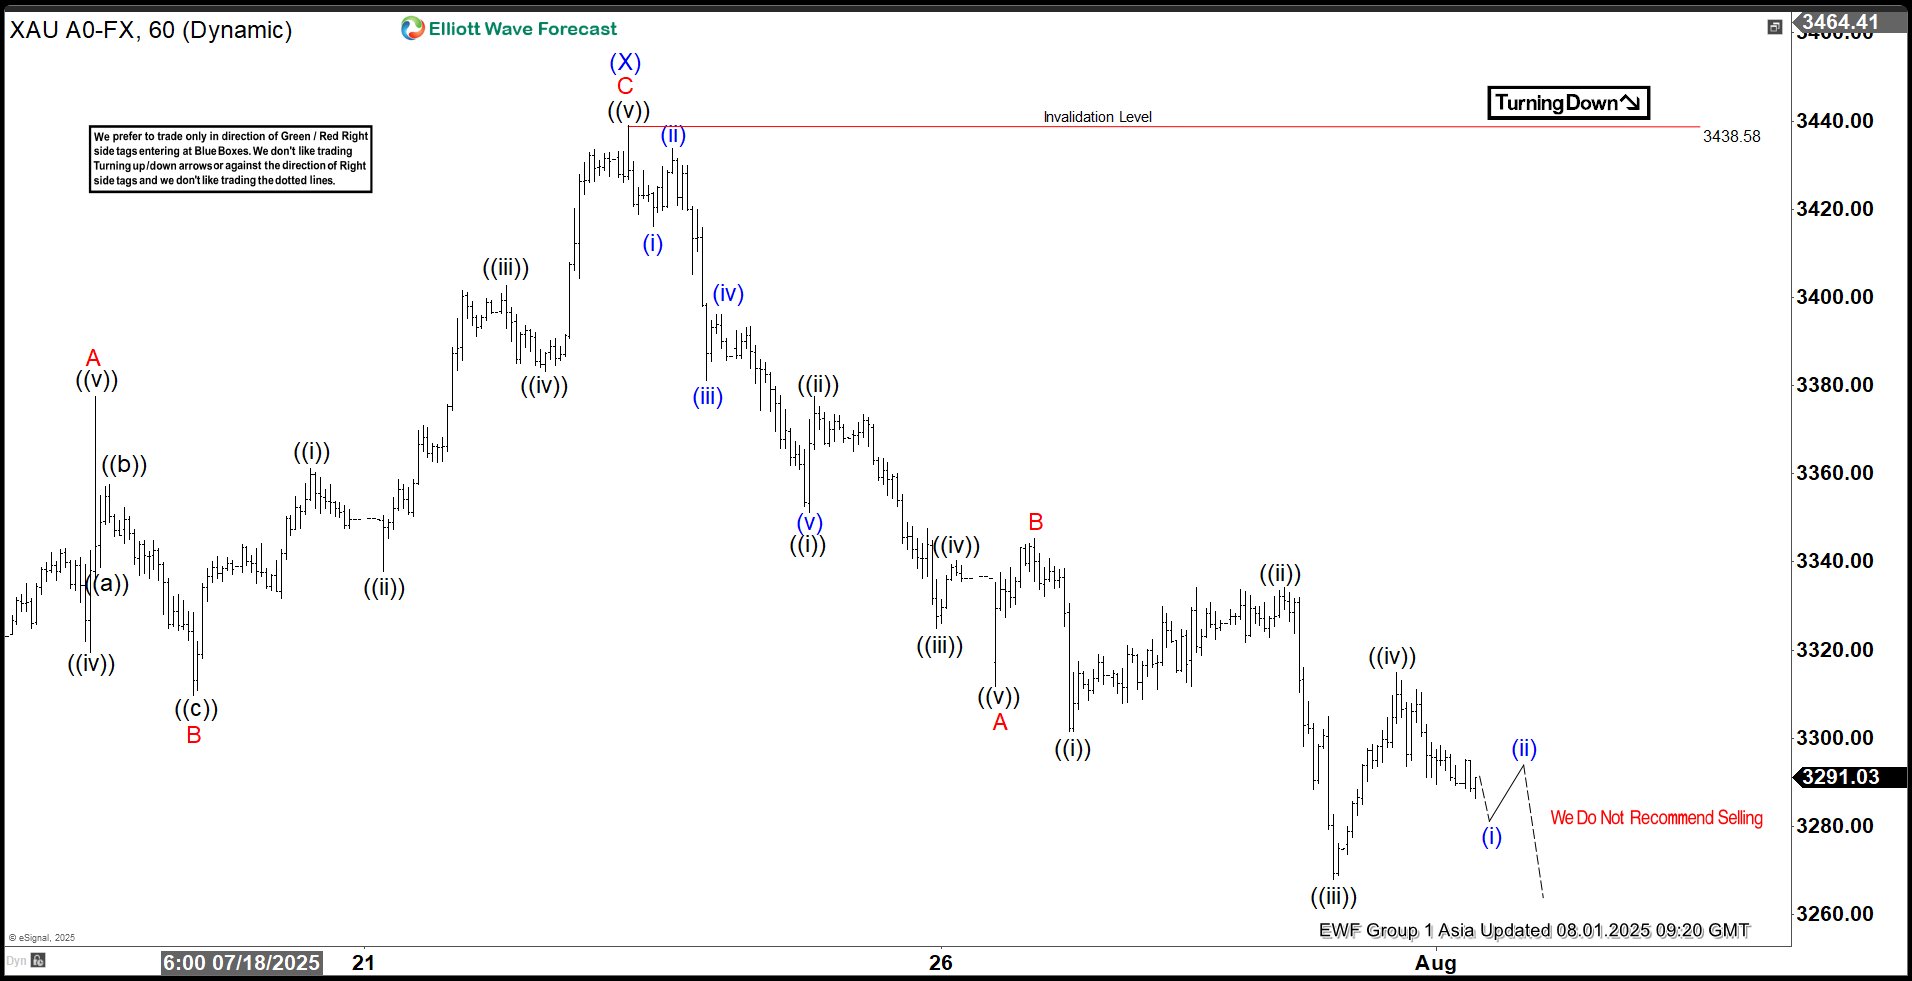
Gold (XAUUSD) appears poised for a double correction from its 16 June 2025 high. A double three consists of two corrective patterns, typically zigzags. From the June peak, wave (W) concluded at 3246.55, and wave (X) rallied to 3438.58, as shown on the 1-hour chart. Wave (Y) is now unfolding lower with internal subdivision as a zigzag. From wave (X), wave ((i)) ended at 3351.17, and wave ((ii)) peaked at 3377.45. Wave ((iii)) declined to 3324.80, followed by a wave ((iv)) rally to 3340.34. The final wave ((v)) completed at 3311.62, forming wave A in a higher degree. A corrective wave B rally reached 3345.35 before gold resumed its downward move.
Within wave C, wave ((i)) finished at 3301.47, and wave ((ii)) rallied to 3334.08. Wave ((iii)) dropped to 3267.94, with wave ((iv)) ending at 3314.85. Gold should continue lower in wave ((v)) to complete wave C. The potential target lies within the 100%–161.8% Fibonacci extension from the 16 June high. This projects a support zone between 3104 and 3230, where a three-wave rally is anticipated. Traders should monitor this area for potential reversal signals, as it may offer support for a corrective bounce.
Gold (XAUUSD) – 60-Minute Elliott Wave Technical Chart:
XAUUSD – Elliott Wave Technical Video:
https://www.youtube.com/watch?v=9ko6UqLOTd8
Worst Case Scenario Largely Avoided and There’s a Clear Starting Point
Markets
From economic data to the Fed over to trade and some back and fourth switching in between: this is a week that’s keeping markets on edge. The economic calendar yesterday offered no more than some second tier eco data, resulting in relatively small market moves. Core bond yields changed less than 2-3 bps across the curve en both the dollar and euro kept each other balanced around but north of 1.14. JPY underperformed. It wasn’t until after the market close that we were treated with some actual news though. Going into the August 1 deadline, a White House document released a slew of unilateral tariffs announcements. President Trump kept a 10% minimum reciprocal tariff rate globally. Many countries faced higher rates though, including New Zealand (15%), Taiwan (20%), South Africa (30%) and Thailand and Cambodia (both 19%). Switzerland is looking at a whopping 39% and Trump raised the tariff for Canada to 35% from 25%. Goods traded under the rules of the US-Mexico-Canada trade agreement (covering the vast majority of US-Canadian trade) are exempted tough. With the announcement, there’s at least some kind of clarity: worst case scenario’s were largely avoided and there’s a clear starting point. Countries that haven’t struck a deal yet can now try to bring their rates down through negotiations. Uncertainty is not at all gone though with sectoral tariffs still a pending matter. Talks with China are also ongoing and likely to be extended beyond the August 12 deadline. But all things considered, the Asian market response could have been worse. SK stands out (cfr. infra) but most other indices cap losses to less than 1% with some even trading in the green. European futures do suggest further losses after yesterday’s -1.3% drop, also catching up with a late-session swoon on WS. The euro holds a tiny upper hand over the dollar while CHF along with NZD is lagging.
And from trade it’s back to the data again. US July payrolls are closely watched today to check whether they vindicate the Fed’s cautious stance. Yesterday’s June PCE price deflators already did so. The bar is set at a relatively low 104k for employment growth and at 4.2%, up from 4.1% in June, for the unemployment rate. A beat would further reduce Fed easing bets, in particular for September although we don’t expect markets to fully let go on the idea. Front-end underperformance of the US yield curve may trigger further dollar strength even as we’re now seeing some signs of bottoming out in EUR/USD. Technically, next meaningful support in EUR/USD only pops up at 1.1214/1.1184 but going this far would require a massive upside payrolls surprise and could also be prevented by intermediate support at the 2023 high of 1.1276.
News & Views
Germany’s finance minister Klingbeil warned that the country is facing a budget gap of as much as €170bn by 2029, posing what he calls a “massive challenge”. Germany lifted the constitutional debt brake (capping German deficits at 0.35% of GDP) but this only applied for defence spending. Other areas of the federal budget are still subjected to it, meaning Germany is now forced to either hike taxes (already ruled out by the government coalition) or cut spending across ministries and reform the welfare system. One potential windfall could come from growth though. Germany has pencilled in conservative growth forecasts of 0% this year and 1% annually between 2026-2029. Stronger than expected growth could help close the shortfall.
South Korean stock markets hugely underperform regional peers this morning. It follows government plans to hike the capital gains tax by lowering the threshold to KRW 1bn from KRW 5bn as well as increase the transaction tax. Other measures include a reversal of the previous administration’s cut to 24% from 25% of the top corporate tax rate. South Korea’s major stock indices decline almost 4%.
AUD/USD Daily Report
Daily Pivots: (S1) 0.6407; (P) 0.6442; (R1) 0.6459; More...
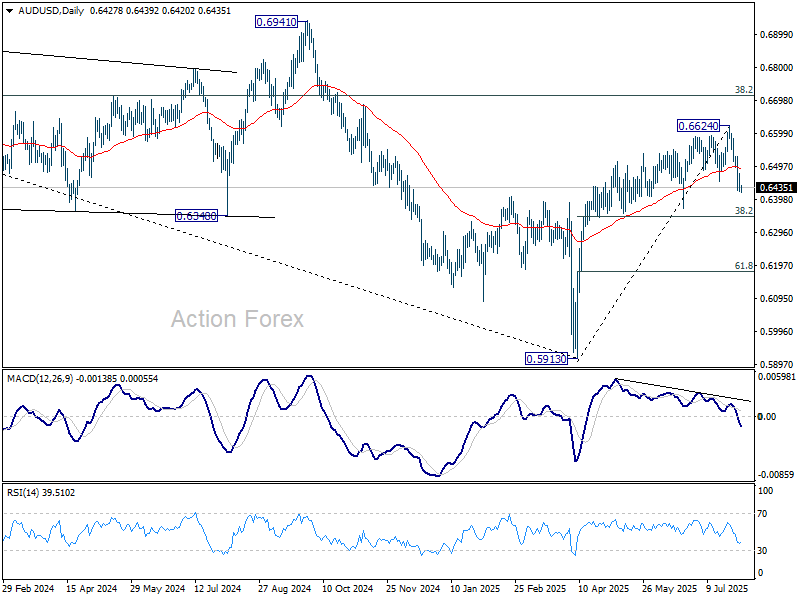
Intraday bias in AUD/USD stays on the downside at this point. Fall from 0.6624 short term top is at least correcting the rally from 0.5913. Deeper decline would be seen to 38.2% retracement of 0.5913 to 0.6624 at 0.6352. Strong support is expected from 0.6352 to bring rebound. On the upside, above 0.6475 minor resistance will turn intraday bias neutral first.
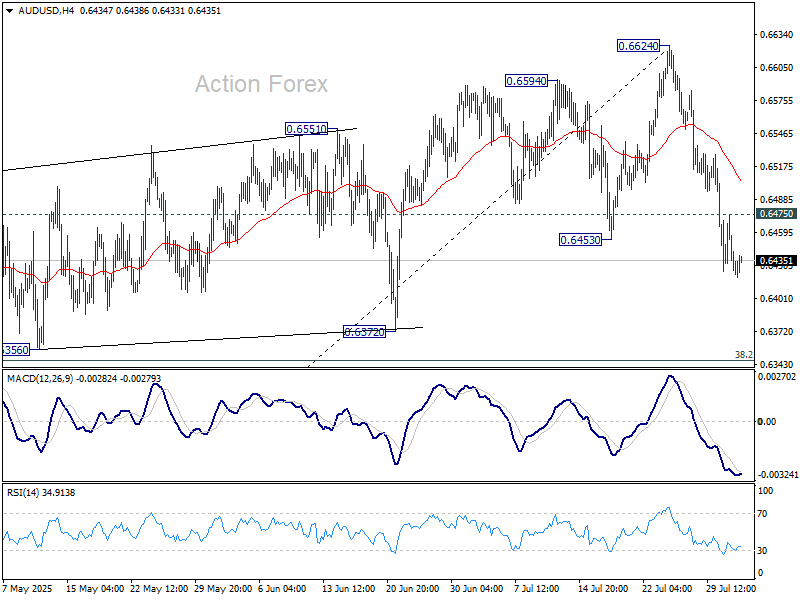
In the bigger picture, there is no clear sign that down trend from 0.8006 (2021 high) has completed. Rebound from 0.5913 is seen as a corrective move. While stronger rally cannot be ruled out, outlook will remain bearish as long as 38.2% retracement of 0.8006 to 0.5913 at 0.6713 holds. Nevertheless, considering bullish convergence condition in W MACD, even in case of another fall through 0.5913, downside should be contained above 0.5506 (2020 low).
USD/CAD Daily Outlook
Daily Pivots: (S1) 1.3828; (P) 1.3843; (R1) 1.3873; More...
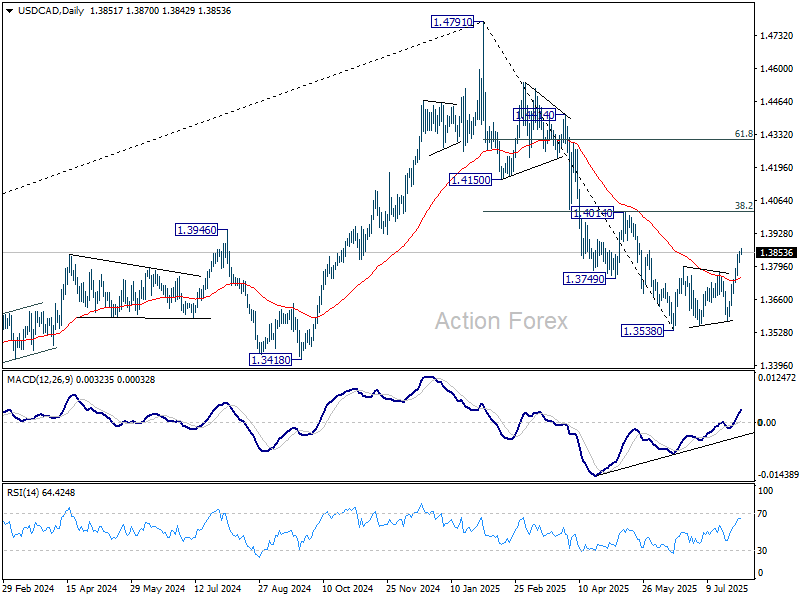
USD/CAD's rally is in progress and intraday bias stays on the upside. Rise from 1.3538 is seen as correcting the decline from 1.4791 and would target 1.4014 cluster resistance (38.2% retracement of 1.4791 to 1.3538 at 14017). But strong resistance should be seen there to limit upside. On the downside, below 1.3812 minor support will turn intraday bias neutral first.
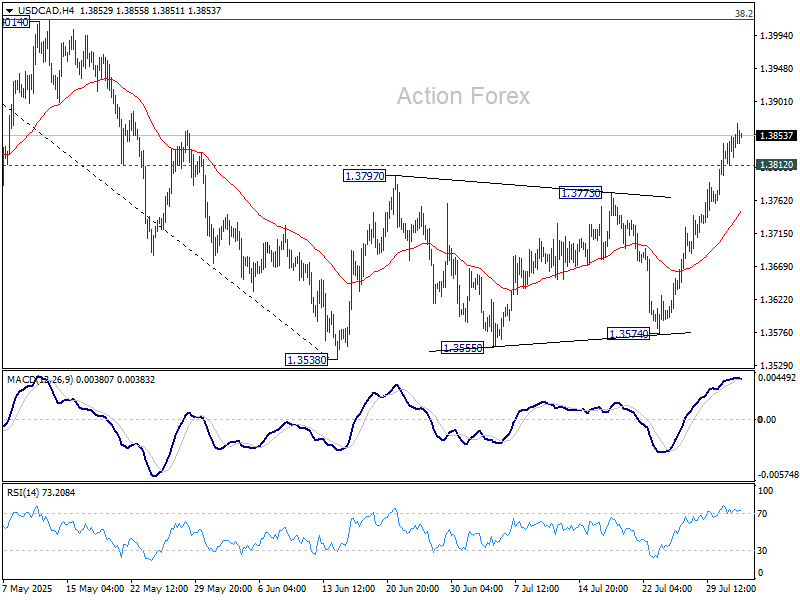
In the bigger picture, price actions from 1.4791 medium term top could either be a correction to rise from 1.2005 (2021 low), or trend reversal. In either case, further decline is expected as long as 1.4014 resistance holds. Next target is 61.8% retracement of 1.2005 (2021 low) to 1.4791 at 1.3069.
Tariff Update Sparks Limited Market Fallout, Dollar Eyes NFP for Further Gains
Asian equities slipped slight today after U.S. President Donald Trump issued a long-anticipated executive order updating tariff rates following the August 1 trade truce deadline. But losses were relatively restrained as many of Asia’s key exporters avoided the harshest duties. While tariffs now top out at 41%, nations like Thailand, Malaysia, and Taiwan saw their rates reduced from previous threats. US equity futures were also little changed while the currency markets are largely stable. As the latest trade war escalation may already be well priced in, traders are now turning attention to upcoming U.S. non-farm payroll data.
On the FX board, Dollar is easily the strongest performer for the week so far. Better-than-expected ADP and jobless claims data earlier in recent weeks have raised the likelihood of a firm NFP print. A stronger jobs number would likely reinforce the Fed’s hold stance and put further pressure on expectations for multiple cuts this year. Also in focus is ISM manufacturing report for July.
Loonie has also held up well. Trump's threat to penalize Ottawa with new tariffs over its foreign policy was shrugged off by traders, given that affected goods are outside the USMCA framework. Sterling remains solid as well, with no major data shocks and the BoE maintaining its slow-but-steady easing path.
At the weaker end, Euro leads losses, but it;s; just largely correcting its late-July rally. Swiss Franc and Kiwi are not far behind. Aussie and Japanese are trading in mid-pack territory. Yen has settled after a volatile week dominated by mixed interpretation on BoJ's stance on future rate hikes.
On the trade front, Trump’s new tariff order imposes reciprocal duties between 10% and 41% on dozens of nations. In addition, a 40% duty will apply to any transshipped goods designed to circumvent tariffs. Unlisted nations automatically fall under a 10% surcharge. These tariffs will begin on August 7 to give US customs officials time to prepare.
Among major takeaways, Switzerland and South Africa face sharp tariffs of 39% and 30%, respectively. In contrast, Thailand and Malaysia see their rates trimmed to 19%, down from 36% and 24% respectively. Taiwan will face a 20% tariff, cut from the earlier 32% level. Importantly, China remains untouched under this directive, as both sides continue to negotiate toward a longer-term deal after the 90-day truce expires on August 12.
In Asia, at the time of writing, Nikkei is down -0.64%. Hong Kong HSI is down -0.77%. China Shanghai SSE is down -0.49%. Singapore Strait Times is down -0.28%. Japan 10-year JGB yield is down -0.001 at 1.555. Overnight, DOW fell -0.74%. S&P 500 fell -0.37%. NASDAQ fell -0.03%. 10-year yield fell -0.016 to 4.360.
Gold and Silver vulnerable as strong NFP could supercharge Dollar rally
Copper’s collapse this week has triggered renewed weakness across metals, with Silver and Gold also on the back foot. However, underlying, it’s Dollar’s unrelenting strength that’s proving most punishing for precious metals. The next catalyst? The July US non-farm payroll report due today.
NFP is expected to show 102k job growth, a slight rise in the unemployment rate from 4.1% to 4.2%, and solid wage gains of 0.3% mom.
This month, only two of the usual four leading indicators are available to help guide expectations. The ADP report posted a 104k rise in private jobs, a bounce from last month’s downward surprise. Meanwhile, the 4-week moving average of initial jobless claims fell to 221k.
Taken together, these suggest a decent chance of an upside surprise in today's payrolls release. That would likely trigger further hawkish adjustment in Fed expectations. After this week’s solid GDP and Powell’s cautious tone, markets have already dialed back bets on aggressive easing.
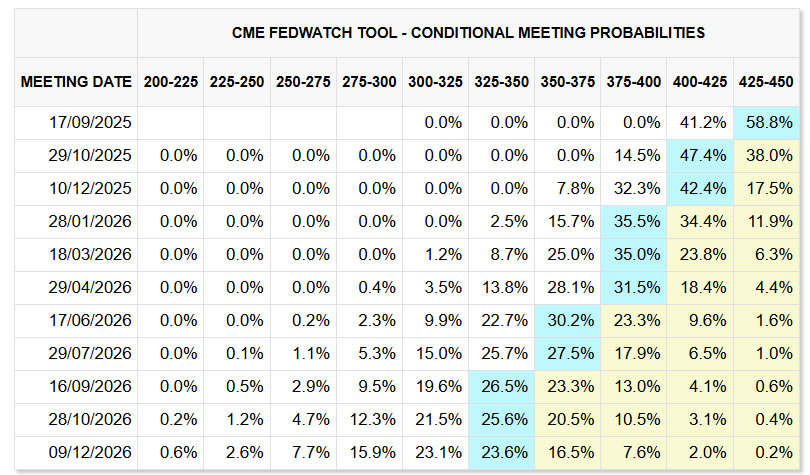
Fed fund futures are pricing just a .2% chance of a September rate cut, and only 40.1% chance of two cuts this year. A robust NFP report could shift expectations further toward a single cut in 2025, providing fresh tailwinds for the Dollar and keeping downward pressure on Gold and Silver.
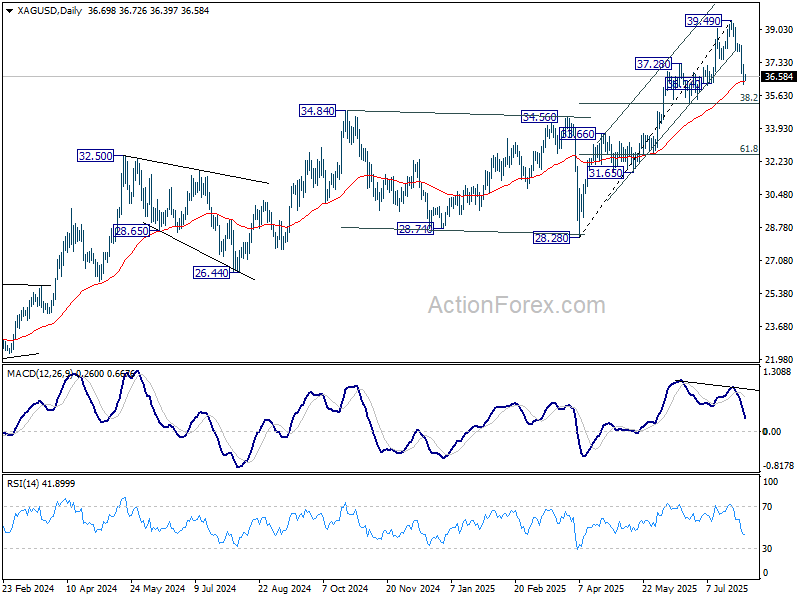
Technically, Silver's extended fall this week should confirm completion of the five-wave rally from 28.28, on bearish divergence condition in D MACD. While 55 D EMA (now at 36.33) might provide interim support, the correction from 39.49 should at least extend to 38.2% retracement of 28.28 to 39.49 at 35.20 before completion.
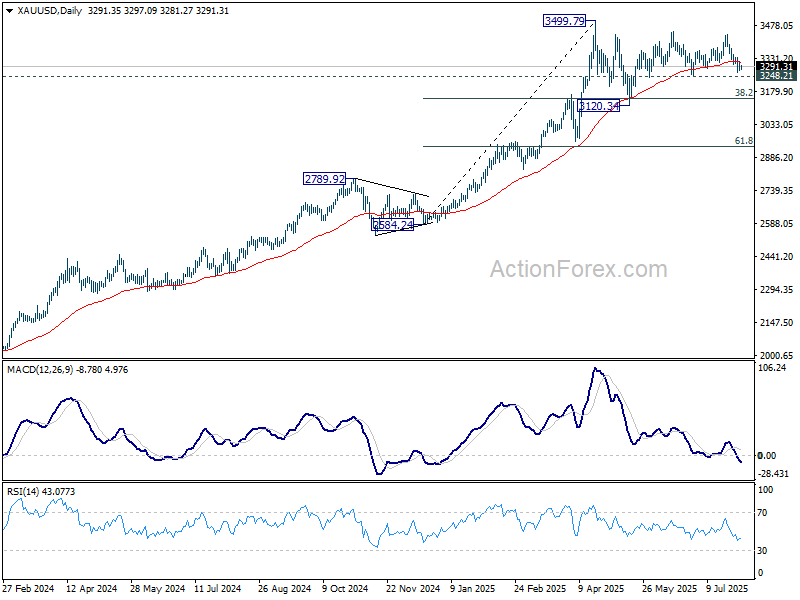
Gold is extending the medium term corrective pattern from 3499.79 high. Immediate focus is on 3248.21 support. Firm break there will open up deeper fall to test 38.2% retracement of 2584.24 to 3499.79 at 3150.04 again.
China Caixin PMI manufacturing contracts again as export demand falters
China’s Caixin Manufacturing PMI dropped from 50.4 to 49.5 in July, signaling renewed contraction in factory activity and marking the second sub-50 reading in the past three months.
S&P Global’s Jingyi Pan noted that manufacturing production declined for only the second time since October 2023, as firms pulled back operations amid cautious demand outlook heading into H2 2025.
Weaker foreign demand was again a key drag, with export orders remaining sluggish amid global trade tensions. Domestic sales saw some resilience thanks to business development efforts, but overall growth was described as “only fractional.”
USD/CAD Daily Outlook
Daily Pivots: (S1) 1.3828; (P) 1.3843; (R1) 1.3873; More...
USD/CAD's rally is in progress and intraday bias stays on the upside. Rise from 1.3538 is seen as correcting the decline from 1.4791 and would target 1.4014 cluster resistance (38.2% retracement of 1.4791 to 1.3538 at 14017). But strong resistance should be seen there to limit upside. On the downside, below 1.3812 minor support will turn intraday bias neutral first.
In the bigger picture, price actions from 1.4791 medium term top could either be a correction to rise from 1.2005 (2021 low), or trend reversal. In either case, further decline is expected as long as 1.4014 resistance holds. Next target is 61.8% retracement of 1.2005 (2021 low) to 1.4791 at 1.3069.
Gold and Silver vulnerable as strong NFP could supercharge Dollar rally
Copper’s collapse this week has triggered renewed weakness across metals, with Silver and Gold also on the back foot. However, underlying, it’s Dollar’s unrelenting strength that’s proving most punishing for precious metals. The next catalyst? The July US non-farm payroll report due today.
NFP is expected to show 102k job growth, a slight rise in the unemployment rate from 4.1% to 4.2%, and solid wage gains of 0.3% mom.
This month, only two of the usual four leading indicators are available to help guide expectations. The ADP report posted a 104k rise in private jobs, a bounce from last month’s downward surprise. Meanwhile, the 4-week moving average of initial jobless claims fell to 221k.
Taken together, these suggest a decent chance of an upside surprise in today's payrolls release. That would likely trigger further hawkish adjustment in Fed expectations. After this week’s solid GDP and Powell’s cautious tone, markets have already dialed back bets on aggressive easing.
Fed fund futures are pricing just a .2% chance of a September rate cut, and only 40.1% chance of two cuts this year. A robust NFP report could shift expectations further toward a single cut in 2025, providing fresh tailwinds for the Dollar and keeping downward pressure on Gold and Silver.
Technically, Silver's extended fall this week should confirm completion of the five-wave rally from 28.28, on bearish divergence condition in D MACD. While 55 D EMA (now at 36.33) might provide interim support, the correction from 39.49 should at least extend to 38.2% retracement of 28.28 to 39.49 at 35.20 before completion.
Gold is extending the medium term corrective pattern from 3499.79 high. Immediate focus is on 3248.21 support. Firm break there will open up deeper fall to test 38.2% retracement of 2584.24 to 3499.79 at 3150.04 again.