Sample Category Title
Sunset Market Commentary
Markets
The three biggest Euro area economies released July inflation numbers today. French prices rose 0.3% m/m to be up a June-matching 0.9% on a yearly basis as energy was still heavily weighing on inflation. Italian inflation meanwhile dropped 1% on a monthly basis with the year-on-year print easing from 1.8% to 1.7%. Both countries nevertheless slightly topped expectations. Germany on the other hand missed them by a slight margin with the harmonized price index adding 0.4% m/m and 1.8% y/y, the first sub 2% reading in 10 months. Taken together and considering yesterday’s Spanish outcome (2.7% vs 2.6% expected), risks if any, for tomorrow’s European inflation figure, are marginally tilted to the upside. The bar is set 1.9% for the headline series (down from 2%) and 2.3% for the core gauge (same as in June). The near-consensus data had little impact on markets. The front end of European yield curves left the early lows of the day in the wake of the French release and now trade around 1 bp higher in the German case. Money market bets for additional rate cuts by ECB were lowered and are currently no higher than 70% (March 2026). In the US, government officials including Treasury Secretary Bessent are lashing out at the Fed for not cutting rates at yesterday’s meeting again. The USTS said to expect a candidate for his successor by the end of the year. He also expects current chair Powell to leave the board once his terms at the helm of the Fed ends in May 2026, saying that there “will be two seats opening up on the Fed board”. Fed governor Adriana Kugler’s seat is the other one as her term ends in January 2026. And yet, today’s, be it mostly-second tier, US eco data appear to vindicate the Fed’s approach of a wait and see. June personal income was slightly better than expected while spending picked up 0.3% from an upwardly revised zero-growth month of June. June PCE’s meanwhile came in higher than expected with the headline gauge rising 0.3% to 2.6% y/y and the core number adding 0.3% to 2.8%. The May figures also got a bump to 2.4% and 2.8% respectively. And weekly jobless claims printed a low 218k, bringing the 4-week MA down to 221k, the lowest since mid-April. US yields briefly ticked higher but that died out soon. Net daily changes vary between -1.2 (2-yr) and -2.5 bps (30-yr), returning some of the bps gains following yesterday’s Fed meeting.
The dollar recovery of the last couple of days is running into resistance today but losses against G10 peers are limited. EUR/USD tried to keep the 1.1431 support alive but for now fails in doing so (1.1417). DXY remains just inches way from the symbolical 100 barrier. The Japanese yen initially welcomed the beefed up BoJ inflation forecast this morning as being one step closer to a rate hike. But then governor Ueda poured cold water on those bets. He stressed that the US-Japanese trade deal didn’t suddenly lift all of the trade fog and that uncertainty remains very high. USD/JPY turned losses into solid gains that push the pair north of 150 for the first time since Trump’s April 2 Liberation Day.
News & Views
Polish inflation eased less than anticipated in July. Monthly prices rose 0.3%, bringing the yearly reading down from 4.1% to 3.1% vs 2.8% expected. Details are limited but showed that a -0.6% m/m decline in food and non-alcoholic beverages was overcompensated by a 1.1% increase for energy (electricity, gas and other fuels) and a 3.5% uptick for personal transport equipment fuels. The National Bank of Poland in its early July meeting had projected that inflation would fall below the upper bound of the 2.5% +/- 1 ppt tolerance range and decided to lower the reference rates by 25 bps as a result to 5%. Polish money markets are expecting several more rate cuts this year to around 4.5%. The Polish zloty’s reaction was muted with EUR/PLN trading at an unchanged 4.28 level today.
Hungarian prime minister Orban announced a housing subsidy for public servants of HUF 1mln. The pledge comes as the PM struggles in the opinion polls going into parliamentary elections next year and follows a series of other spending measures including big income tax cuts and a subsidized mortgage scheme that increasingly pressure an already strained budget. Despite the new fiscal incentives, Orban’s cabinet remains committed to keep the budget deficit at 4.1% this year.
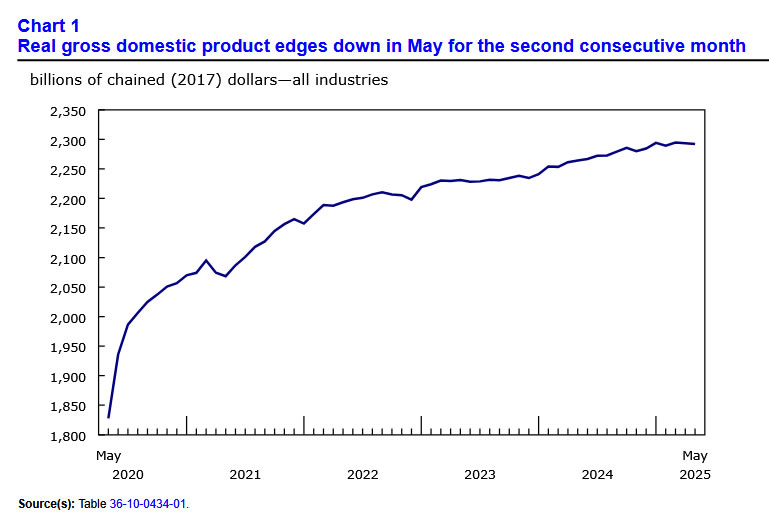
Canada’s Economy Sputters in May; June Growth to Tick Back Up
Canadian GDP in May printed in line with expectations, falling for a second consecutive month by 0.1% month-on-month (m/m). GDP growth in June is expected to tick higher, reversing some of this month's pullback.
Compositionally, 13 of 20 industries registered a decrease on the month. Goods industries contracted again (-0.1% m/m), while the services sector remained flat.
On the goods side, the manufacturing sector bounced back modestly (0.7% m/m) after a larger contraction the month prior. Routine maintenance in the oil patch drove mining/quarrying/oil & gas sector down 1% m/m in May. Elsewhere, the agriculture, utilities, and construction sectors all registered slight declines.
On the services side, the transportation and warehousing sector edged ahead by 0.6% m/m, with most subsectors expanding in May. Meanwhile, the real estate sector grew for a second consecutive month (0.3% m/m) on the back of rising home sales. A 4.8% m/m slowdown in motor vehicle sales and a 0.2% decline in the public sector aggregate counterbalanced services gains.
The advanced guidance for a 0.1% m/m increase in June GDP is driven by increases in retail and wholesale trade and partially offset by a decrease in manufacturing.
Key Implications
May's weak GDP reading came as no surprise as tariff-related headwinds continue to blow. For the time being, industry data suggest Q2 GDP effectively flat. While this would represent a sharp pullback from Q1 growth, it would be a better outcome than the BoC's most recent guidance for second quarter growth. Past this, the outlook continues to face considerable uncertainty, not least since Canada and U.S. officials have yet to strike a trade deal.
The Bank of Canada will take this reading in stride, as they continue to weigh softening economic growth against ongoing underlying inflation pressures. At their meeting this week, the Bank decided to hold the policy rate steady at 2.75%, but did not close the door to additional rate cuts. With excess supply building in the economy and inflation showing some signs of containment, we believe there is room to lower the policy rate later this year.
EUR/USD Mid-Day Outlook
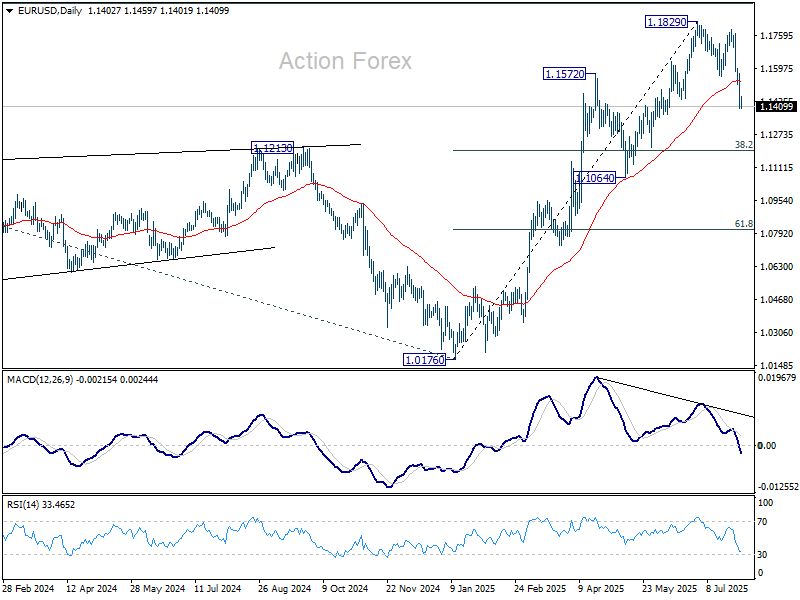
Daily Pivots: (S1) 1.1346; (P) 1.1459; (R1) 1.1518; More...
EUR/USD's fall from 1.1829, as a correction to rally from 1.0176, is in progress. Intraday bias stays on the downside for retracement of 1.0176 to 1.1829 at 1.1198. On the upside, break of 1.1555 support turned resistance is needed to indicate short term bottoming. otherwise, risk will stay on the downside in case of recovery.
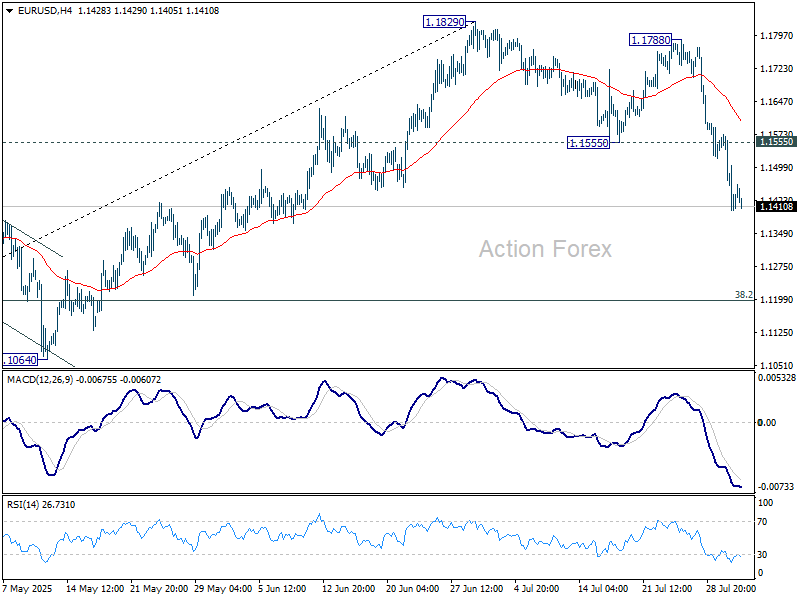
In the bigger picture, rise from 0.9534 long term bottom could be correcting the multi-decade downtrend or the start of a long term up trend. In either case, further rise should be seen to 100% projection of 0.9534 to 1.1274 from 1.0176 at 1.1916. This will remain the favored case as long as 1.1604 support holds.
GBP/USD Mid-Day Outlook
Daily Pivots: (S1) 1.3183; (P) 1.3284; (R1) 1.3341; More...
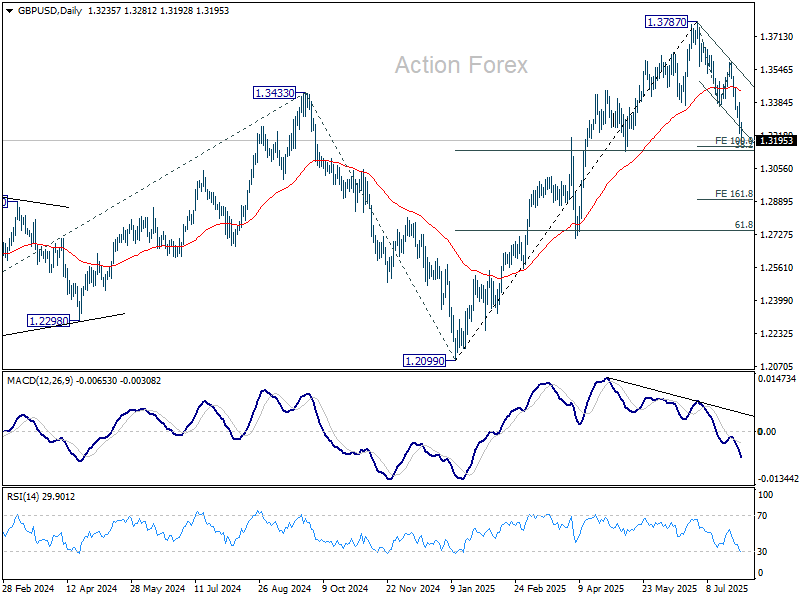
GBP/USD's fall from 1.3787 accelerates lower today and intraday bias remains on the downside for 100% projection of 1.3787 to 1.3363 from 1.3587 at 1.3163. Firm break there will target 161.8% projection 1.2901 next. On the upside, above 1.3281 minor resistance will turn intraday bias neutral first. But risk will stay on the downside as long as 1.3363 support turned resistance holds, in case of recovery.
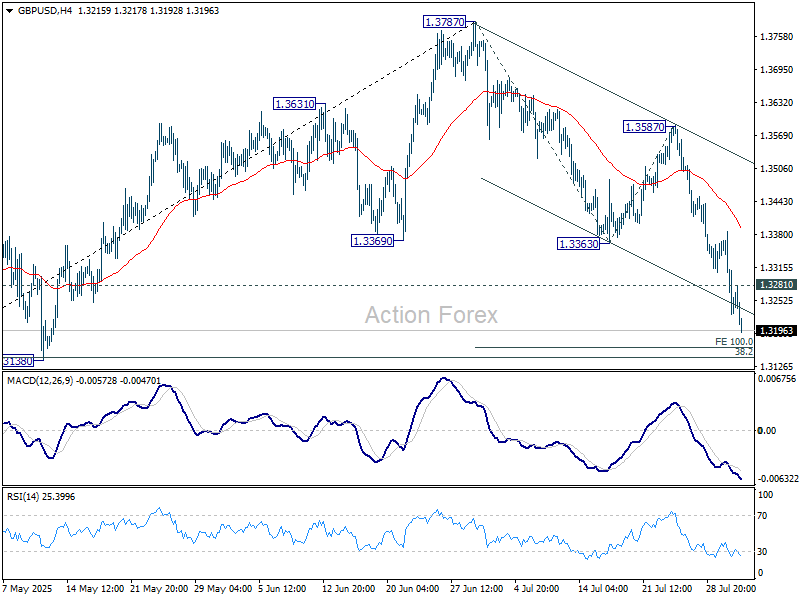
In the bigger picture, up trend from 1.3051 (2022 low) is in progress. Next medium term target is 61.8% projection of 1.0351 to 1.3433 from 1.2099 at 1.4004. Outlook will now stay bullish as long as 55 W EMA (now at 1.3045) holds, even in case of deep pullback.
USD/CHF Mid-Day Outlook
Daily Pivots: (S1) 0.8075; (P) 0.8113; (R1) 0.8189; More….
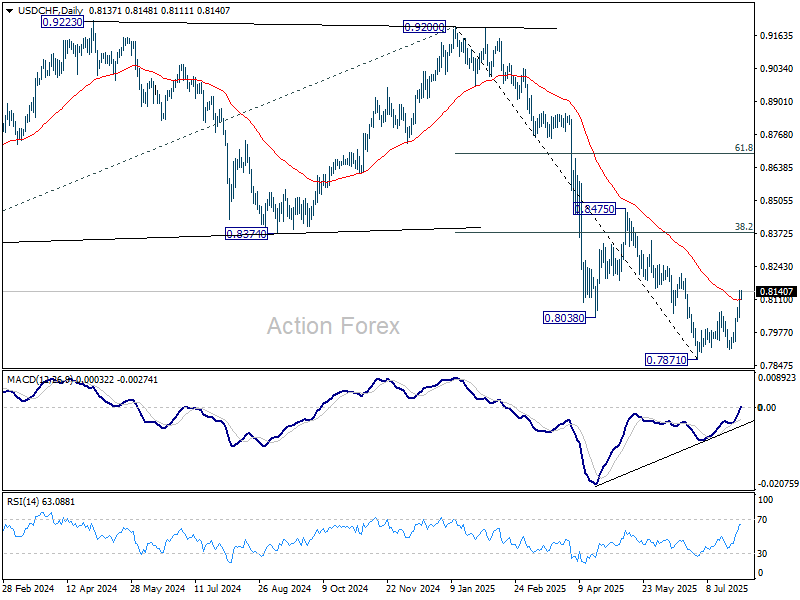
USD/CHF's rally is in progress and intraday bias stays on the upside. Rise from 0.7871 is at least corrective fall from 0.9200. Further rise should be seen to 38.2% retracement of 0.9200 to 0.7871 at 0.8379 next. On the downside, below 0.8037 minor support will turn intraday bias neutral and bring consolidations first.
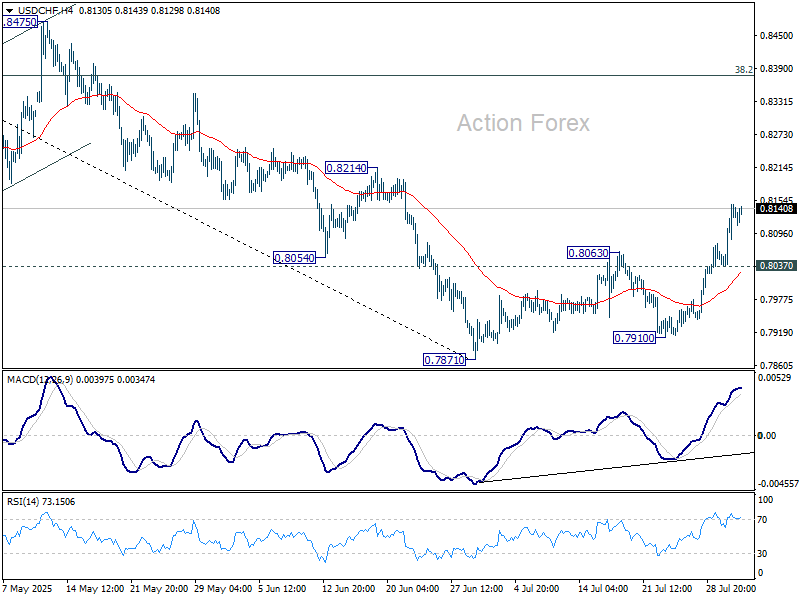
In the bigger picture, long term down trend from 1.0342 (2017 high) is still in progress. Next target is 100% projection of 1.0146 (2022 high) to 0.8332 from 0.9200 at 0.7382. In any case, outlook will stay bearish as long as 0.8475 resistance holds.
US: Consumer Spending Improves Humbly in June, Core PCE Inflation Ticks Up Modestly
Consumer spending and income growth both improved in June. Personal income rose 0.3% month-over-month (m/m), a hair above the market consensus forecast for a gain of 0.2% m/m. Growth in wages and salaries eased to 0.1% m/m from 0.3% previously, but transfer payments rebounded from a weak showing in May.
Consumer spending grew at 0.3% m/m too, in nominal terms. With income and spending growing at a similar pace, the personal savings rate remained unchanged at 4.5%.
On an inflation-adjusted basis, spending rose 0.1% m/m, coming on the heels of a 0.2% drop in the month prior. Goods spending grew at 0.1% m/m, as a continued decline in durable goods (owing in part to a pullback in vehicle sales) was offset by a decent gain in non-durable goods that month. Services grew at a similar clip to goods, expanding at 0.1% for the third month in a row.
Inflationary pressures recorded a small uptick on a month-to-month basis, with core PCE – the Fed's preferred inflation gauge – rising by 0.3% m/m from the 0.2% pace in the two months prior. In annual terms, core PCE inflation held steady at a pace of 2.8%.
Key Implications
Yesterday's GDP report showed an improvement in consumer spending in Q2, but the June data shows that the quarter ended on a soft note. Goods spending managed to hold its own despite a continued decline in durable goods, thanks to the offset provided by a decent gain in non-durables. But, in a sign that that we're in for a slower period, spending in the much larger and generally more stable category – services – continued to grow at a similarly modest pace of 0.1% for the third month in a row.
The Fed's preferred inflation gauge – core PCE – held flat at a slightly higher than expected 2.8% year-on-year in June, while an uptick was visible in the month-over-month and 3-month annualized terms. With inflationary pressures likely to heat-up further in the coming months alongside some easing in the labor market, we anticipate that consumer spending will see some additional easing in the third quarter.
USD/JPY Mid-Day Outlook
Daily Pivots: (S1) 148.39; (P) 148.96; (R1) 150.12; More...
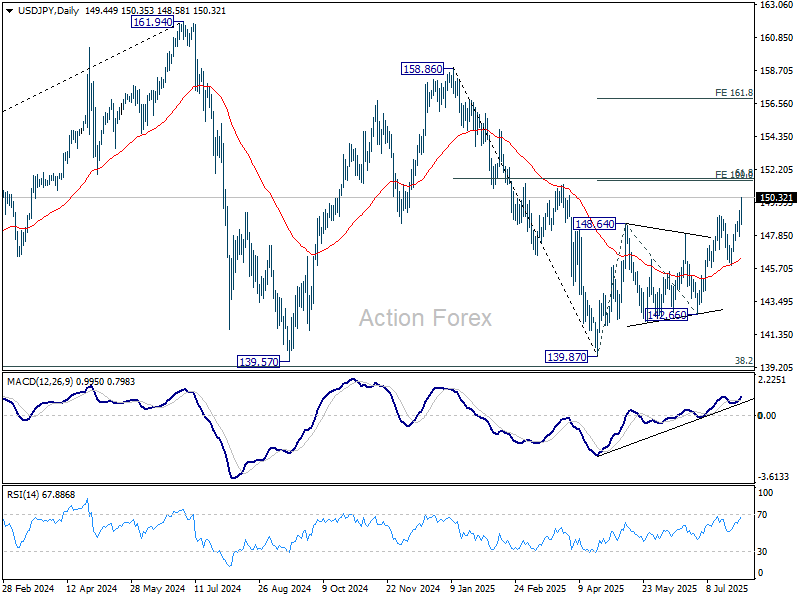
USD/JPY's rally continues today and remains on track to 100% projection of 139.87 to 148.64 from 142.66 at 151.43, which is close to 151.22 fibonacci level. Decisive break there could prompt upside acceleration to 161.8% projection at 156.84 next. On the downside, below 148.58 minor support will turn intraday bias neutral and bring consolidations first, before staging another rally.
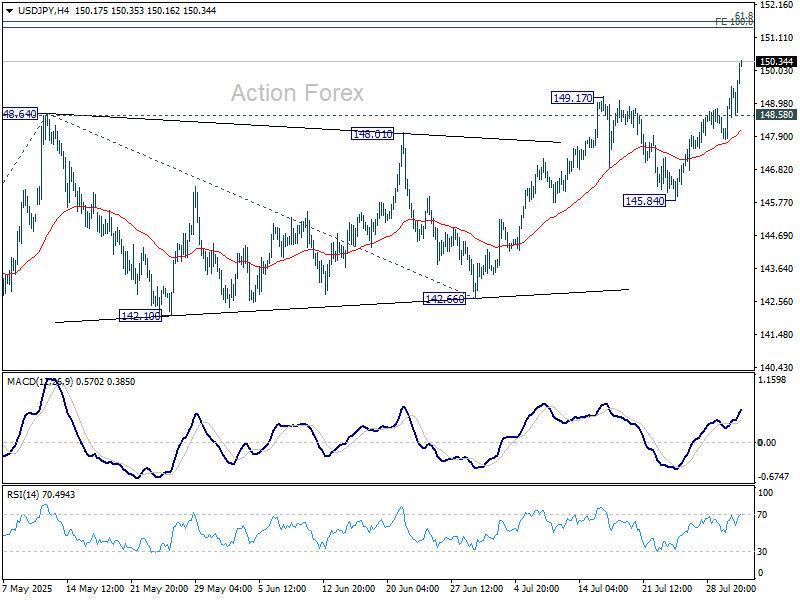
In the bigger picture, price actions from 161.94 (2024 high) are seen as a corrective pattern to rise from 102.58 (2021 low). Decisive break of 61.8% retracement of 158.86 to 139.87 at 151.22 will argue that it has already completed with three waves at 139.87. Larger up trend might then be ready to resume through 161.94 high. In case the corrective pattern extends with another fall, strong support is expected from 38.2% retracement of 102.58 to 161.94 at 139.26 to bring rebound.
Yen Reverses Hard as Market Doubts BoJ Urgency, Dollar Retains Momentum
Yen's sharp intraday reversal became the central focus in FX markets today, as traders reassessed BoJ’s latest policy guidance and economic projections. While initial positioning leaned toward hawkish interpretations, especially after last week’s US–Japan trade breakthrough, sentiment quickly pivoted as markets leaned into a more dovish read of BoJ’s inflation outlook.
On the one hand, BoJ did indicate confidence that underlying inflation would rise and stabilize around its 2% target within the projection horizon—a signal that supports gradual policy normalization. However, the near-term inflation picture was tempered. The central bank emphasized that the projected jump in core CPI to 2.7% this fiscal year was largely due to food prices, which do not reflect sustained demand-pull inflation. This cautious tone signaled no rush to raise rates again.
The reaction in FX was clear. Traders who had cut Yen shorts ahead of the meeting—in anticipation of a hawkish surprise—quickly reloaded those positions as the perceived risk faded.
Meanwhile, Dollar remains the week's top performer, underpinned by firm core PCE inflation and steady jobless claims data. Despite ongoing political pressure from US President Donald Trump to slash rates, markets continue siding with the Fed’s patient stance. Odds of a September cut have now slipped below 40%.
In broader FX rankings, Loonie and Sterling are second and third strongest this week, while Euro and Swiss Franc lag at the bottom. Aussie remains weak too, while the Yen and Kiwi sit in the mid-pack.
On the trade front, U.S. Treasury Secretary Scott Bessent said negotiations with China in Stockholm have made progress, though “a few technical details” remain. He struck an optimistic tone but admitted that Trump has yet to be briefed on the outcome. Markets are watching closely, with the August 12 truce deadline with China fast approaching.
In Europe, at the time of writing, FTSE is up 0.30%. DAX is down -0.27%. CAC is down -0.45%. UK 10-year yield is down -0.016 at 4.592. Germany 10-year yield is down -0.011 at 2.698. Earlier in Asia, Nikkei rose 1.02%. Hong Kong HSI fell -1.60%. China Shanghai SSE fell -1.18%. Singapore Strait Times fell -1.08%. Japan 10-year JGB yield fell -0.007 to 1.556.
US core PCE holds at 2.8%, income and spending rebound
Fed’s preferred inflation gauge offered little relief in June, with the core PCE index holding at 2.8% yoy, above market expectations of 2.7% yoy. Headline PCE inflation also rose more than expected from 2.4% yoy to 2.6% yoy. Both monthly readings stood at 0.3% mom, reinforcing the message that price pressures are proving sticky and raising questions about the timing of any Fed rate cuts.
On the household front, income and spending showed modest improvement. Personal income climbed 0.3% mom, rebounding from a surprise decline in May. Personal spending rose by the same margin, albeit slightly below the 0.4% mom forecast. The recovery suggests consumers remain active, but the slight miss in spending hints at growing sensitivity to price levels and borrowing costs.
Labor data, however, remained steady: initial jobless claims edged up by 1 to 218k and continuing claims were flat at 1.946 million—consistent with a still-solid employment backdrop.
Altogether, the mixed bag of sticky inflation, resilient income, and cautious consumption leaves the Fed on hold, with markets still uncertain about the case for a September rate cut.
Canada’s economy shrinks again in May, but June rebound eyed
Canada’s GDP contracted by -0.1% mom in May, marking a second consecutive monthly decline and aligning with expectations.
The decline was driven by weakness in goods-producing sectors, particularly a pullback in mining, quarrying, and oil and gas. While manufacturing managed to expand, services output was flat overall. Only 7 out of 20 industries registered growth.
However, there may be some relief on the horizon—Statistics Canada’s advance estimate suggests GDP rose 0.1% in June, with strength in retail and wholesale trade partially countered by a dip in manufacturing.
European data wrap: German CPI and Swiss retail surprise to upside
European data released today pointed to continued labor market resilience and upside surprises on inflation.
Eurozone unemployment rate held steady at 6.2% in June, defying expectations of a slight uptick to 6.3%. Across the broader EU, the jobless rate was unchanged at 5.9%, underscoring continued employment strength despite trade disruptions and slowing manufacturing activity.
In Germany, inflation pressures were firmer than expected. Headline CPI rose 0.3% mom in July, outpacing consensus for a 0.2% rise. Annual inflation held at 2.0% yoy, above the expected 1.8% yoy, suggesting steady underlying pressures even amid weaker growth. Import prices were flat on the month, beating forecasts for a modest decline of -0.2% mom, potentially limiting some disinflation via exchange rate channels.
Separately, Switzerland surprised to the upside with a 3.8% yoy surge in June retail sales, well above the 0.2% yoy consensus. The data offers a counterpoint to concerns about weakening domestic demand in the region and may reinforce the case for a patient SNB as it weighs the need to bring back negative rate.
BoJ holds at 0.50%, lifts 2025 inflation projections sharply on food costs
The BoJ kept its short-term policy rate unchanged at 0.50% as expected, reaffirming its cautious stance in the face of growing external risks. While the central bank reiterated its intention to continue normalizing policy in light of improving economic and price conditions, it also cited heightened uncertainty around global trade and policy developments as justification for a steady hand.
In its latest quarterly outlook, the BoJ sharply raised its inflation forecasts. Core CPI for fiscal 2025 was lifted from 2.2% to 2.7%. Core-core CPI, which excludes both fresh food and energy, jumped from 2.3% to 2.8%. The upward revisions were largely attributed to food price increases, though the BoJ still sees underlying inflation remaining subdued in the first half of the forecast horizon.
For fiscal 2026, core CPI was revised slightly higher from 1.7% to 1.8%, and core-core CPI from 1.8% to 1.9%. Projections for fiscal 2027 remained unchanged at 2.0% for both measures. The Bank noted that inflation will pick up toward levels “generally consistent” with the price stability target in the second half of the projection period.
Growth outlooks were little changed. The fiscal 2025 GDP forecast was lifted modestly to 0.6% from 0.5%, while estimates for fiscal 2026 and 2027 were held at 0.7% and 1.0%, respectively. The Bank continues to expect a slow but steady recovery, supported by resilient domestic demand and improvements in global conditions.
BoJ emphasized that the risk balance for growth remains tilted to the downside for 2025 and 2026, though price risks are now broadly balanced.
Asia data wrap: Japan and Australia outperform but China falters
Asian economies delivered mixed signals as fresh data highlighted strength in Japan and Australia while exposing continued softness in China.
Japan’s industrial production rose 1.7% mom in June, defying forecasts for a -0.7% mom decline. The surge was driven by a 14.8% mom jump in transport equipment excluding autos and strength in electronics, a positive surprise despite ongoing US tariffs. Retail sales also rose 2.0% yoy, slightly beating forecasts of 1.8% yoy.
Australian retail sales posted an impressive 1.2% monthly gain in June, sharply above the 0.4% mom consensus. The ABS attributed the spike to widespread discounting and new product launches.
Meanwhile, China's July PMIs disappointed. The NBS Manufacturing PMI dipped from 49.7 to 49.3, remaining in contraction for the fourth straight month. The export component showed no signs of recovery, marking 15 months of sub-50 readings at 47.1 Non-Manufacturing PMI also weakened from 50.5 to 50.1, its lowest since November.
USD/JPY Mid-Day Outlook
Daily Pivots: (S1) 148.39; (P) 148.96; (R1) 150.12; More...
USD/JPY's rally continues today and remains on track to 100% projection of 139.87 to 148.64 from 142.66 at 151.43, which is close to 151.22 fibonacci level. Decisive break there could prompt upside acceleration to 161.8% projection at 156.84 next. On the downside, below 148.58 minor support will turn intraday bias neutral and bring consolidations first, before staging another rally.
In the bigger picture, price actions from 161.94 (2024 high) are seen as a corrective pattern to rise from 102.58 (2021 low). Decisive break of 61.8% retracement of 158.86 to 139.87 at 151.22 will argue that it has already completed with three waves at 139.87. Larger up trend might then be ready to resume through 161.94 high. In case the corrective pattern extends with another fall, strong support is expected from 38.2% retracement of 102.58 to 161.94 at 139.26 to bring rebound.
Canada’s economy shrinks again in May, but June rebound eyed
Canada’s GDP contracted by -0.1% mom in May, marking a second consecutive monthly decline and aligning with expectations.
The decline was driven by weakness in goods-producing sectors, particularly a pullback in mining, quarrying, and oil and gas. While manufacturing managed to expand, services output was flat overall. Only 7 out of 20 industries registered growth.
However, there may be some relief on the horizon—Statistics Canada’s advance estimate suggests GDP rose 0.1% in June, with strength in retail and wholesale trade partially countered by a dip in manufacturing.