Sample Category Title
China Caixin PMI manufacturing contracts again as export demand falters
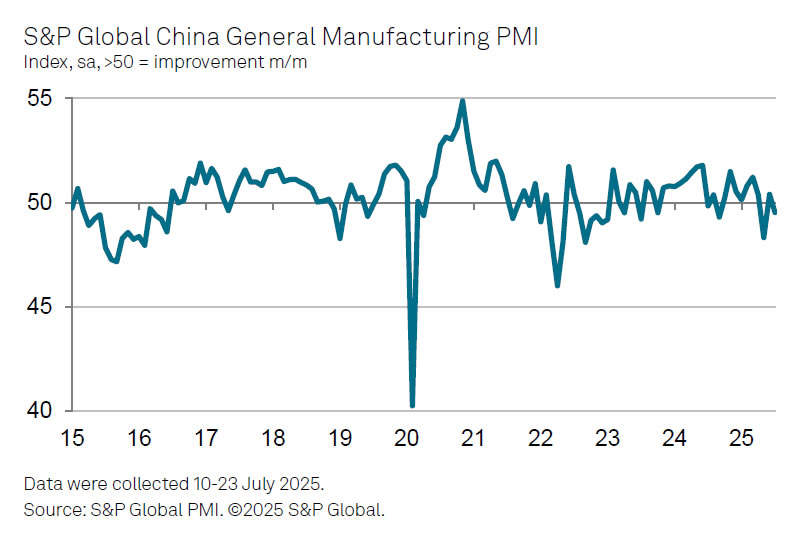
China’s Caixin Manufacturing PMI dropped from 50.4 to 49.5 in July, signaling renewed contraction in factory activity and marking the second sub-50 reading in the past three months.
S&P Global’s Jingyi Pan noted that manufacturing production declined for only the second time since October 2023, as firms pulled back operations amid cautious demand outlook heading into H2 2025.
Weaker foreign demand was again a key drag, with export orders remaining sluggish amid global trade tensions. Domestic sales saw some resilience thanks to business development efforts, but overall growth was described as “only fractional.”
August Non-Farm Payrolls Preview
The upcoming Non-Farm Payrolls (NFP) report will be released tomorrow, the same as last month’s consensus expectation of 110K.
As a reminder, the July NFP release shook markets with another positive surprise, coming in 37K stronger than the 110K Expected (+ 147K). Markets are now awaiting to see if the US can once again surprise with more upside on its Labor data.
For those newer to trading, the NFP is one of the most market-moving data releases globally. It offers insight into the health of the US labor market for the just—concluded month, with the Unemployment Rate also published at the same time.
I strongly invite you to look at our last month’s July Non-Farm Payrolls preview to learn more about why NFP matters so much for Markets (most of the info is in the introductory section).
Market moving flows as July concludes
We are concluding a strongly volatile July trading, with powerful disruptions to what was the 2025 most significant trend of US Dollar selling:
After hitting 96.40 lows on its Dollar Index (DXY), the Greenback made its way back to the 100.00 level just today after Core PCE came in stronger once again (0.3% m/m vs. 0.2% estimate).
The key question for the upcoming month is: Will the US keep beating expectations as they have done since 2024?
The answer to this will help to assess when the first FOMC rate cut of the year will take place.
All participants are getting ready for the session close which brings the usually volatile Month-End flows.
Let’s now explore:
- Seasonal trends for August payrolls
- A small look at the Dollar Index
- What potential reactions traders might expect from this key report
US Data releasing tomorrow morning, including NFP and ISM PMIs
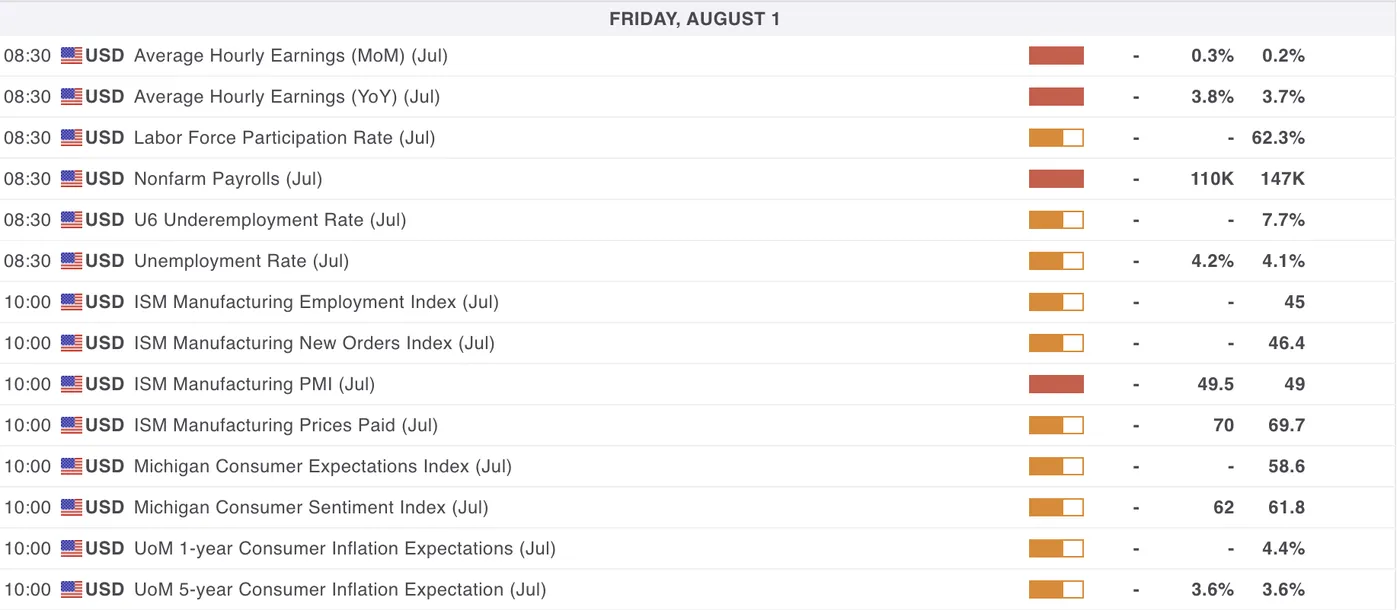
For all Market moving events, check the MarketPulse Economic Calendar
Seasonal trends for the August NFP release
August NFP (where Markets learn more about the prior month's data) averages around 160,000 since 2010, excluding 2020 and 2021 due to COVID recovery numbers significantly influencing typical trends (1.80 Million jobs created in the August 2020 NFP!).
Taking a look at the Dollar Index
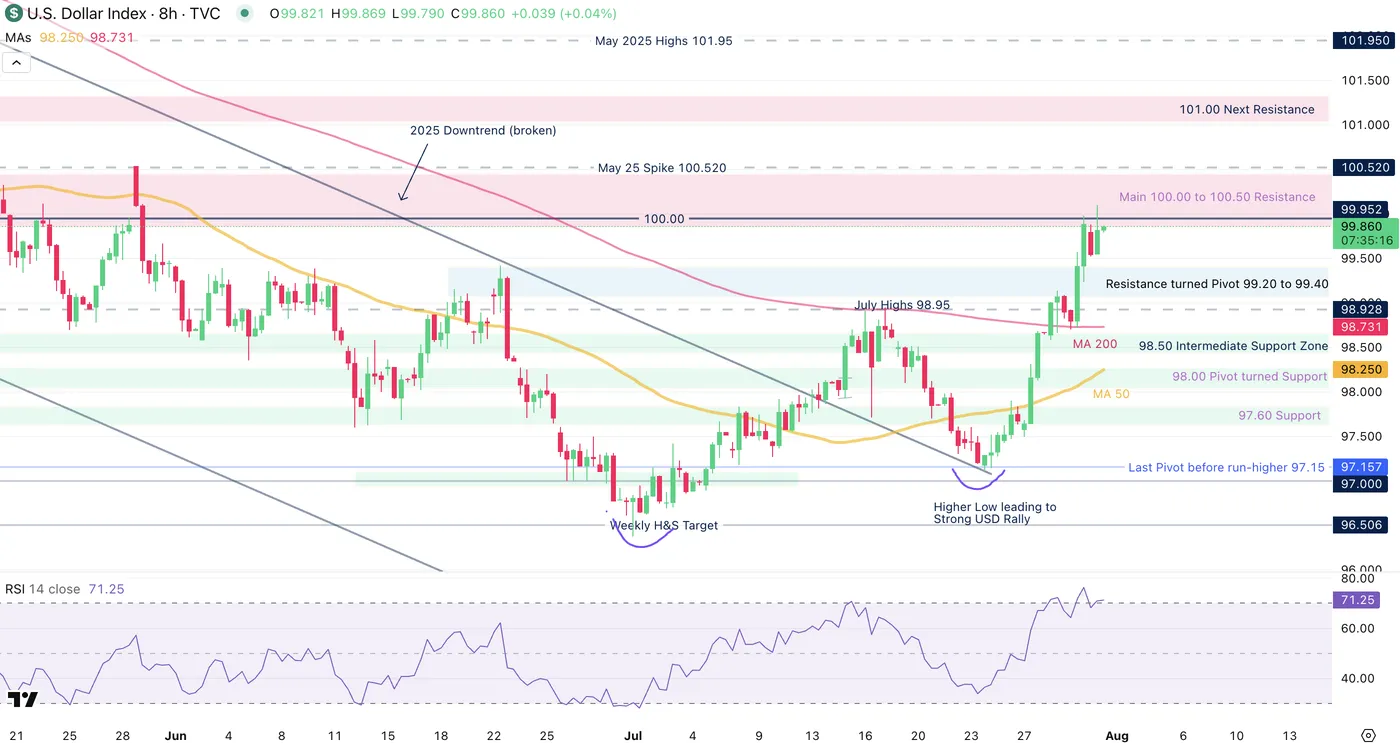
Dollar Index 8H Chart, July 31, 2025 – Source: TradingView
The US Dollar is up around 2.60% since last Thursday's lows, which is shaking up FX markets.
In our previous US Dollar analysis, we mentioned a potential Break-Retest pattern from the 2025 Downtrend and after some strong data, the rally took the index from 97.15 to some 100.12 highs in the morning session.
US Dollar strength will be a key to monitor upcoming flows in August – A significant break above the 100.00 to 100.50 Resistance should accelerate the rebuying of Dollar-selling positions.
On the other hand, staying around the 100.00 should lead to some more longer-run consolidation for currencies – A stronger Dollar may also impair Equities a tid-bit, as they are still at record-highs.
FYI, the Weekly RSI on the Dollar Index is back right at neutral levels, coming back from oversold which would re-allow a more balanced buying/selling scenarios – Markets are once again at a tipping point.
What to Expect from this Upcoming Report
This upcoming report will be even more tricky than the previous one.
Seeing the major reversal in the US Dollar, participants will look to spot if this ongoing strength is poised to cancel more of the 2025 "Dollar-selling" flows, or if a weaker employment figure would provide a good point to resume the Dollar-selling trend.
I cannot emphasize enough how important the 100.00 level is in the DXY.
What's priced in:
US Equity markets are at all-time highs and FX Majors have all corrected significantly since their July 1st highs.
Markets have reacted positively to the EU-US and Japan-US Trade Deals – More Deal announcements are expected, particularly with Mexico and China talks getting pushed back – For now, Equities are still trading in the TACO trade
Watch for potential sell-the-news on actual settlement of deals similar to what happened with the Euro.
What to expect (subject to largely different reactions as Markets are tough to predict):
Looking at the current state of pricing, Equities are at an extreme and Forex flows are more balanced after the strong July correction.
A miss would once again prompt the largest reactions, with US Dollar selling resuming in a flash, substantially higher pricing of a September cut (more cuts throughout 2025), and Equities correcting sharply.
A beat would shoot the Dollar higher yet again, with Equities following the same direction, Cuts getting priced out further towards 25 bps in 2025 and Gold would correct strongly.
An as-expected report (~ +/- 5K from the 110K expectations) would lead to a small correction in the USD and Equities, followed by more rangebound action throughout the first part of the month in the waiting of more data (Major focus on CPI).
The extent of such outcomes would depend on how large the beat/miss is.
Safe Trades for the upcoming NFP!
Upward Revision in Inflation Forecasts Won’t Move the Needle on Rates for BoJ
Despite an upward revision in the forecast for inflation, the Bank of Japan remains squarely focussed on demand-side drivers of inflation when considering the timing of the next cut.
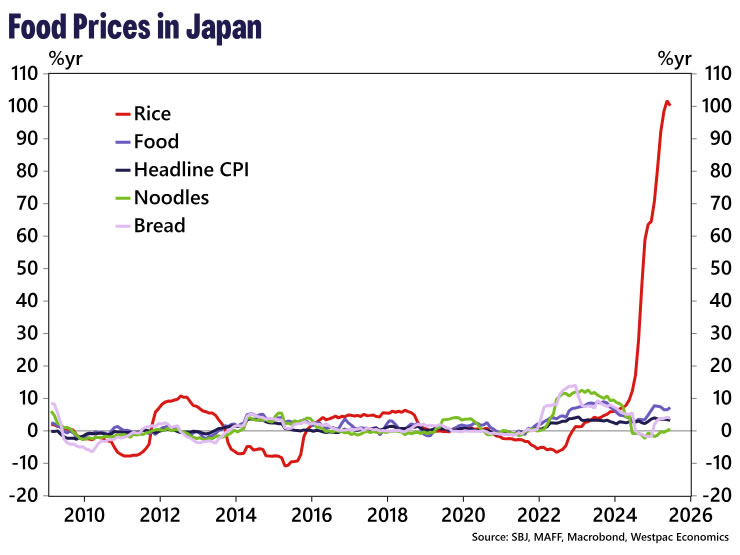
The Bank of Japan (BoJ) left its policy settings unchanged at its July meeting, but revised up its inflation outlook, particularly for FY2025 (ending March 2026). Median estimates for CPI (ex. fresh food) were nudged up to 2.7%yr for FY2025 (ending March 2026) from 2.2% previously. The revision was driven primarily by higher rice prices, which are included in the core measure. With the upward revision for FY2025 driven by a supply-side shock, the BoJ remain confident in achieving sustained inflation at their 2.0%yr target by the end of the forecast period. There were minimal adjustments to the GDP outlook despite acknowledging increased uncertainty in the global trade environment.
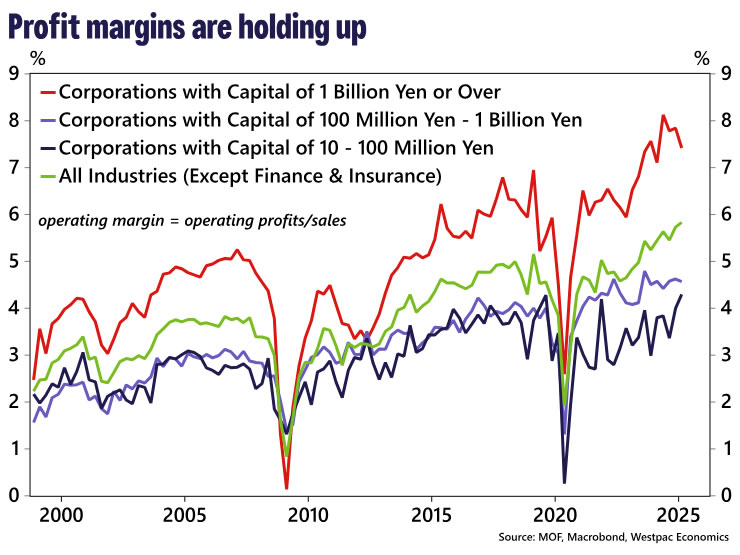
Through the remainder of FY2025, a tight labour market, alongside elevated profits, are expected to support wage gains, though the Outlook noted that “the growth rate is likely to decelerate somewhat, affected by the decline in corporate profits.” The outlook for business investment is expected to be similar, with profits still supporting critical investment, although the pace of investment is expected to “decelerate”. Beyond FY2025, strengthening profits are anticipated to support both wage and investment growth.
The next rate hike occurring in March 2026 remains our base case, following the outcome of the annual spring wage negotiations. The recent inflation upgrade was supply-driven and therefore does not alter the BoJ’s cautious stance on policy. In our view, the BoJ’s policy reaction function instead remains focused on demand-side dynamics.
That said, the BoJ has signalled that, if incoming data aligns with its projections, they will continue raising rates. If they gain sufficient confidence ahead of March, there is a risk that the next rate hike could come sooner, most likely in January 2026.
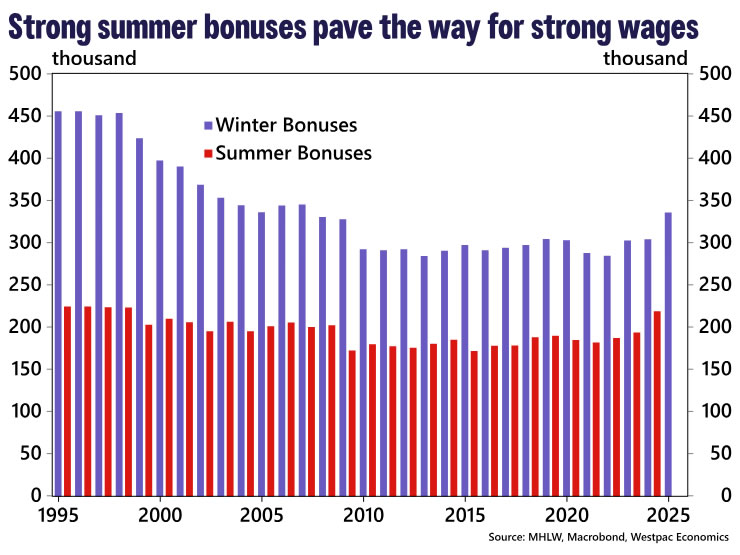
We will be paying close attention to summer bonuses data (due late August). If it prints in line with last year, it will suggest firms have both the capacity and willingness to lift wages heading into the spring wage round. This will be assessed alongside the Q2 Financial Statement data, which will provide a more accurate picture of firms’ underlying profitability. If Q2 earnings hold up, it would bolster the BoJ’s confidence that wage growth is sustainable, reinforcing the case for an earlier tightening step.
Bank of Japan Still on Course for October Hike, For Now
Summary
- The Bank of Japan (BoJ) held its policy rate steady at 0.50% at today's monetary policy meeting, a widely expected outcome.
- Today's meeting was the first decision since the trade deal agreed between the U.S. and Japan in July, meaning there was also significant interest in the BoJ's guidance on future policy. The BoJ upgraded both its GDP growth and inflation forecasts, which we view as consistent as some further eventual monetary policy tightening. At the same time, Governor Ueda made a range of comments that were mixed, but careful and cautious overall—perhaps tempering expectations of how soon the BoJ might raise interest rates.
- We expect the BoJ to hold rates steady at its next meeting in September. So long as Japanese economic activity holds up reasonably well, and a moderation in U.S. and global activity remains gradual and orderly, BoJ policymakers may have enough comfort and clarity to raise interest rates later this year. Our base case remains for the BoJ to raise its policy rate by 25 bps to 0.75% at its October announcement. That said, if Japan's economy slows especially sharply, or wage growth and domestic inflation trends undershoot, the BoJ's next rate hike could be delayed further, until January next year.
Bank Of Japan Holds Rates Steady, Gradual Tightening Still Likely
The Bank of Japan (BoJ) held its policy rate steady at 0.50% at today's monetary policy meeting, in a widely expected outcome. Today's decision was also the first announcement following the trade deal reached between the U.S. and Japan in July, which saw the two countries agree to a tariff rate of 15% on most U.S. imports from Japan, importantly including the auto sector. As a result, there was also significant interest in the central bank's updated economic forecasts, and its accompanying commentary, in terms of providing insight into the potential future path for BoJ monetary policy.
Examining the BoJ's projections, we view the central bank's updated economic forecast as consistent with some further eventual monetary tightening. Policymakers raised their Fiscal Year 2025 (April 2025–March 2026) real GDP forecast to 0.6% from 0.5% previously, but left their projections for FY2026 and FY2027 unchanged at 0.7% and 1.0% respectively. As for underlying price pressures (CPI ex-fresh food inflation), the BoJ kept raised its forecast for FY2025 to 2.7% (previously 2.2%), for FY 2026 to 1.8% (previously 1.7%) and for FY2027 to 2.0% (previously 1.9%). Importantly, the medium-term inflation forecast for fiscal 2027 is right at the BoJ's 2% inflation target. Also of note, the central bank said the risks to its inflation projections were generally balanced, compared to its previous characterization of inflation risks being skewed to the downside. Finally, in referring to economic risks from global trade policy, the central bank described those risks as "highly uncertain" rather than its previous assessment of "extremely uncertain."
In his post-meeting press conference, Governor Ueda made a range of comments that were mixed, but careful and cautious overall—perhaps tempering expectations of how soon the BoJ might raise interest rates. Among his comments, Ueda said:
- Japan's trade deal with the United States represents notable progress, but the central bank doesn't see the fog suddenly lifting over trade.
- The central bank should be able to finally judge data better after the deal, and that it would be important to monitor the impact of tariffs in hard economic data in the period ahead.
- Underlying price trends are coming closer to 2% than previously, and that the likelihood the BoJ's economic outlook will be realized has risen.
- Real interest rates are still very low and monetary policy is accommodative.
- He does not think the central bank is behind the curve in raising interest rates, nor does he think there is a high risk the central bank will fall behind the curve.
In our view, these comments suggest Ueda, and other BoJ policymakers, want to be more sure the economic damage from higher U.S. tariffs is limited overall before raising interest rates further. Among the key trends we think policymakers will want to see are a resumption of positive GDP growth, a continuation of growth in domestic demand and the extent to which negative impact of higher tariffs on Japan's exports is contained. We also anticipate the BoJ may want to see readings on sentiment surveys remain relatively favorable, and perhaps a modest firming in wage growth, and domestic inflation measures such as services inflation.
We view it as unlikely that all of these trends will be apparent by the time of the BoJ's September meeting, and accordingly, we expect the BoJ to hold rates steady at that announcement. So long as Japanese economic activity holds up reasonably well, and a moderation in U.S. and global activity remains gradual and orderly, BoJ policymakers may have enough comfort and clarity to raise interest rates later this year. Our base case remains for the BoJ to raise its policy rate by 25 bps to 0.75% at its October announcement. That said, if Japan's economy slows especially sharply, or wage growth and domestic inflation trends undershoot, the BoJ's next rate hike could be delayed further, until January next year.
USDJPY Wave Analysis
USDJPY: ⬆️ Buy
- USDJPY broke resistance zone
- Likely rise to resistance level 152.00
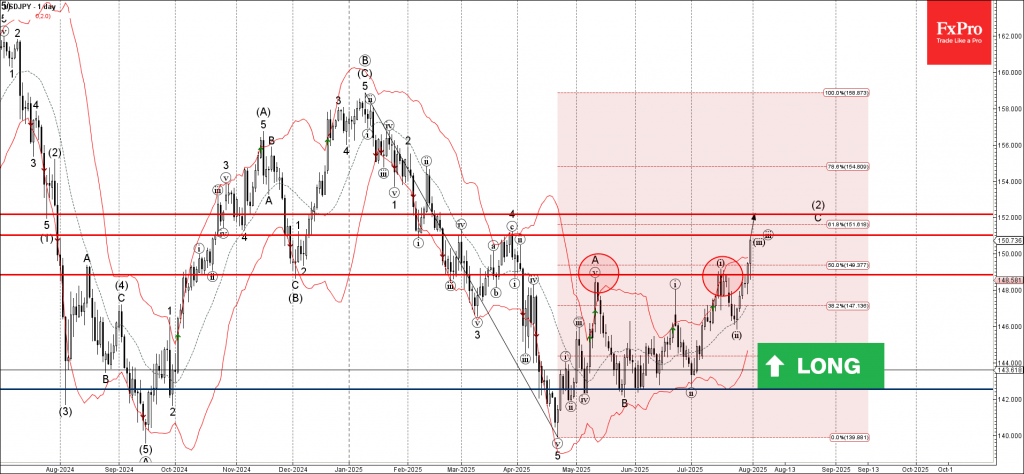
USDJPY currency pair recently broke the resistance zone located between the resistance level 148.85 (which stopped earlier waves A and i) and the 50% Fibonacci correction of the downward impulse from January.
The breakout of this resistance zone accelerated the active impulse wave c, which belongs to medium-term ABC correction (2) from April.
USDJPY currency pair can be expected to rise further to the next resistance level 152.00 (target price for the completion of the active impulse wave C).
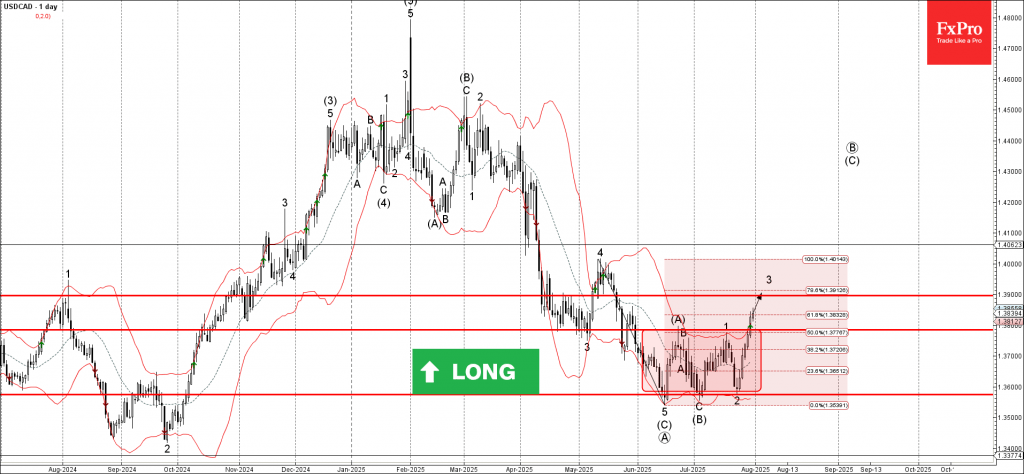
USDCAD Wave Analysis
USDCAD: ⬆️ Buy
- USDCAD broke resistance zone
- Likely rise to resistance level 1.3900
USDCAD currency pair recently broke the resistance zone located between the resistance level 1.3785 (upper border of the sideways price range from the start of June) and the 50% Fibonacci correction of the downward impulse from May.
The breakout of this resistance zone accelerated the active impulse wave 3, which belongs to medium-term impulse wave (B) from the start of July.
USDCAD currency pair can be expected to rise further to the next resistance level 1.3900 (target price for the completion of the active impulse wave 3).
Platinum Wave Analysis
Platinum: ⬇️ Sell
- Platinum broke support zone
- Likely to fall to support level 1200.00
Platinum recently broke the support zone located between the key support level 1340.00 (low of the previous minor correction iv) and the support trendline of the daily up channel from May.
The breakout of this support zone accelerated the c-wave of the active ABC correction 4.
Given the bearish sentiment across the precious metals markets, Platinum can be expected to fall to the next support level 1200.00 (target for the completion of the active wave c).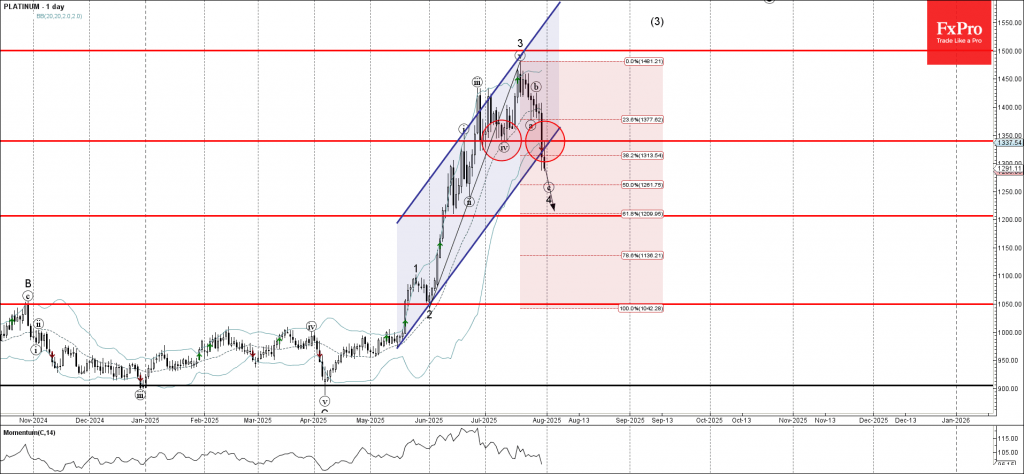
Silver (XAG/USD) Price: Down 1.5% as Trendline Break Hints at Deeper Correction
Silver prices have fallen around 4.5% over the last two trading days as a resurgent US Dollar and weaker haven flows weigh on prices.
The US Dollar remains strong, and rising US bond yields are limiting any chance of recovery for now. The Dollar’s strength is driven by hawkish comments from Fed Chair Jerome Powell, along with strong US GDP and job data. These factors support the Federal Reserve’s cautious stance on monetary policy and reduce expectations for rate cuts in the near future.
Now Silver's extended rally this year was down to a combination of factors. Those include safe haven demand, a weak US Dollar and supply demand discrepancies.
Now if haven demand remains low and the US Dollar rally continues, how deep could the pullback in silver prices be? For the record, the discrepancy between supply and demand remains in play and is highly unlikely to change anytime soon.
With that in mind and only one of the three main causes of the silver rally still present, what could the potential downside for silver be?
Technical Analysis - Silver (XAG/USD)
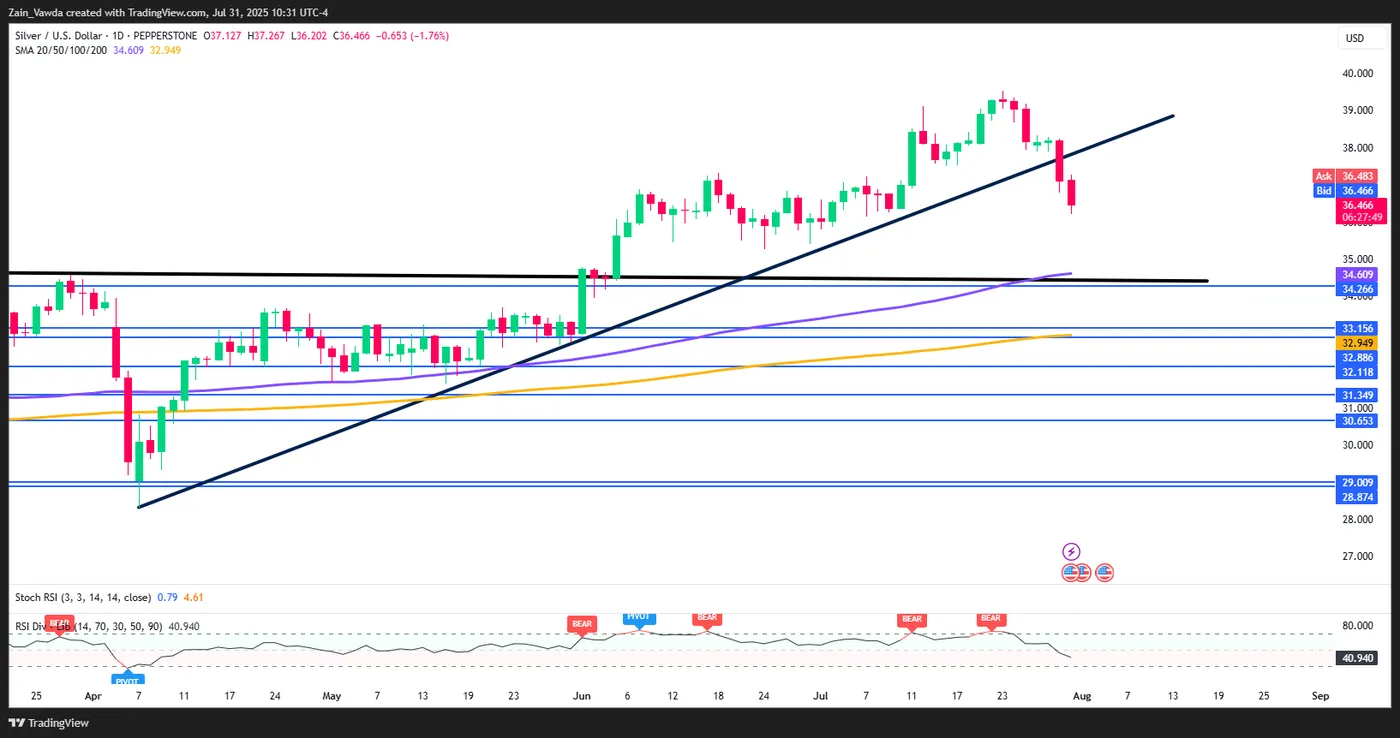
From a technical standpoint, Silver has peaked at 39.52 before falling. A brief attempt at a recovery on Monday and Tuesday has faded away thanks to Fed Chair Powell's comments yesterday.
A daily candle closed yesterday below the ascending trendline with further losses today.
The RSI period-14 on the daily chart has crossed below the 50 neutral level but remains some way off oversold conditions.
This means that further downside toward the 100-day MA at 34.60 could materialize.
Silver (XAG/USD) Daily Chart, July 31, 2025
Source: TradingView.com (click to enlarge)
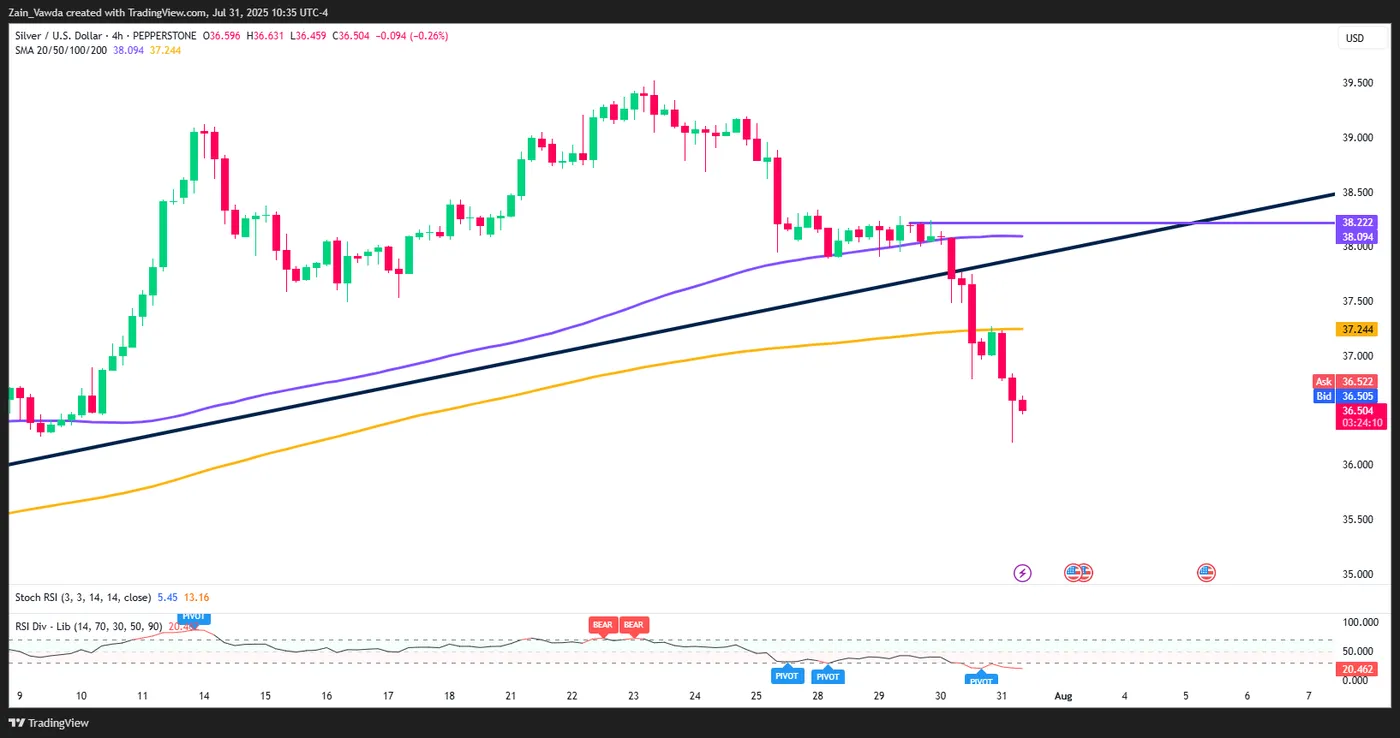
Dropping down to the four-hour chart and the picture changes slightly.
The period-14 RSI is deep in oversold territory with a potential short-term pullback a real possibility.
Looking toward the upside, resistance is provided by the 200-day MA at 37.24 and the 100-day MA at 38.09.
A four-hour candle close above the 38.22 handle would invalidate a potential bearish setup in the near-term.
Silver (XAG/USD) Four-Hour Chart, July 31, 2025
Source: TradingView.com (click to enlarge)
Support
- 36.20
- 35.26
- 34.60 (100-day MA)
Resistance
- 37.24
- 38.09
- 38.68
USDCNH May Be Resuming Its Bullish Path Toward 7.76
In recent years, the USDCNH paused its long-term attempt to strengthen against the USD. Back in February 2014, it found support at 6.0153, marking wave ((III)). What followed was textbook Elliott Wave: a zig-zag corrective structure that reached equal legs at 7.1964 in September 2019.
At that point, many expected the downtrend to resume. But renminbi had other plans.
Instead of continuing lower, the pair broke above the 7.1964 high, invalidating the simple correction thesis and hinting at something deeper: a double correction structure.
What does this mean?
- The break above 7.1964 suggests the renminbi is undergoing a complex correction, not a trend reversal.
- This opens the door to further upside in the short-to-medium term, before any sustained strengthening resumes.
- Traders should watch for internal wave subdivisions and confirmation of the second corrective leg.
When a zig-zag fails to hold, expect complexity. Double corrections often trap trend followers, structure matters more than sentiment. (If you want to learn more about Elliott Wave Theory, please follow these links: Elliott Wave Education and Elliott Wave Theory)
USDCNH July 2023 Weekly Chart
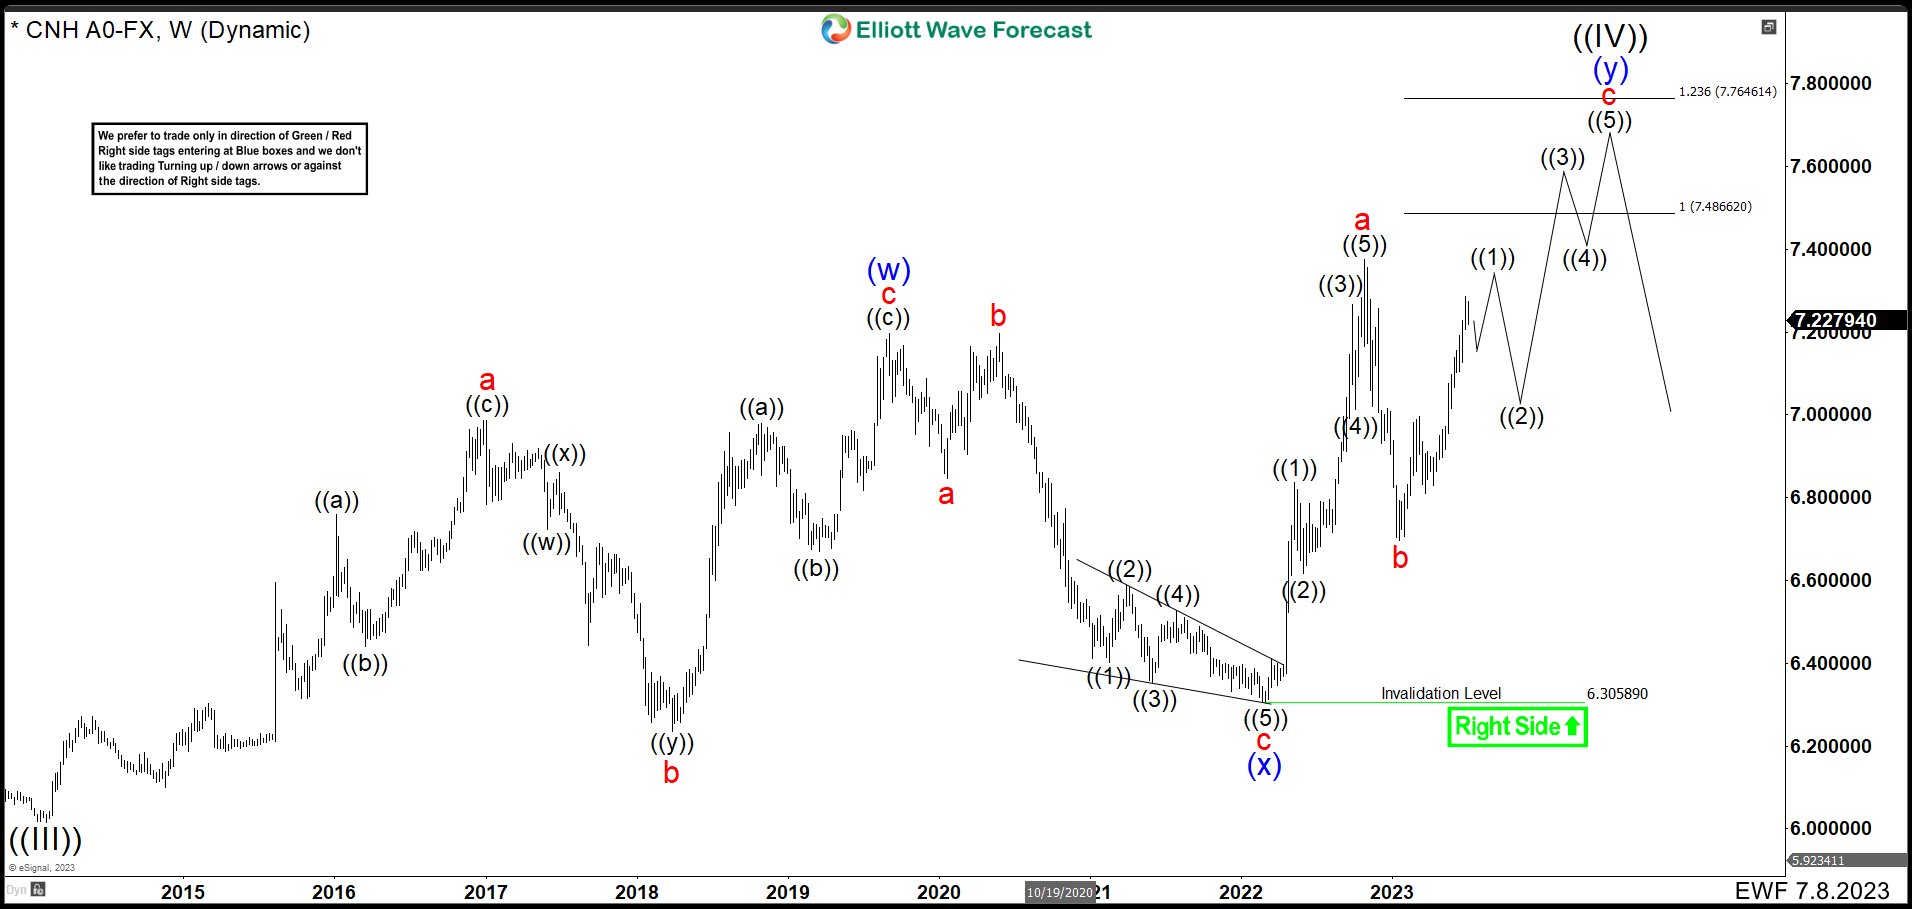
Since July 2023, USDCNH has extended its complex correction. After wave (w) peaked at 7.1974, the pair dropped in an expanded flat for wave (x), ending with a diagonal bounce from 6.3058. Momentum shifted quickly, wave “a” impulsed to 7.3748, breaking above wave (w) and confirming the bullish sequence. Wave “b” retraced to 6.6883 before price resumed higher. USDCNH is targeting the 7.4866–7.7646 zone to complete wave “c”, wave (y), and wave ((IV)), before the renminbi resumes its broader downtrend.
USDCNH March 2025 Weekly Chart
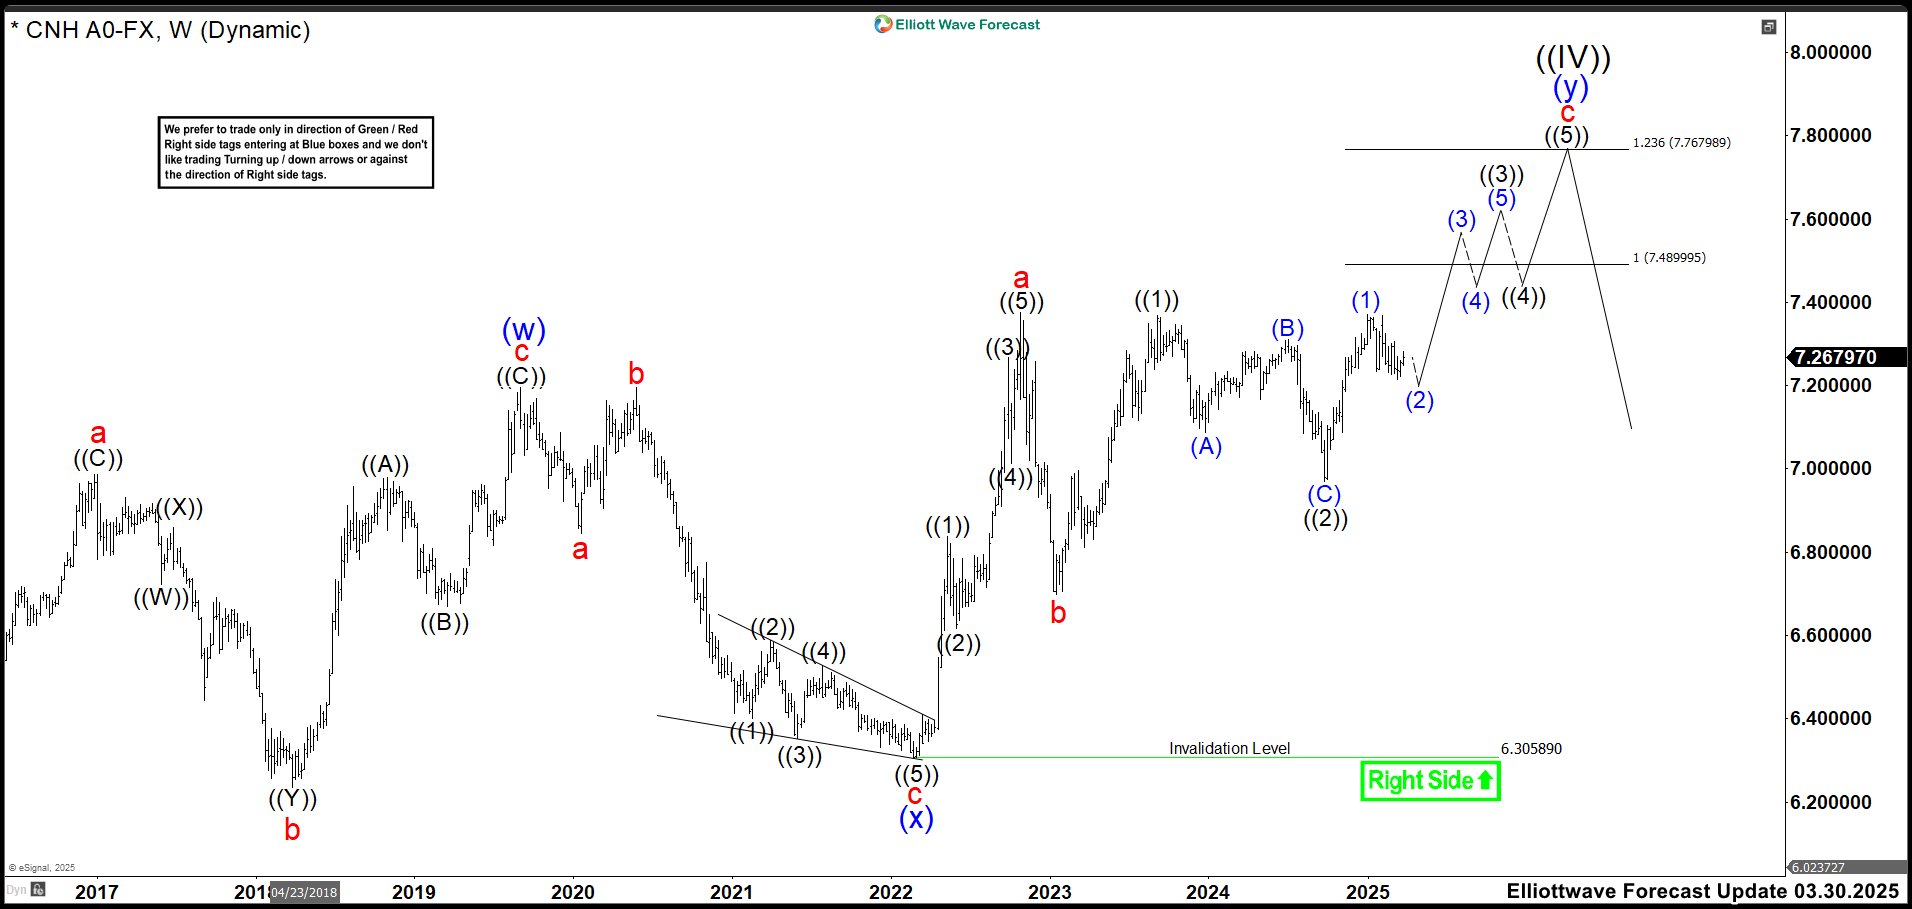
In March 2025, USDCNH rallied in wave (1) of ((3)), reaching the 7.3700 high. The move showed strength, but failed to break new highs, an early sign of hesitation. A pullback followed, likely wave (2) of ((3)), as the dollar posted its worst quarterly drop since 1973. Despite the dollar’s sharp depreciation, USDCNH didn’t mirror the move. This divergence suggests underlying strength in the renminbi’s corrective structure. The pair held firm, preserving its bullish sequence.
USDCNH July 2025 Weekly Chart
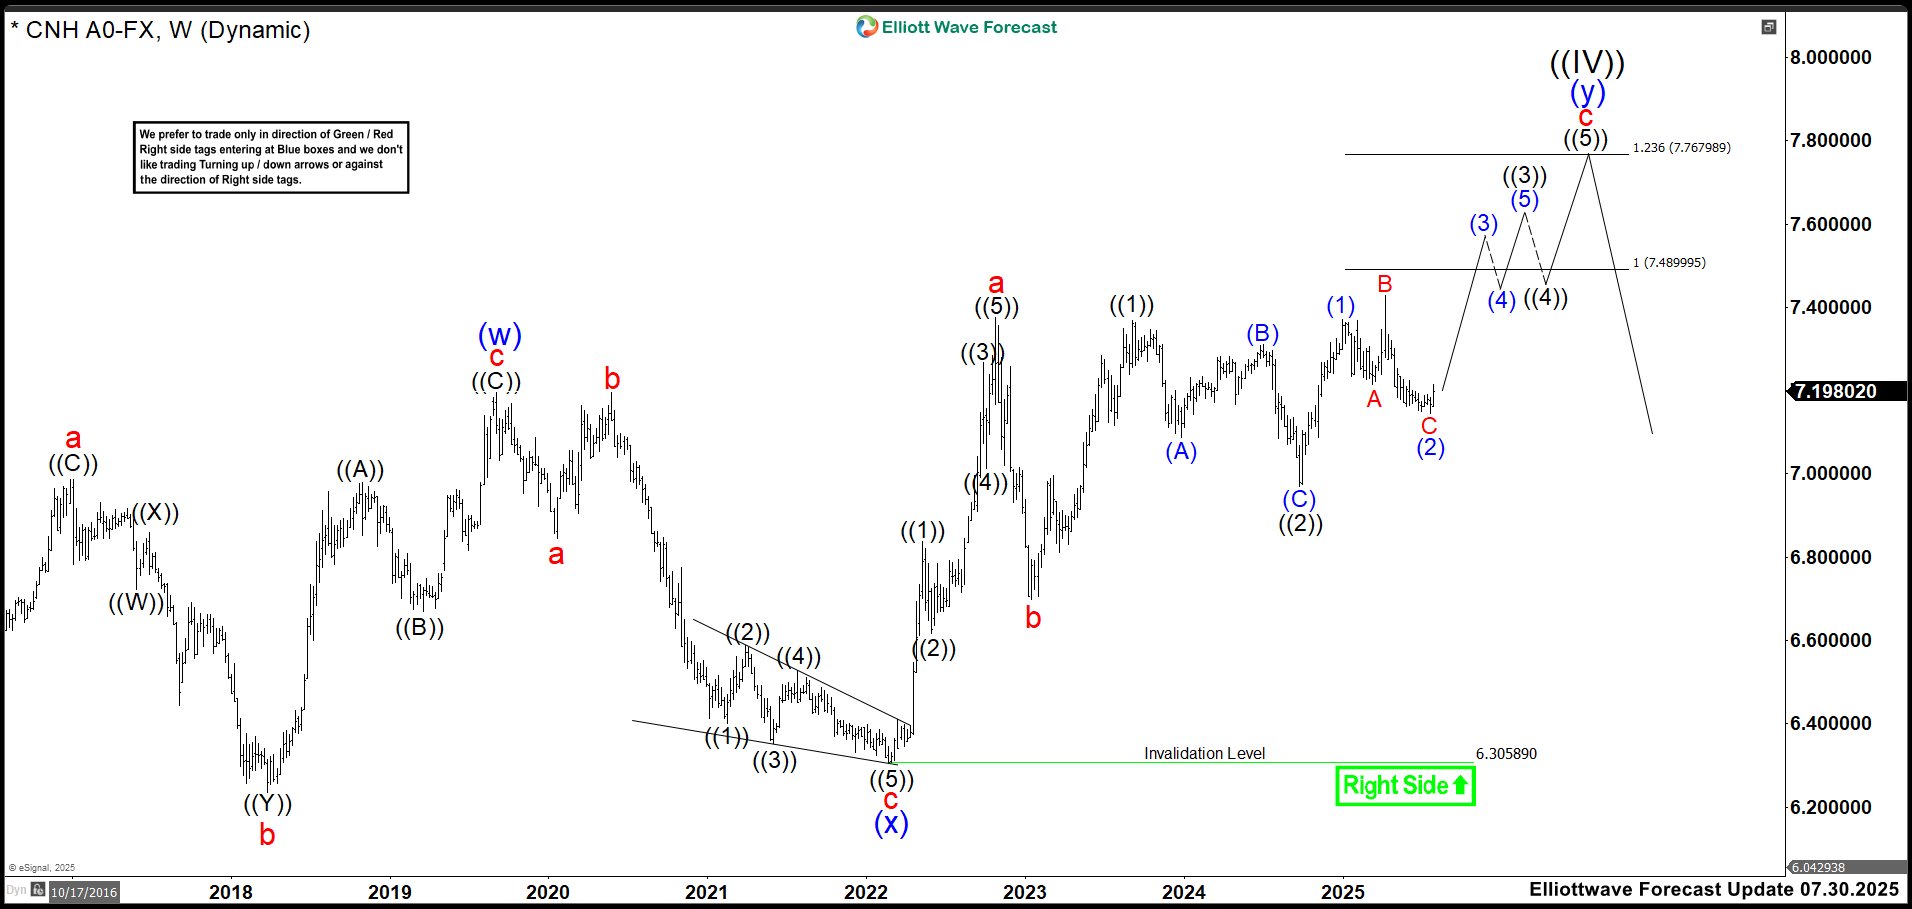
The weekly chart shows a clear breakout above the 2022 highs. This signals more upside ahead. The move broke out in a corrective fashion. Wave (2) formed an expanded flat, as you can watch on the chart. As long as USDCNH stays above wave ‘b’ at 6.6883, we expect bullish continuation. Why use the lows of wave ‘b’ and wave ((2)) as pivots? Because until price breaks above wave B’s high, we can’t rule out an expanded flat for wave ((2)). For now, we stay bullish. We expect wave (3) of ((3)) to lead the next rally. Our target remains 7.4866–7.7646. That zone would complete the correction that began in 2014.
Copper Extends Steep Fall, Sparked by Modification of Trump’s Tariff Plan for Metal’s Imports
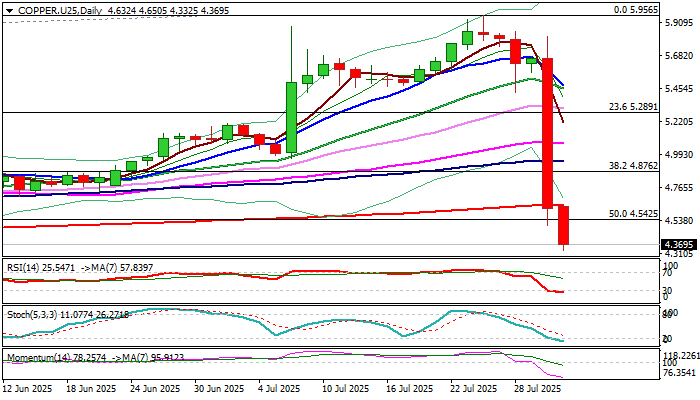
Copper remains firmly in red on Thursday after falling over 18% previous day and extends weakness to the lowest in almost four months.
Copper price collapsed from the zone near new record high after President Trump surprised markets by excluding a number of copper products from initial 50% tariff list, leaving copper pipes and wiring.
Strong market reaction, in which metal’s price erased gains from previous months, reflects the magnitude of shock produced by Trump’s latest decision.
Copper is also on track for a record weekly loss and generated strong negative signal from large monthly bearish candle with long upper shadow, which also completed bearish engulfing pattern.
Technical picture on daily chart from firmly bullish to increasingly bearish within a day, opening prospects for further easing.
Although daily studies are deeply oversold, indicators are still heading south and so far lacking any signal of correction, which should be anticipated in coming sessions after euphoria fades.
Wednesday’s close below 200DMA (4.6399) and today’s dip and likely close below 50% retracement of July 2022 / July 2025, 3.1285/5.9565, uptrend (4.5425) contributes to negative near-term outlook.
Bears found temporary footstep at 100WMA (4.3128) but keep in focus next targets at 4.2088 (Fibo 61.8%) and 4.1541 (200WMA).
Broken 200DMA (4.6399) reverted to initial resistance, while broken daily cloud top (4.8961) should cap extended upticks to keep fresh bears in play.
Res: 4.5425; 4.6399; 4.7068; 4.8762
Sup: 4.3128; 4.2088; 4.1541; 4.1000