
Sample Category Title
EUR/AUD Daily Outlook
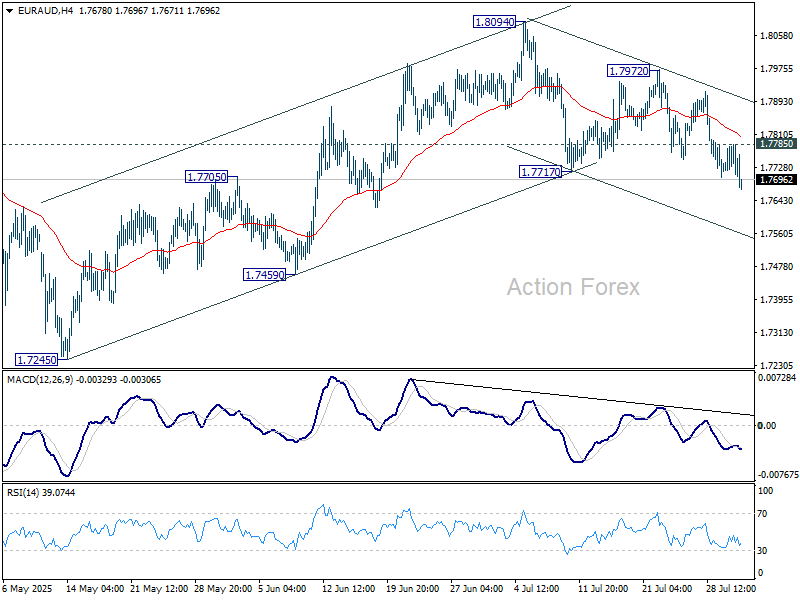
Daily Pivots: (S1) 1.7699; (P) 1.7743; (R1) 1.7771; More...
EUR/AUD's break of 0.7717 support revives that case rise from 1.7245 has completed at 1.8094. Corrective pattern from 1.8554 should now be in the third leg. Intraday bias is back on the downside for 1.7459 support first. Firm break there will solidify this case and target 1.7245 low. On the upside, though, above 1.7785 minor resistance will turn intraday bias neutral again first.
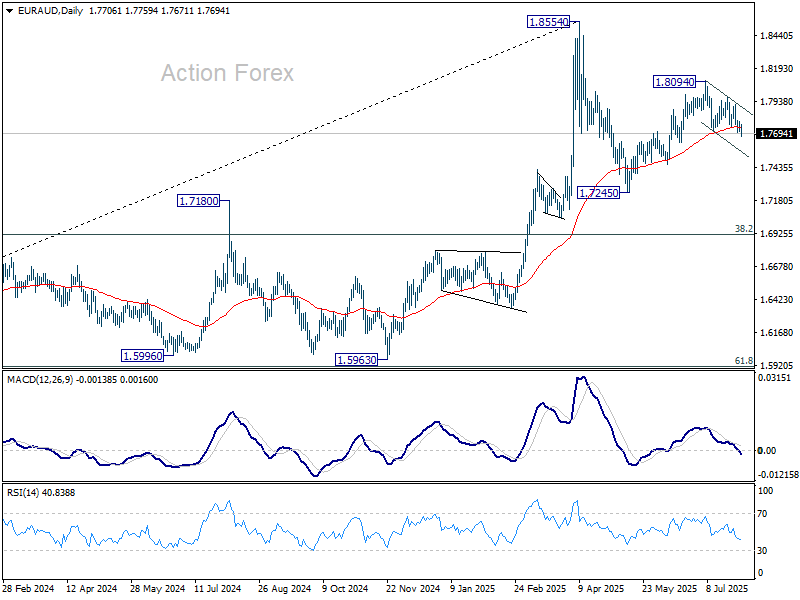
In the bigger picture, price actions from 1.8554 medium term top are seen as a corrective pattern. While deeper pullback might be seen, downside should be contained by 38.2% retracement of 1.4281 (2022 low) to 1.8554 at 1.6922 to bring rebound. Up trend from 1.4281 is expected to resume at a later stage.
EUR/CHF Daily Outlook
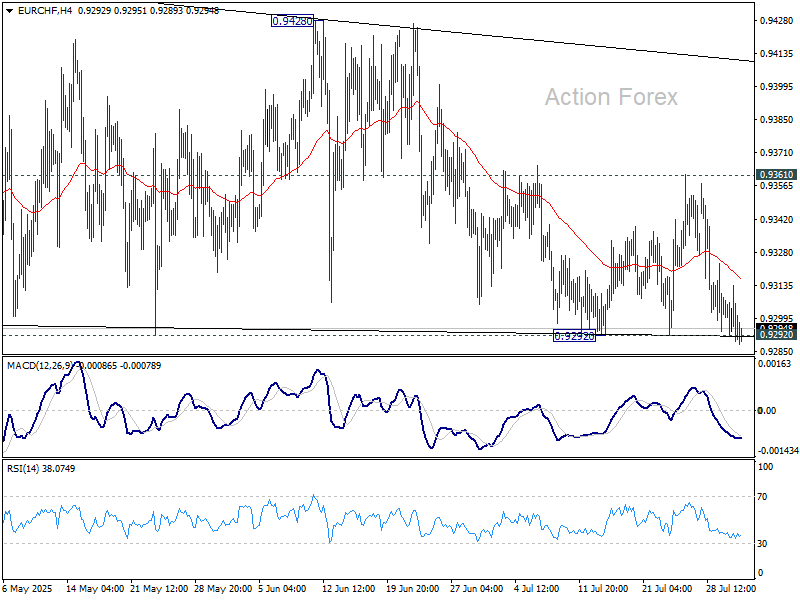
Daily Pivots: (S1) 0.9286; (P) 0.9300; (R1) 0.9310; More....
Intraday bias in EUR/CHF stays neutral at this point. On the downside, decisive break of 0.9292 support will bring deeper decline to retest 0.9218 low. On the upside, above 0.9361 will suggest that corrective pattern from 0.9445 has completed, and target 0.9428/45 resistance zone.
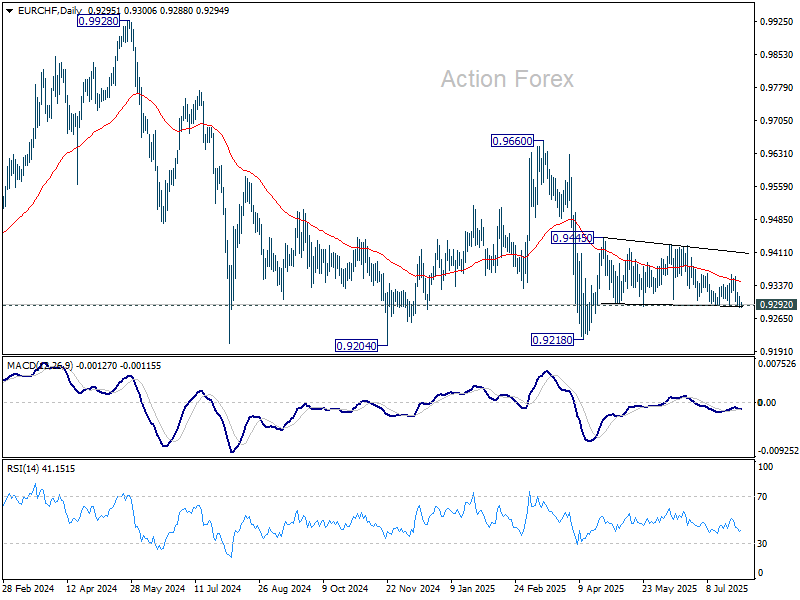
In the bigger picture, while downside momentum has been diminishing as seen in W MACD, there is no sign of bottoming yet. EUR/CHF is still staying below 55 W EMA (now at 0.9424) and well inside long term falling channel. Outlook will stay bearish as long as 0.9660 resistance holds. Break of 0.9204 (2024 low) will confirm resumption of down trend from 1.2004 (2018 high).
EUR/USD Daily Outlook
Daily Pivots: (S1) 1.1346; (P) 1.1459; (R1) 1.1518; More...
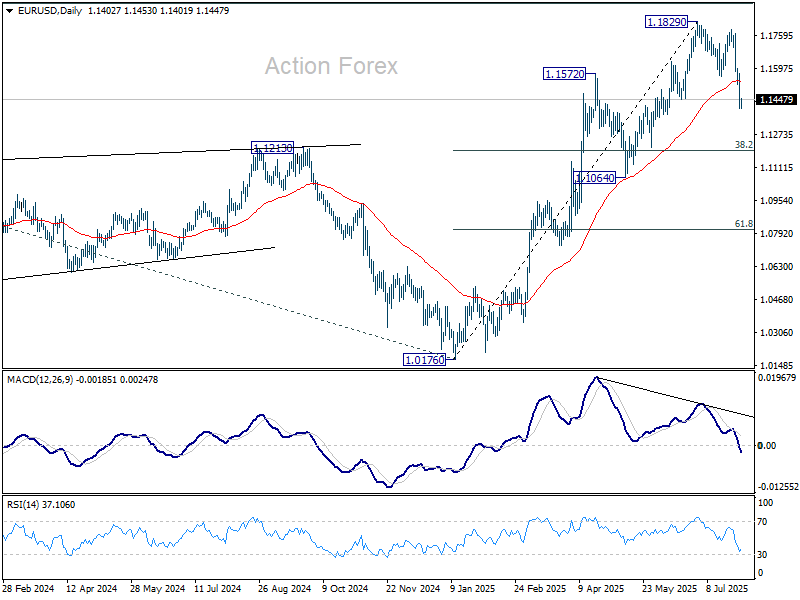
Intraday bias in EUR/USD remains on the downside for the moment. Fall from 1.1829, as a correction to rally from 1.0176, is in progress for 38.2% retracement of 1.0176 to 1.1829 at 1.1198. On the upside, above 1.1571 minor resistance will turn intraday bias neutral and bring consolidations first, before staging another decline.
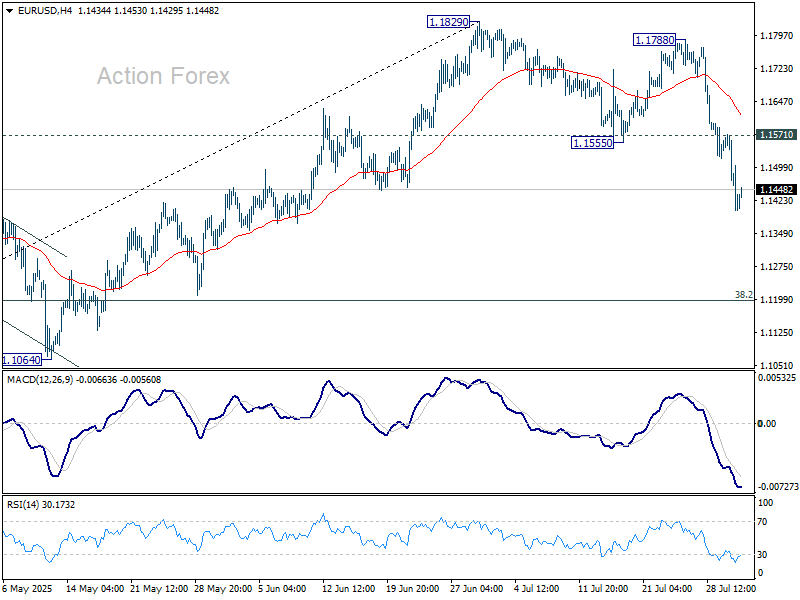
In the bigger picture, rise from 0.9534 long term bottom could be correcting the multi-decade downtrend or the start of a long term up trend. In either case, further rise should be seen to 100% projection of 0.9534 to 1.1274 from 1.0176 at 1.1916. This will remain the favored case as long as 1.1604 support holds.
GBP/USD Daily Outlook
Daily Pivots: (S1) 1.3183; (P) 1.3284; (R1) 1.3341; More...
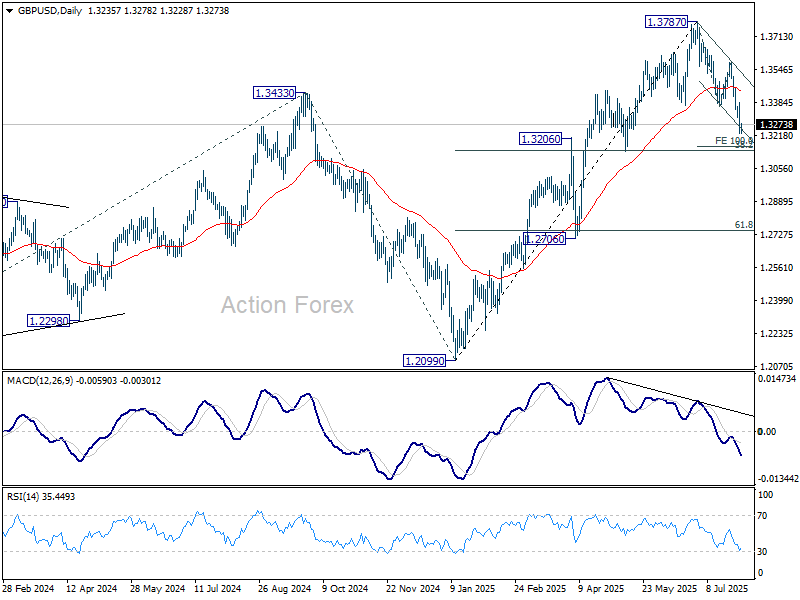
Intraday bias in GBP/USD remains on the downside at this point. Fall from 1.3787, as a correction to rise from 1.2099, is in progress. Deeper decline should be seen to 100% projection of 1.3787 to 1.3363 from 1.3587 at 1.3163. On the upside, above 1.3385 minor resistance will turn intraday bias neutral again first.
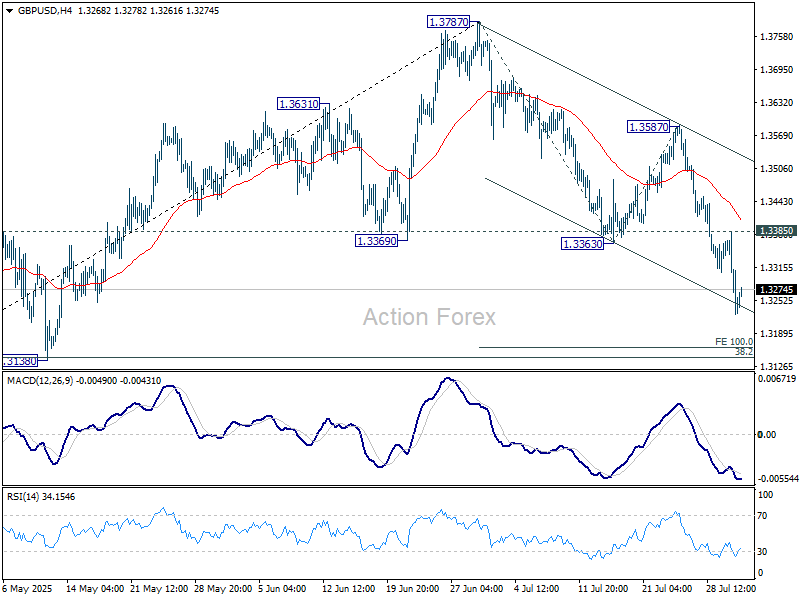
In the bigger picture, up trend from 1.3051 (2022 low) is in progress. Next medium term target is 61.8% projection of 1.0351 to 1.3433 from 1.2099 at 1.4004. Outlook will now stay bullish as long as 55 W EMA (now at 1.3045) holds, even in case of deep pullback.
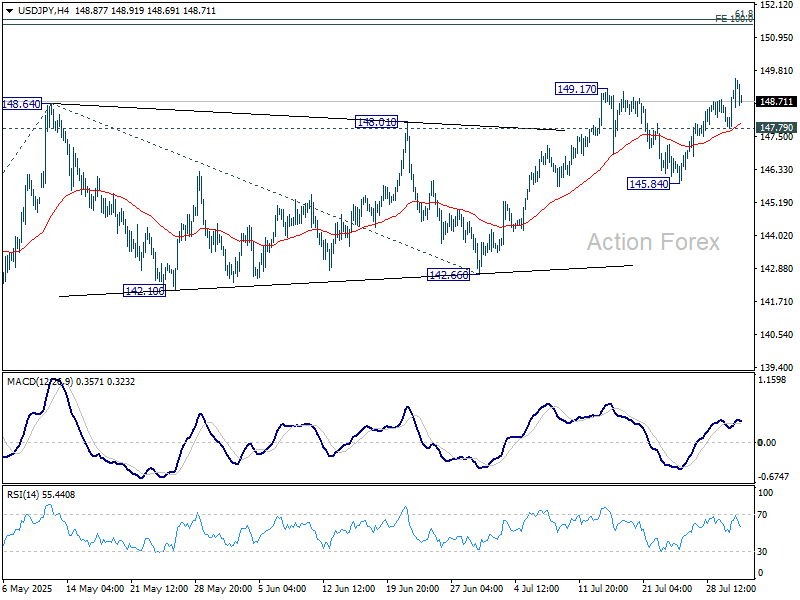
USD/JPY Daily Outlook
Daily Pivots: (S1) 148.39; (P) 148.96; (R1) 150.12; More...
Intraday bias in USD/JPY remains on the upside for the moment. The break of 149.17 resistance suggests that rise from 139.87 is resuming. Further rally should be seen to 100% projection of 139.87 to 148.64 from 142.66 at 151.43, which is close to 151.22 fibonacci level. On the downside, below 147.79 minor support will turn intraday bias neutral again.
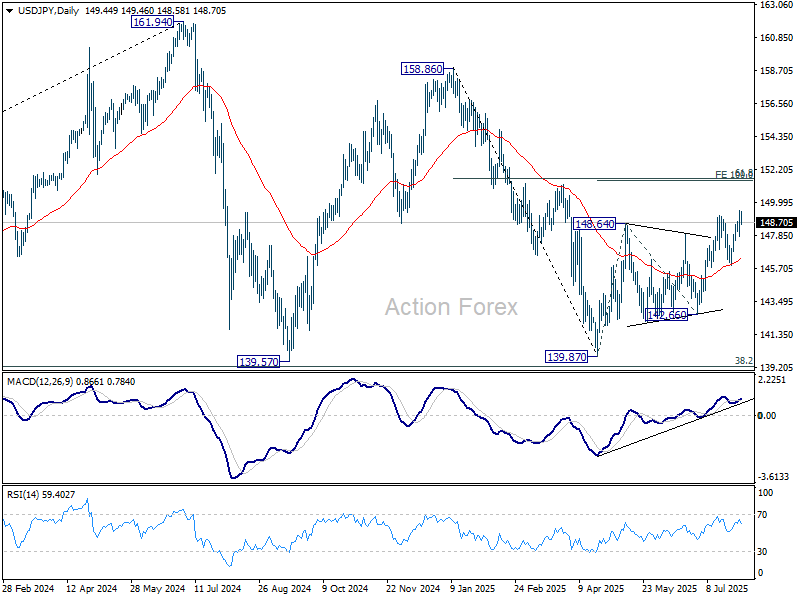
In the bigger picture, price actions from 161.94 (2024 high) are seen as a corrective pattern to rise from 102.58 (2021 low). Decisive break of 61.8% retracement of 158.86 to 139.87 at 151.22 will argue that it has already completed with three waves at 139.87. Larger up trend might then be ready to resume through 161.94 high. In case the corrective pattern extends with another fall, strong support is expected from 38.2% retracement of 102.58 to 161.94 at 139.26 to bring rebound.
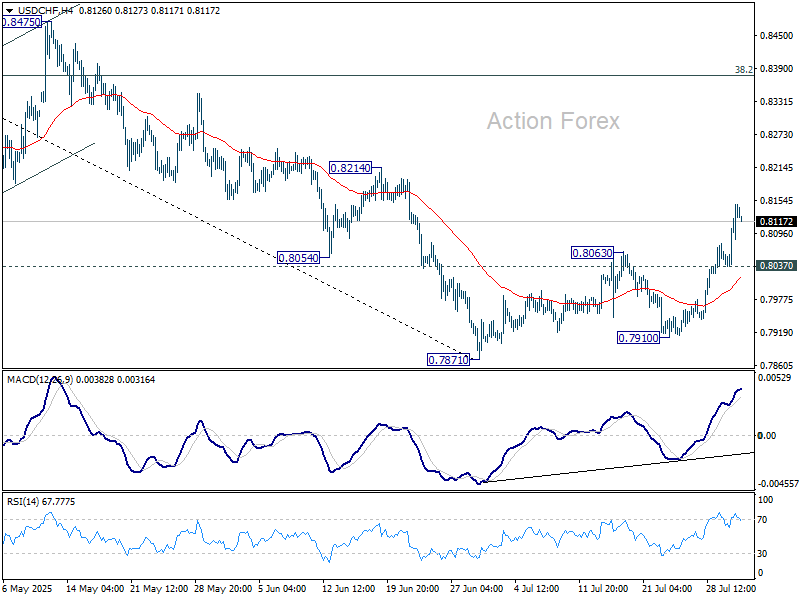
USD/CHF Daily Outlook
Daily Pivots: (S1) 0.8075; (P) 0.8113; (R1) 0.8189; More….
Intraday bias in USD/CHF remains on the upside or the moment. Rise from 0.7871 is at least corrective fall from 0.9200. Further rise should be seen to 38.2% retracement of 0.9200 to 0.7871 at 0.8379 next. On the downside, below 0.8037 minor support will turn intraday bias neutral and bring consolidations first.
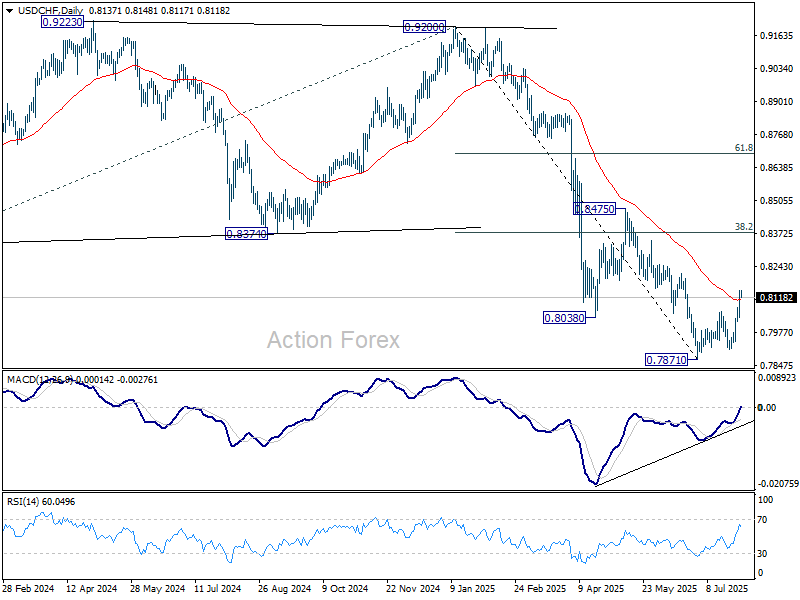
In the bigger picture, long term down trend from 1.0342 (2017 high) is still in progress. Next target is 100% projection of 1.0146 (2022 high) to 0.8332 from 0.9200 at 0.7382. In any case, outlook will stay bearish as long as 0.8475 resistance holds.
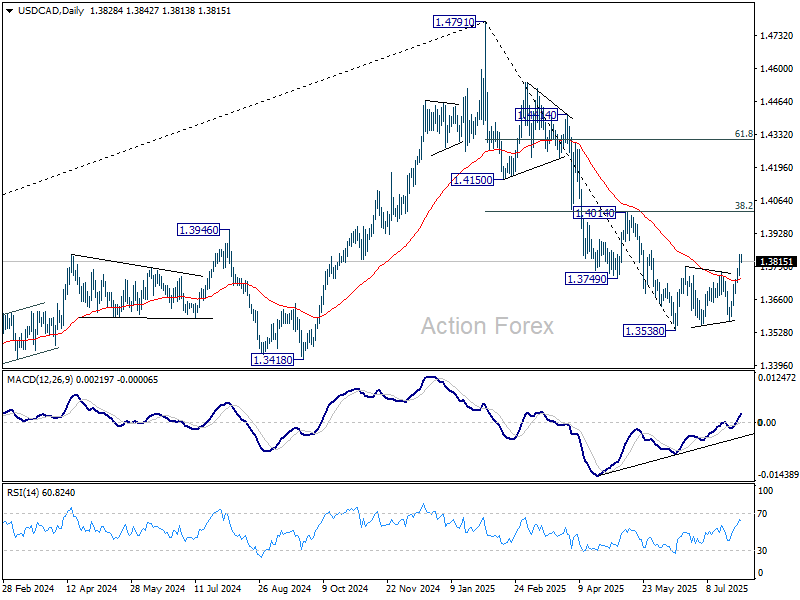
USD/CAD Daily Outlook
Daily Pivots: (S1) 1.3778; (P) 1.3812; (R1) 1.3864; More...
Intraday bias in USD/CAD remains on the upside for the moment. Rise from 1.3538 is seen as correcting the decline from 1.4791. Further rise should be seen towards 1.4014 cluster resistance (38.2% retracement of 1.4791 to 1.3538 at 14017). But strong resistance should be seen there to limit upside. On the downside, below 1.3757 minor support will turn intraday bias neutral first.
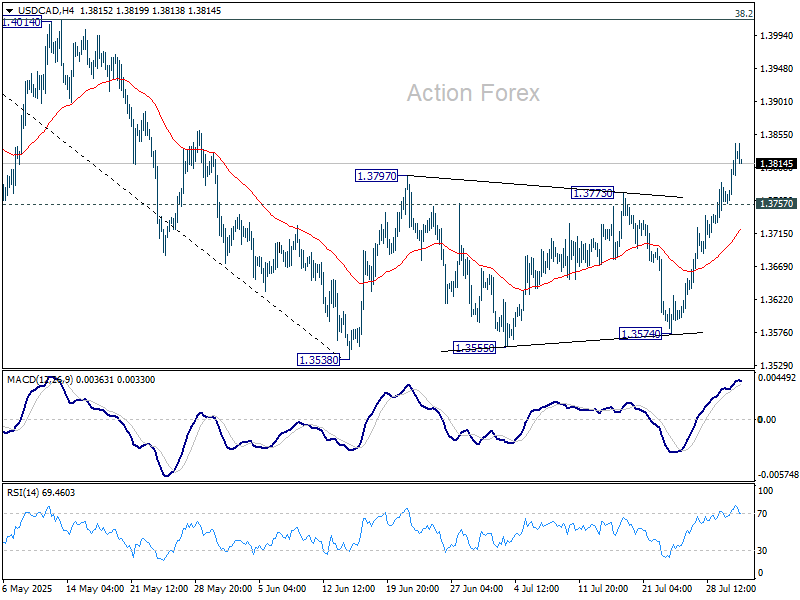
In the bigger picture, price actions from 1.4791 medium term top could either be a correction to rise from 1.2005 (2021 low), or trend reversal. In either case, further decline is expected as long as 1.4014 resistance holds. Next target is 61.8% retracement of 1.2005 (2021 low) to 1.4791 at 1.3069.
AUD/USD Daily Report
Daily Pivots: (S1) 0.6397; (P) 0.6463; (R1) 0.6500; More...
AUD/USD's break of 0.6453 support confirms short term topping at 0.6624, on bearish divergence condition in D MACD. Fall from there is tentatively seen as a correction to rise from 0.5913. Intraday bias is now on the downside for 38.2% retracement of 0.5913 to 0.6624 at 0.6352. Strong support is expected from 0.6352 to bring rebound. Above 0.6528 minor resistance will turn intraday bias neutral first.
In the bigger picture, there is no clear sign that down trend from 0.8006 (2021 high) has completed. Rebound from 0.5913 is seen as a corrective move. While stronger rally cannot be ruled out, outlook will remain bearish as long as 38.2% retracement of 0.8006 to 0.5913 at 0.6713 holds. Nevertheless, considering bullish convergence condition in W MACD, even in case of another fall through 0.5913, downside should be contained above 0.5506 (2020 low).
Dollar Dominance Continues Amid Fed Repricing; Trump Secures Korea Deal, Targets India
Dollar remains the clear outperformer this week, holding firm despite mild retreat in Asian session. Stronger-than-expected US Q2 GDP data have prompted a significant paring back of expectations for a September Fed rate cut. Adding to the hawkish tilt, Fed Chair Jerome Powell struck a more guarded tone at the post-meeting press conference. Markets are now keenly focused on today’s PCE inflation and Friday’s non-farm payrolls for further clues.
Across the broader currency market, Yen ranks second strongest behind Dollar. BoJ's upgraded inflation forecasts signal greater comfort that inflation will eventually trend sustainably around target, thus supporting further tightening ahead. Loonie is also gained ground, as the BoC struck a balanced tone by keeping the door open for further easing but offering no clear timeline. ON the other hand, Euro, Aussie, and Kiwi lag behind. Sterling and Swiss Franc sit in a neutral zone.
On the trade front, US President Donald Trump declared a “Full and Complete” trade agreement with South Korea. The deal caps blanket tariffs on Korean exports at 15%, down from the 25% initially threatened. Auto tariffs were also reduced from 25% to 15%. The timing of the agreement is critical, coming just ahead of the August 1 implementation window for new tariffs.
The pact also includes a USD350 billion South Korean investment package into the U.S., which Trump said will be “owned and controlled” by the US government and guided by presidential authority. Commerce Secretary Howard Lutnick elaborated that 90% of the profits from those funds would flow directly to American interests. The structure mirrors elements of the US–Japan agreement signed earlier this month.
However, South Korean President Lee Jae-myung offered a different framing, stressing that the investment aims to support Korean companies in entering high-tech US industries such as shipbuilding, semiconductors, and biotech. Of the total, USD 150 billion will target shipbuilding collaboration, aimed at cementing a competitive foothold in the US industrial base. Lee emphasized that mutual benefit—not unilateral concessions—must be the goal of any agreement with Washington.
While Seoul secured a deal, India is under renewed pressure. Trump announced a 25% tariff on Indian imports effective Friday, citing excessive trade barriers and India’s participation in BRICS. The president accused India of undermining US interests with non-monetary trade barriers and continued purchases of Russian oil and arms. However, he hinted that negotiations are ongoing and a resolution could still be reached by the end of the week. The move highlights Trump’s broader effort to isolate BRICS-aligned economies and reward cooperative partners with reduced trade penalties.
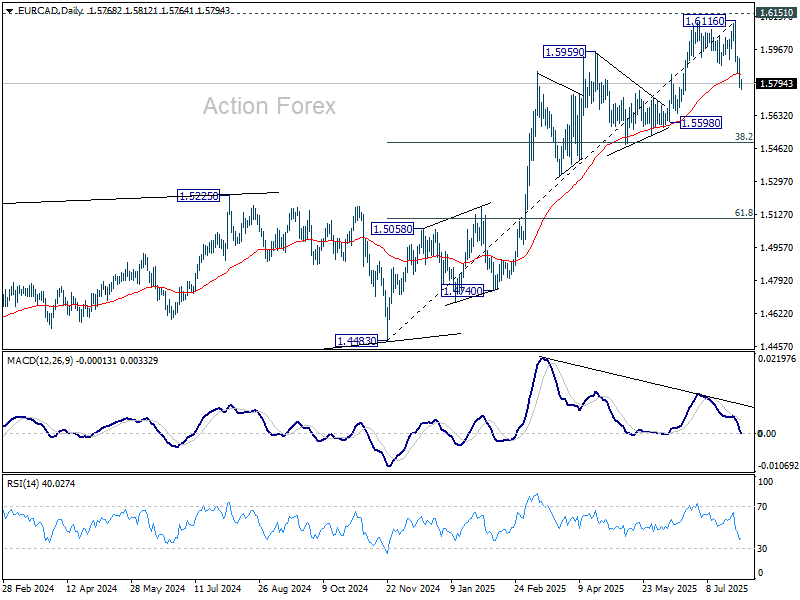
Technically, EUR/CAD's steep decline this week confirm short term toping at 1.6116, just ahead of 1.6151 key resistance (2018 high). Fall from there is seen as correcting the five-wave rally from 1.4483. Deeper decline would be seen to 1.5598 support or even further to 38.2% retracement of 1.4483 to 1.6116 at 1.5492.
In Asia, at the time of writing, Nikkei is up 1.10%. Hong Kong HSI is down -1.26%. China Shanghai SSE is down -0.80%. Singapore Strait Times is down -0.73%. Japan 10-year JGB yield is down -0.001 at 1.562. Overnight, DOW fell -0.38%. S&P 500 fell -0.12%. NASDAQ rose 0.15%. 10-year yield rose 0.046 to 4.376.
BoJ holds at 0.50%, lifts 2025 inflation projections sharply on food costs
The BoJ kept its short-term policy rate unchanged at 0.50% as expected, reaffirming its cautious stance in the face of growing external risks. While the central bank reiterated its intention to continue normalizing policy in light of improving economic and price conditions, it also cited heightened uncertainty around global trade and policy developments as justification for a steady hand.
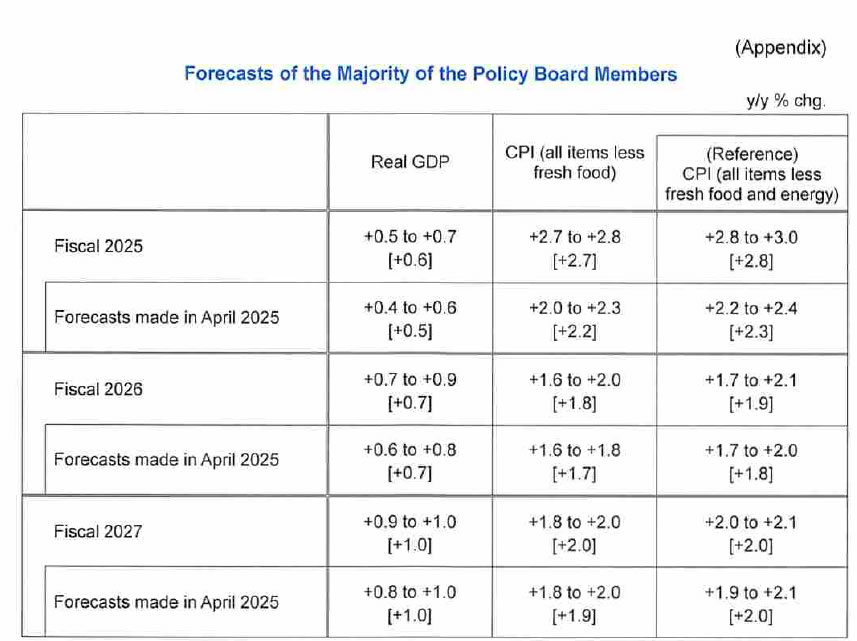
In its latest quarterly outlook, the BoJ sharply raised its inflation forecasts. Core CPI for fiscal 2025 was lifted from 2.2% to 2.7%. Core-core CPI, which excludes both fresh food and energy, jumped from 2.3% to 2.8%. The upward revisions were largely attributed to food price increases, though the BoJ still sees underlying inflation remaining subdued in the first half of the forecast horizon.
For fiscal 2026, core CPI was revised slightly higher from 1.7% to 1.8%, and core-core CPI from 1.8% to 1.9%. Projections for fiscal 2027 remained unchanged at 2.0% for both measures. The Bank noted that inflation will pick up toward levels “generally consistent” with the price stability target in the second half of the projection period.
Growth outlooks were little changed. The fiscal 2025 GDP forecast was lifted modestly to 0.6% from 0.5%, while estimates for fiscal 2026 and 2027 were held at 0.7% and 1.0%, respectively. The Bank continues to expect a slow but steady recovery, supported by resilient domestic demand and improvements in global conditions.
BoJ emphasized that the risk balance for growth remains tilted to the downside for 2025 and 2026, though price risks are now broadly balanced.
Fed Powell’s caution cools September cut bets, stocks end mixed
U.S. stocks ended mixed overnight after the Fed held its policy rate steady at 4.25–4.50%, in line with market expectations. The dissenting votes from Governors Christopher Waller and Michelle Bowman in favor of a cut came as little surprise, reflecting known dovish leanings. However, Chair Jerome Powell’s tone in the press conference struck a more cautious chord than markets had anticipated.
Powell pushed back against speculation of a near-term pivot, stating firmly, “We have made no decisions about September.” That effectively left the door open, but offered little for those hoping for imminent easing. Powell also warned that while tariff-driven inflation may be transitory, “more persistent” effects couldn’t be ruled out.
Between now and the next FOMC meeting, two additional rounds of jobs and inflation reports will be released—giving the Fed a wider lens to assess policy needs.
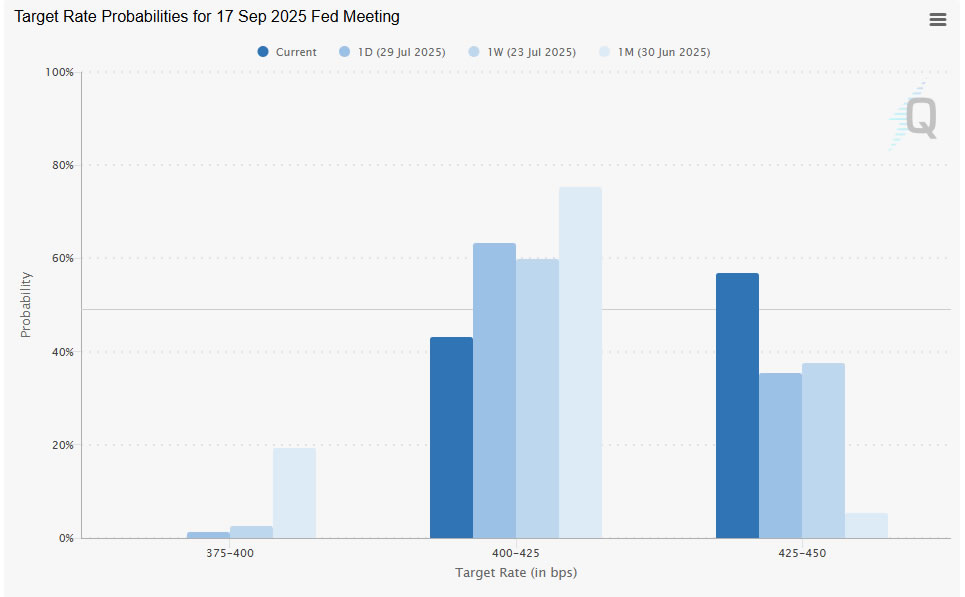
Traders responded by paring back bets for a September cut. Market pricing now sees just a 43% chance of easing at the next meeting, down from 65% a day earlier. The message: the Fed may be approaching the end of its pause, but it’s not ready to blink just yet.
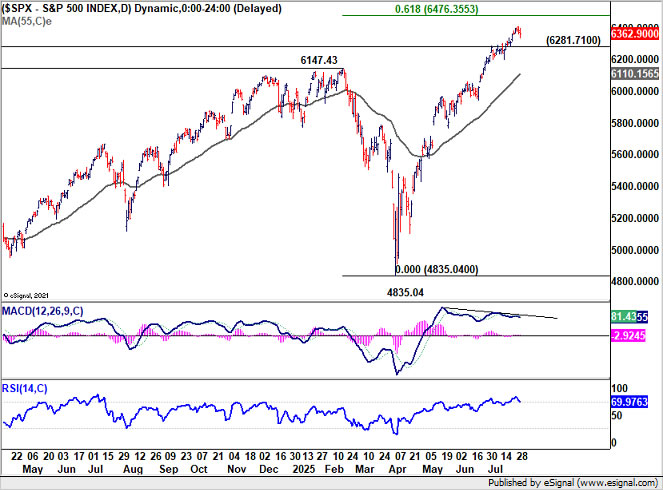
Technically, while S&P 500's up trend continued this week, it's clearly continuing to lose upward momentum as seen in bearish divergence condition in D MACD. 6500 psychological level is likely to cap upside and bring consolidations. That's slightly above a major fibonacci level of 61.8% projection of 3491.58 to 6147.43 from 4835.04 at 6476.35. Break of 6281.71 support will indicate that a near term correction has already started towards 55 D EMA (now at 6110.15).
Asia data wrap: Japan and Australia outperform but China falters
Asian economies delivered mixed signals as fresh data highlighted strength in Japan and Australia while exposing continued softness in China.
Japan’s industrial production rose 1.7% mom in June, defying forecasts for a -0.7% mom decline. The surge was driven by a 14.8% mom jump in transport equipment excluding autos and strength in electronics, a positive surprise despite ongoing US tariffs. Retail sales also rose 2.0% yoy, slightly beating forecasts of 1.8% yoy.
Australian retail sales posted an impressive 1.2% monthly gain in June, sharply above the 0.4% mom consensus. The ABS attributed the spike to widespread discounting and new product launches.
Meanwhile, China's July PMIs disappointed. The NBS Manufacturing PMI dipped from 49.7 to 49.3, remaining in contraction for the fourth straight month. The export component showed no signs of recovery, marking 15 months of sub-50 readings at 47.1 Non-Manufacturing PMI also weakened from 50.5 to 50.1, its lowest since November.
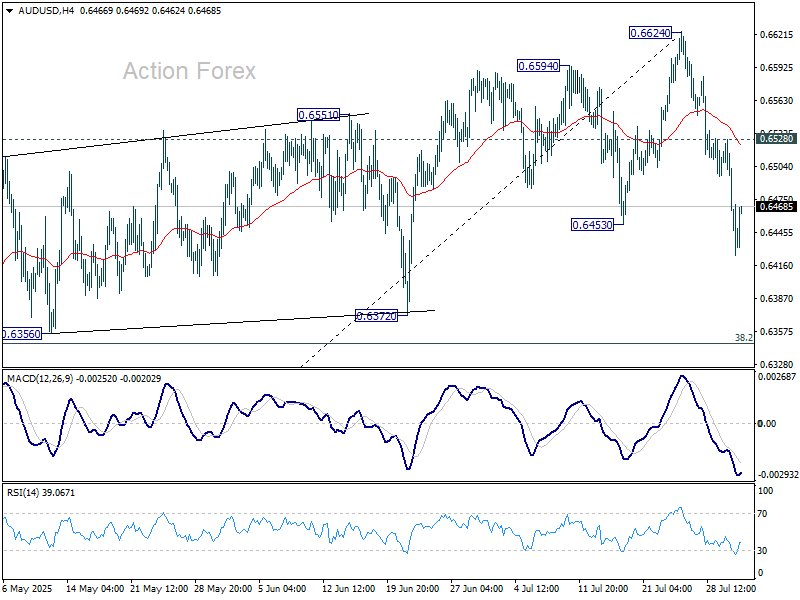
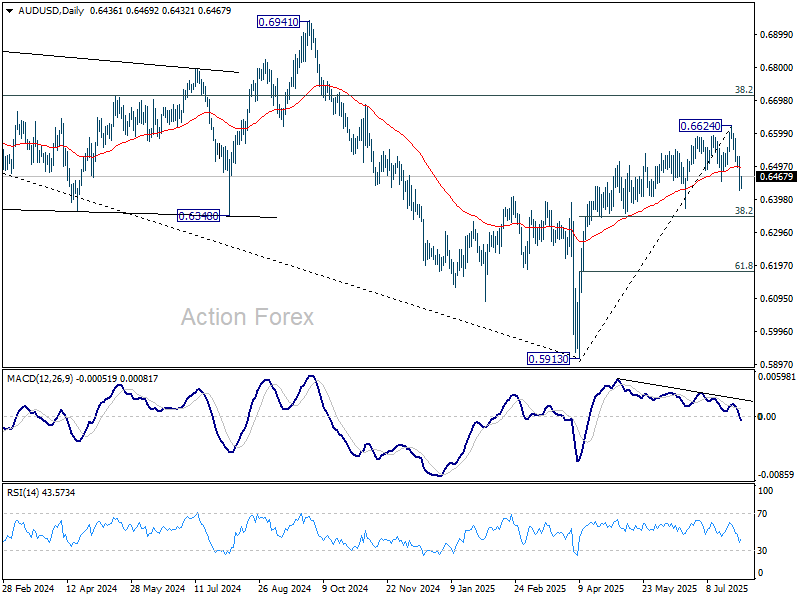
AUD/USD Daily Report
Daily Pivots: (S1) 0.6397; (P) 0.6463; (R1) 0.6500; More...
AUD/USD's break of 0.6453 support confirms short term topping at 0.6624, on bearish divergence condition in D MACD. Fall from there is tentatively seen as a correction to rise from 0.5913. Intraday bias is now on the downside for 38.2% retracement of 0.5913 to 0.6624 at 0.6352. Strong support is expected from 0.6352 to bring rebound. Above 0.6528 minor resistance will turn intraday bias neutral first.
In the bigger picture, there is no clear sign that down trend from 0.8006 (2021 high) has completed. Rebound from 0.5913 is seen as a corrective move. While stronger rally cannot be ruled out, outlook will remain bearish as long as 38.2% retracement of 0.8006 to 0.5913 at 0.6713 holds. Nevertheless, considering bullish convergence condition in W MACD, even in case of another fall through 0.5913, downside should be contained above 0.5506 (2020 low).
WTI Crude Oil Breaks Out – But Can Bulls Keep It Above Resistance?
Key Highlights
- WTI Crude Oil prices started a fresh increase above the $68.00 zone.
- It cleared many hurdles near $68.00 and $68.80 on the 4-hour chart.
- Gold could extend losses below the $3,300 support.
- EUR/USD dived and traded below the 1.1500 zone.
WTI Crude Oil Price Technical Analysis
WTI Crude Oil price formed a base above $66.00 against the US Dollar. There was a fresh increase above the $67.00 and $68.00 resistance levels.
Looking at the 4-hour chart of XTI/USD, the price cleared a key bearish trend line with resistance at $67.20. The price even settled above the $68.00 level, the 100 simple moving average (red, 4-hour), and the 200 simple moving average (green, 4-hour).

Finally, the price surpassed the $70.00 level and started a consolidation phase. On the upside, immediate resistance is near the $70.80 level. The first key resistance sits near the $71.20 level.
The main hurdle is now near the $72.00 zone, above which the price may perhaps accelerate higher. In the stated case, it could even visit the $73.50 resistance. Any more gains might call for a test of the $75.00 resistance zone in the near term.
On the downside, the first major support sits near the $69.50 zone. The next support could be $68.50. A daily close below $68.50 could open the doors for a larger decline. The next major support is $66.65. Any more losses might send oil prices toward $65.00 in the coming days.
Looking at Gold, the bears are active below the $3,350 level, and they might aim for a drop toward the $3,250 level.
Economic Releases to Watch Today
- US Initial Jobless Claims - Forecast 224K, versus 217K previous.
- US Personal Income for June 2025 (MoM) - Forecast +0.2%, versus -0.4% previous.
- US Core Personal Consumption Expenditure for June 2025 (MoM) - Forecast +0.3%, versus +0.2% previous.