

Sample Category Title
US: Q2 GDP Flattered by Unwinding of Q1’s Tariff Front-Running
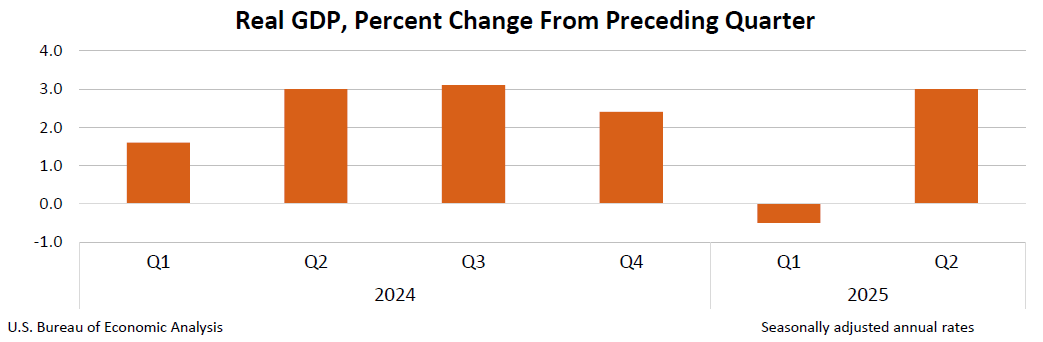
The U.S. economy expanded by 3.0% quarter-on-quarter (q/q, annualized) in the second quarter – slightly above the consensus forecast of 2.6% – and up sharply from Q1's contraction of 0.5%.
Consumer spending rose 1.4% q/q, a modest acceleration from Q1's 0.5%. Spending on both goods (2.2% from 0.1%) and services (1.1% from 0.6%) accelerated relative to Q1.
Business investment rose 1.9% q/q, but that came after a very strong gain in the first quarter – largely driven by firms front-loading capital spending ahead of the tariffs. In terms of the breakdown, both equipment (+4.8% q/q) and intellectual property products (6.4%) were higher, while spending on structures (-10.3% q/q) declined for a second consecutive quarter.
Residential investment declined 4.6% q/q, as homebuilding reached a new cyclical low in Q2. Home sales trended lower and remain 30% below its level prior to the Fed initiating its tightening cycle in 2022.
Government spending rose a modest 0.4%, as an uptick in state & local spending (+3.0%) more than offset the pullback at the federal level (-3.7% q/q).
As was the case in Q1, international trade was a major factor influencing growth last quarter. Imports plummeted by 30.3% q/q – following a gain of 37.9% q/q in Q1 – largely owing to a sharp pullback in goods imports (-35.3% q/q). Meanwhile, exports contracted by a more modest 1.8% q/q, resulting in net trade adding 5.0 percentage points (pp) to Q2 GDP. Meanwhile, inventory investment subtracted 3.2pp from headline growth.
Final sales to private domestic purchasers, a better gauge of underlying demand as it includes only household consumption and fixed investment slowed to 1.2% from 1.9% in Q1.
Core PCE inflation – the Fed's preferred inflation gauge – was 2.5% q/q (annualized), a notable deceleration from Q1's 3.5%.
Key Implications
Headline GDP growth for the second quarter overstated the degree of strength in the U.S. economy. An unwinding of Q1's tariff front-running resulted in imports contracting by the largest amount (outside of the pandemic) since the height of the global financial crisis, resulting in a massive positive contribution to GDP. Once the effects of net trade, inventories and government were removed, sales to private domestic purchasers, expanded by just 1.2% or its slowest rate of growth in 2.5 years.
Tomorrow's release of personal income & spending for June will shed more light on how consumer spending ended last quarter. Retail sales for June (released on July 17th) suggest spending turned higher last month, but that's only after falling sharply the month prior – leaving June's level roughly unchanged from April. With inflationary pressures likely to heat-up over the coming months alongside some expected softening in the labor market, the backdrop for consumer spending is looking increasingly fragile. Our current GDP tracking has the economy expanding by around 1.0% in Q3.
EUR/USD Mid-Day Outlook
Daily Pivots: (S1) 1.1510; (P) 1.1554; (R1) 1.1590; More...
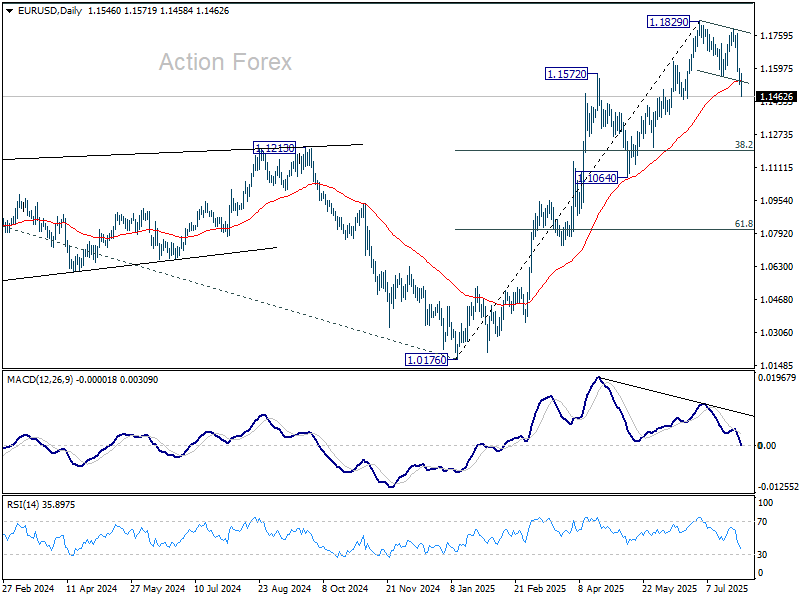
EUR/USD's current downside acceleration and strong break of 55 D EMA (now at 1.1536) suggests that fall from 1.1829 is already correcting the whole rally from 1.0176. Intraday bias stays on the downside for 38.2% retracement of 1.0176 to 1.1829 at 1.1198. On the upside, above 1.1571 minor resistance will turn intraday bias neutral and bring consolidations first, before staging another decline.
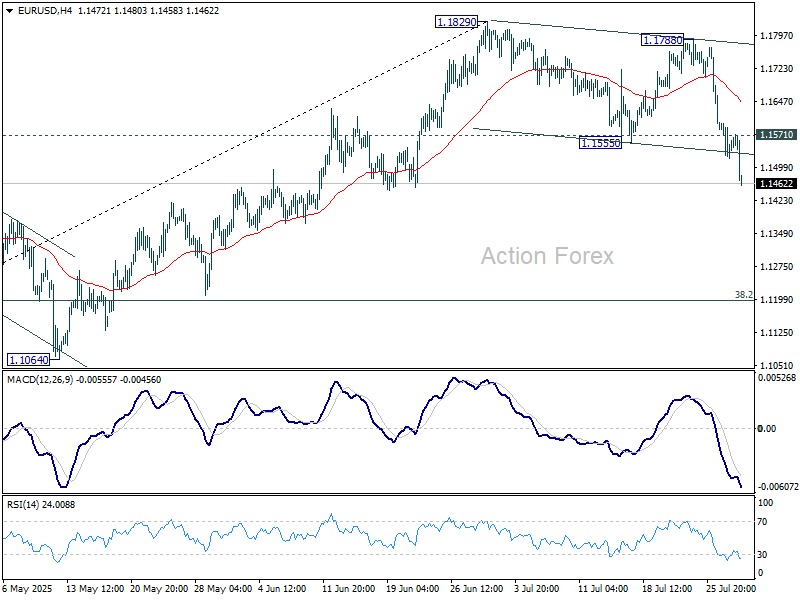
In the bigger picture, rise from 0.9534 long term bottom could be correcting the multi-decade downtrend or the start of a long term up trend. In either case, further rise should be seen to 100% projection of 0.9534 to 1.1274 from 1.0176 at 1.1916. This will remain the favored case as long as 1.1604 support holds.
Hot US GDP Lifts Dollar, Eyes Now on Fed
Dollar strength resumed in early US session after US Q2 GDP blew past expectations with a 3.0% annualized growth rate. The data added further confirmation that the US economy remains remarkably resilient, reinforcing bullish bets on the greenback. Currency markets reacted swiftly, with traders piling back into Dollar longs after briefly taking profit earlier in the week.
Equity markets, however, were more subdued. Futures on major US indexes remained near flat, as investors chose to wait out the FOMC decision. Even with inflation clearly cooling, there's little pressure on the Fed to act swiftly. Instead, today's events may reaffirm a "higher for longer" stance as long as growth remains robust.
The Fed is widely expected to keep its policy rate unchanged at 4.25–4.50%. Attention will be on whether dovish members like Waller and Bowman continue to call for a cut, and if others show signs of joining them. Given today’s solid data, the bar for broader support for immediate easing likely remains high.
Attention will also be squarely on Chair Jerome Powell's press conference and the FOMC statement for any hints of a September move. With market pricing hovering around a 65% chance for a cut, any less-than-dovish language could see Dollar bulls press further.
So far, the greenback is leading currency performance on the day, followed by Yen and Sterling. On the weak side, Aussie continues to lag after soft Q2 inflation readings. Euro and Swiss Franc also remain under pressure, while Kiwi and Loonie are stuck in the middle of the pack.
Looking ahead, the spotlight will shift quickly to BoJ’s decision in the Asian session. While a hold at 0.50% is expected, Deputy Governor Shinichi Uchida’s earlier remarks flagged that economic projections would reflect the positive impact of the US-Japan trade deal. That sets the stage for a potential hawkish twist. If BoJ drops even subtle hints that a rate hike later this year is back in play, Yen shorts may find themselves squeezed.
Technically, AUD/JPY's price actions from 97.41 short term top are seen as a near term corrective pattern only. Another rally is still expected to 61.8% projection of 86.03 to 95.63 from 92.30 at 98.23. However, sustained break of 55 D EMA (now at 95.00) will raise the chance of bearish reversal, and target 92.30 support first.

In Europe, at the time of writing, FTSE is down -0.22%. DAX is up 0.10%. CAC is up 0.42%. UK 10-year yield is down -0.032 at 4.607. Germany 10-year yield is down -0.003 at 2.708. Earlier in Asia, Nikkei fell -0.05%. Hong Kong HSI fell -1.36%. China Shanghai SSE rose 0.17%. Singapore Strait Times fell -0.24%. Japan 10-year JGB yield fell -0.13 to 1.563.
US GDP surges 3.0% annualized in Q2, inflation gauges ease
US GDP growth accelerated to 3.0% annualized in Q2, far above expectations, as falling imports and firmer consumer spending powered the expansion. These gains were partially offset by weaker investment and exports, though the data suggest domestic demand remains firm.
Notably, inflation pressures eased significantly. The PCE price index rose just 2.1% in Q2, down from 3.7% in Q1, while the core PCE gauge slowed to 2.5% from 3.5%.
US ADP jobs grow 75k, ongoing labor market resilience
U.S. private payrolls grew 104k in July, beating expectations of 75k and suggesting continued strength in the labor market. Gains were broad-based, with 31k new jobs in goods-producing industries and 74k in services. Hiring was evenly spread across firm sizes, with both medium and large companies contributing 46k each.
Wage pressures held steady, with pay up 4.4% yoy for job-stayers and 7% for job-changers, unchanged for the fourth consecutive month.
ADP’s Chief Economist Nela Richardson noted the data points to “a healthy economy” as employers grow more confident in consumer resilience.
Eurozone GDP beats with 0.1% qoq growth, but Germany and Italy contract
Eurozone GDP grew 0.1% qoq in Q2, slightly above market expectations of flat growth, while the broader EU expanded 0.2% qoq. On a year-over-year basis, GDP rose 1.4% yoy in the Eurozone and 1.5% yoy in the EU—marking a mild deceleration from Q1's annual pace of 1.5% yoy and 1.6% yoy respectively. .
Spain led the quarter with a strong 0.7% qoq gain, followed by Portugal (0.6%) and Estonia (0.5%). However, Germany and Italy both posted marginal contractions of -0.1%, and Ireland saw the largest drop at -1.0%. Despite the mixed quarterly results, all member states reported positive year-on-year growth.
Australia CPI cools to 2.1% in Q2, June reading undershoots
Australia’s inflation pressures continued to ease in Q2, reinforcing expectations for further policy easing from the RBA.
Headline CPI rose 0.7% qoq, down from Q1’s 0.9% qoq and under the 0.8% qoq consensus. On an annual basis, CPI slowed from 2.4% yoy to 2.1% yoy, the lowest since early 2021, and below expectation of 2.2% yoy.
Trimmed mean inflation, the RBA’s preferred gauge, also moderated from 0.7% qoq to 0.6% qoq. Annual rate fell from 2.9% to 2.7% yoy, matched expectations, and marking the lowest since Q4 2021.
Underlying disinflation is broadening too. Annual services inflation cooled from 3.7% yoy to 3.3% yoy, the weakest since Q2 2022. Goods inflation dipped back to 1.1% yoy after a brief uptick from Q4's 0.8% yoy to Q1's 1.3% yoy.
The June monthly CPI dropped from 2.1% yoy to 1.9% yoy, also below expectations of 2.1% yoy, and undershoots RBA's 2-3% target band.
NZ ANZ business confidence ticks up to 47.8, easing inflation signals more RBNZ cuts ahead
New Zealand’s ANZ Business Confidence ticked higher in July, rising from 46.3 to 47.8. Own Activity Outlook edged down slightly from 40.9 to 40.6. The share of firms expecting to raise prices over the next three months dropped to 43.5%—the lowest since December 2024. Inflation expectations also dipped from 2.71% to 2.68%.
ANZ described the inflation signals as “benign,” noting declines across both cost and pricing expectations. The bank suggested that RBNZ may soon shift from worrying about inflation staying too high to concerns about it falling too low, implying a greater likelihood of deeper monetary easing than currently priced in by markets or flagged by the RBNZ itself.
EUR/USD Mid-Day Outlook
Daily Pivots: (S1) 1.1510; (P) 1.1554; (R1) 1.1590; More...
EUR/USD's current downside acceleration and strong break of 55 D EMA (now at 1.1536) suggests that fall from 1.1829 is already correcting the whole rally from 1.0176. Intraday bias stays on the downside for 38.2% retracement of 1.0176 to 1.1829 at 1.1198. On the upside, above 1.1571 minor resistance will turn intraday bias neutral and bring consolidations first, before staging another decline.
In the bigger picture, rise from 0.9534 long term bottom could be correcting the multi-decade downtrend or the start of a long term up trend. In either case, further rise should be seen to 100% projection of 0.9534 to 1.1274 from 1.0176 at 1.1916. This will remain the favored case as long as 1.1604 support holds.
US GDP surges 3.0% annualized in Q2, inflation gauges ease
US GDP growth accelerated to 3.0% annualized in Q2, far above expectations, as falling imports and firmer consumer spending powered the expansion. These gains were partially offset by weaker investment and exports, though the data suggest domestic demand remains firm.
Notably, inflation pressures eased significantly. The PCE price index rose just 2.1% in Q2, down from 3.7% in Q1, while the core PCE gauge slowed to 2.5% from 3.5%.
US ADP jobs grow 75k, ongoing labor market resilience
U.S. private payrolls grew 104k in July, beating expectations of 75k and suggesting continued strength in the labor market. Gains were broad-based, with 31k new jobs in goods-producing industries and 74k in services. Hiring was evenly spread across firm sizes, with both medium and large companies contributing 46k each.
Wage pressures held steady, with pay up 4.4% yoy for job-stayers and 7% for job-changers, unchanged for the fourth consecutive month.
ADP’s Chief Economist Nela Richardson noted the data points to “a healthy economy” as employers grow more confident in consumer resilience.
Australian Inflation Lower Than Forecast, Fed Up Next
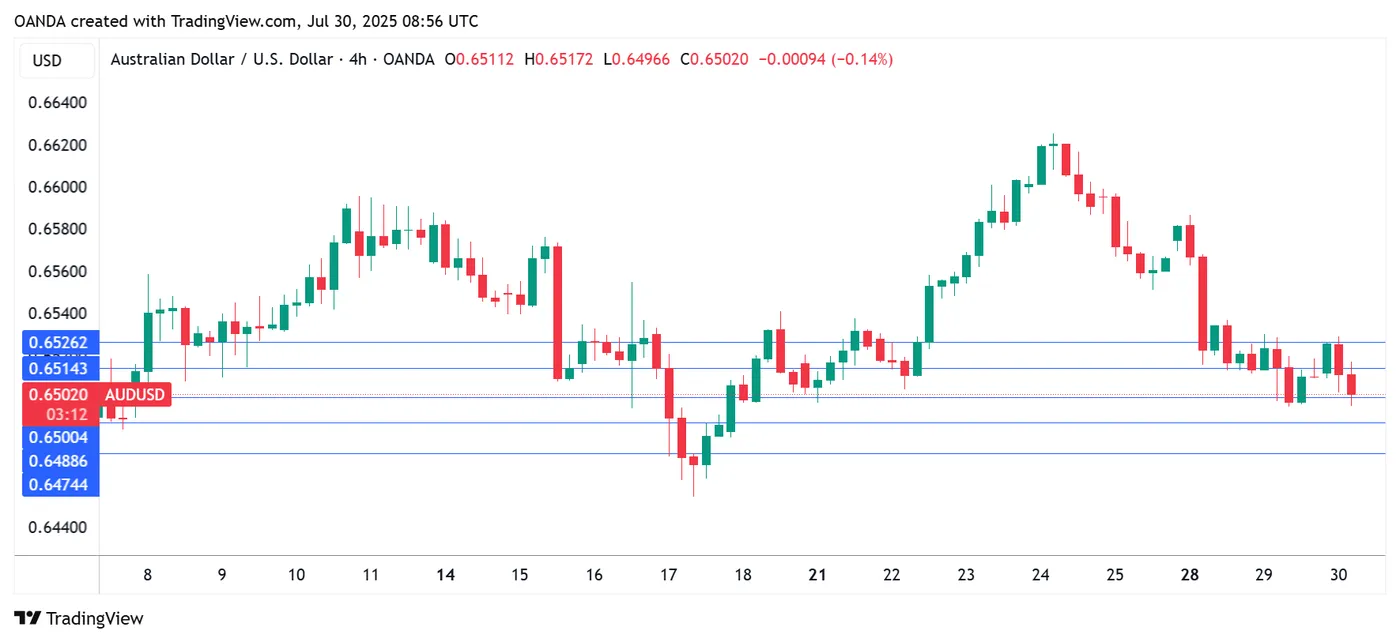
The Australian dollar is showing limited movement. In the European session, AUD/USD is trading at 0.6500, down 0.15% on the day.
Australian CPI eases to 2.1%
Australia's inflation rate for the second quarter came in lower than expected. Headline CPI dropped to 2.1% y/y, down from 2.4% in the prior two quarters and falling to its lowest level since Q1 2021. This was just below the market estimate of 2.2%. Quarterly, CPI rose 0.7% in Q2, down from 0.9% in Q1 and below the market estimate of 0.8%.
Services inflation continued to decline and fell to 3.3% from 3.7%. The drop in CPI was driven by a sharp drop in automotive fuel costs. The RBA's key gauge for core CPI, the trimmed mean, slowed to 2.7% from 2.9%, matching the market forecast. This was the lowest level since Q4 2021.
Is an August rate cut a done deal?
The positive inflation report is a reassuring sign that inflation is under control and should cement a rate cut at the Aug. 12 meeting. The Reserve Bank of Australia stunned the markets earlier this month when it held rates, as a quarter-point cut had been all but certain. Bank policymakers said at that meeting that they wanted to wait for more inflation data to make sure that inflation was contained and today's inflation report should reassure even the hawkish members that a rate cut is the right move at the August meeting.
Fed expected to hold rates
The Federal Reserve meets today and is widely expected to maintain the benchmark rate for a fifth straight meeting. Investors will be looking for clues regarding the September meeting, as the markets have priced in a rate cut at 63%, according to CME's FedWatch.
AUD/USD is testing support at 0.6500. Next, there is support at 0.6488 and 0.6474
0.6514 and 0.6526 are the next resistance lines
AUD/USD Technical
- AUD/USD is testing support at 0.6500. Next, there is support at 0.6488 and 0.6474
- 0.6514 and 0.6526 are the next resistance lines
WTI Oil: Bulls Pause Under Cloud Top After Strong Advance in Past Two Days
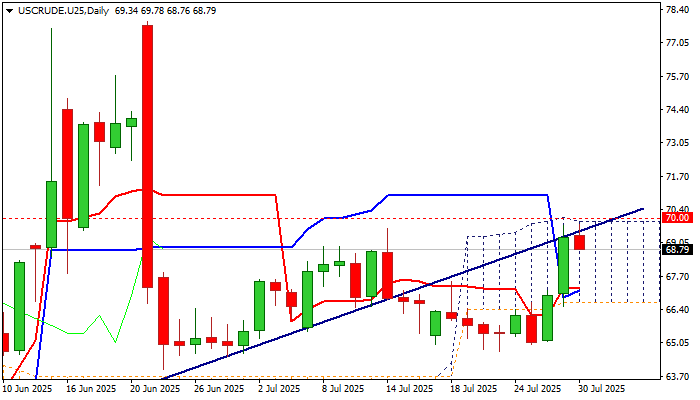
WTI oil price eases from new five-week high on Wednesday after advancing over 6% in past two days.
Partial profit taking after strong rally was caused by technical signals, as well as on uncertainty over President Trump’s latest threats of imposing a secondary tariffs of 100% to all those importing oil from Russia.
The latest rally was repeatedly capped under the top of thick daily cloud as the price penetrated cloud on Monday and rose near its top on Tuesday, generating strong bullish signal.
Daily studies improved (Tenkan/Kijun-sen bull-cross /14-d momentum broke into positive territory) but overbought stochastic and sideways-moving RSI suggest that bulls are like to take a breather and look for fresh signal.
Dips should find solid supports at $67.96/85 (broken 200DMA / Fibo 38.2% of $64.72/$69.78 upleg) to mark a healthy correction ahead of fresh attack at cloud top and nearby psychological $70 barrier, violation of which to signal bullish continuation.
Otherwise, deeper pullback would keep bulls on hold, but with limited downside risk as long as the price stays above daily Tenkan-sen / 50% retracement of ($67.25).
Return below cloud base ($66.65) will be bearish.
Unexpected rise in US crude stocks (API report showed 1.53M build vs 2.5M draw forecast) contributed to weaker tone today, with release of EIA crude inventories report (-2.3M fc vs -3.16M previous) being in focus today.
Res: 69.62; 70.00; 70.92; 71.33.
Sup: 68.59; 67.96; 67.25; 66.65.
USD/JPY in Correction as Markets Await Signals from Fed and BoJ
The USD/JPY pair fell to 147.92 on Wednesday, with the Japanese yen recovering some of its early-week losses as the US dollar softened ahead of the Federal Reserve’s policy meeting.
While the Fed is widely expected to keep rates on hold, market focus remains squarely on whether policymakers will signal a potential rate cut in September.
Simultaneously, investors are assessing the outcome of this week’s US–China trade talks in Stockholm, which concluded on Tuesday without an extension of the current trade truce.
Domestically, attention turns to the upcoming Bank of Japan (BoJ) policy decision. The central bank is forecast to maintain its current interest rate as it evaluates the economic impact of US tariffs. The BoJ’s quarterly outlook report may also see an upward revision to its inflation forecasts.
Political uncertainty adds another layer of complexity, with growing pressure on Prime Minister Shigeru Ishiba to resign. However, the Prime Minister has firmly denied any intention to step down.
Notably, despite broader US dollar strength across markets, the USD/JPY pair has not fully reflected this trend due to counterbalancing factors.
Technical Analysis: USD/JPY
H4 Chart:
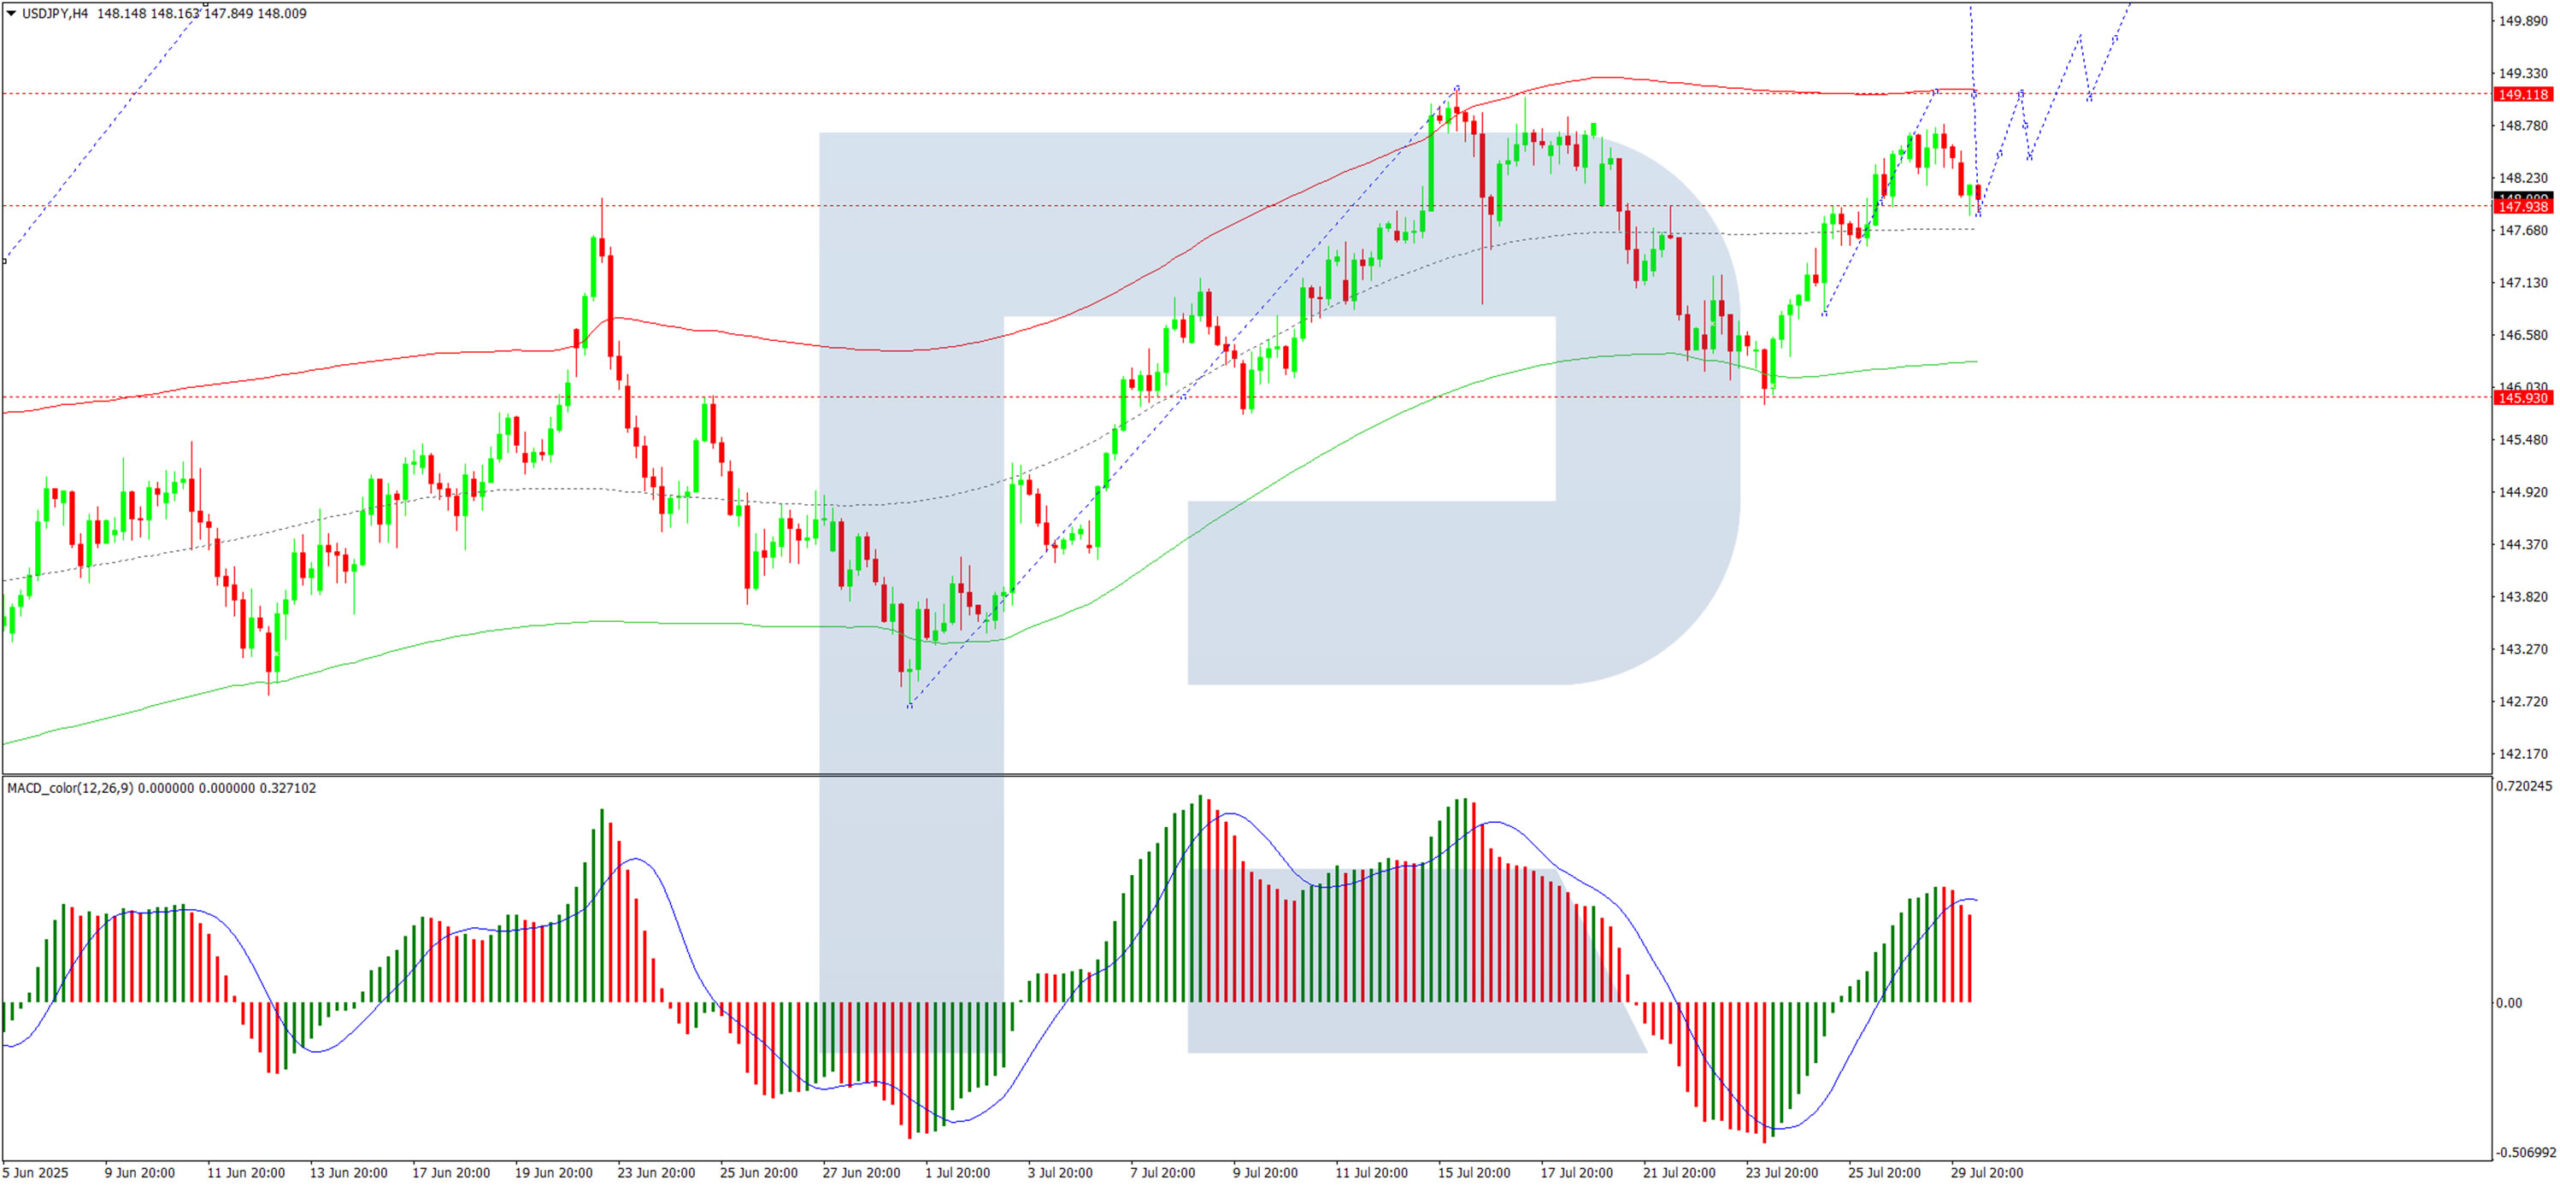
On the H4 chart, USD/JPY continues to consolidate around 147.90, having extended its range upwards to 148.77. Following a retest of 147.90 from above, the next likely move is a push higher towards 149.11, with a potential continuation towards 150.30 if bullish momentum holds. This scenario is supported by the MACD indicator, where the signal line remains above zero and points firmly upwards.
H1 Chart:
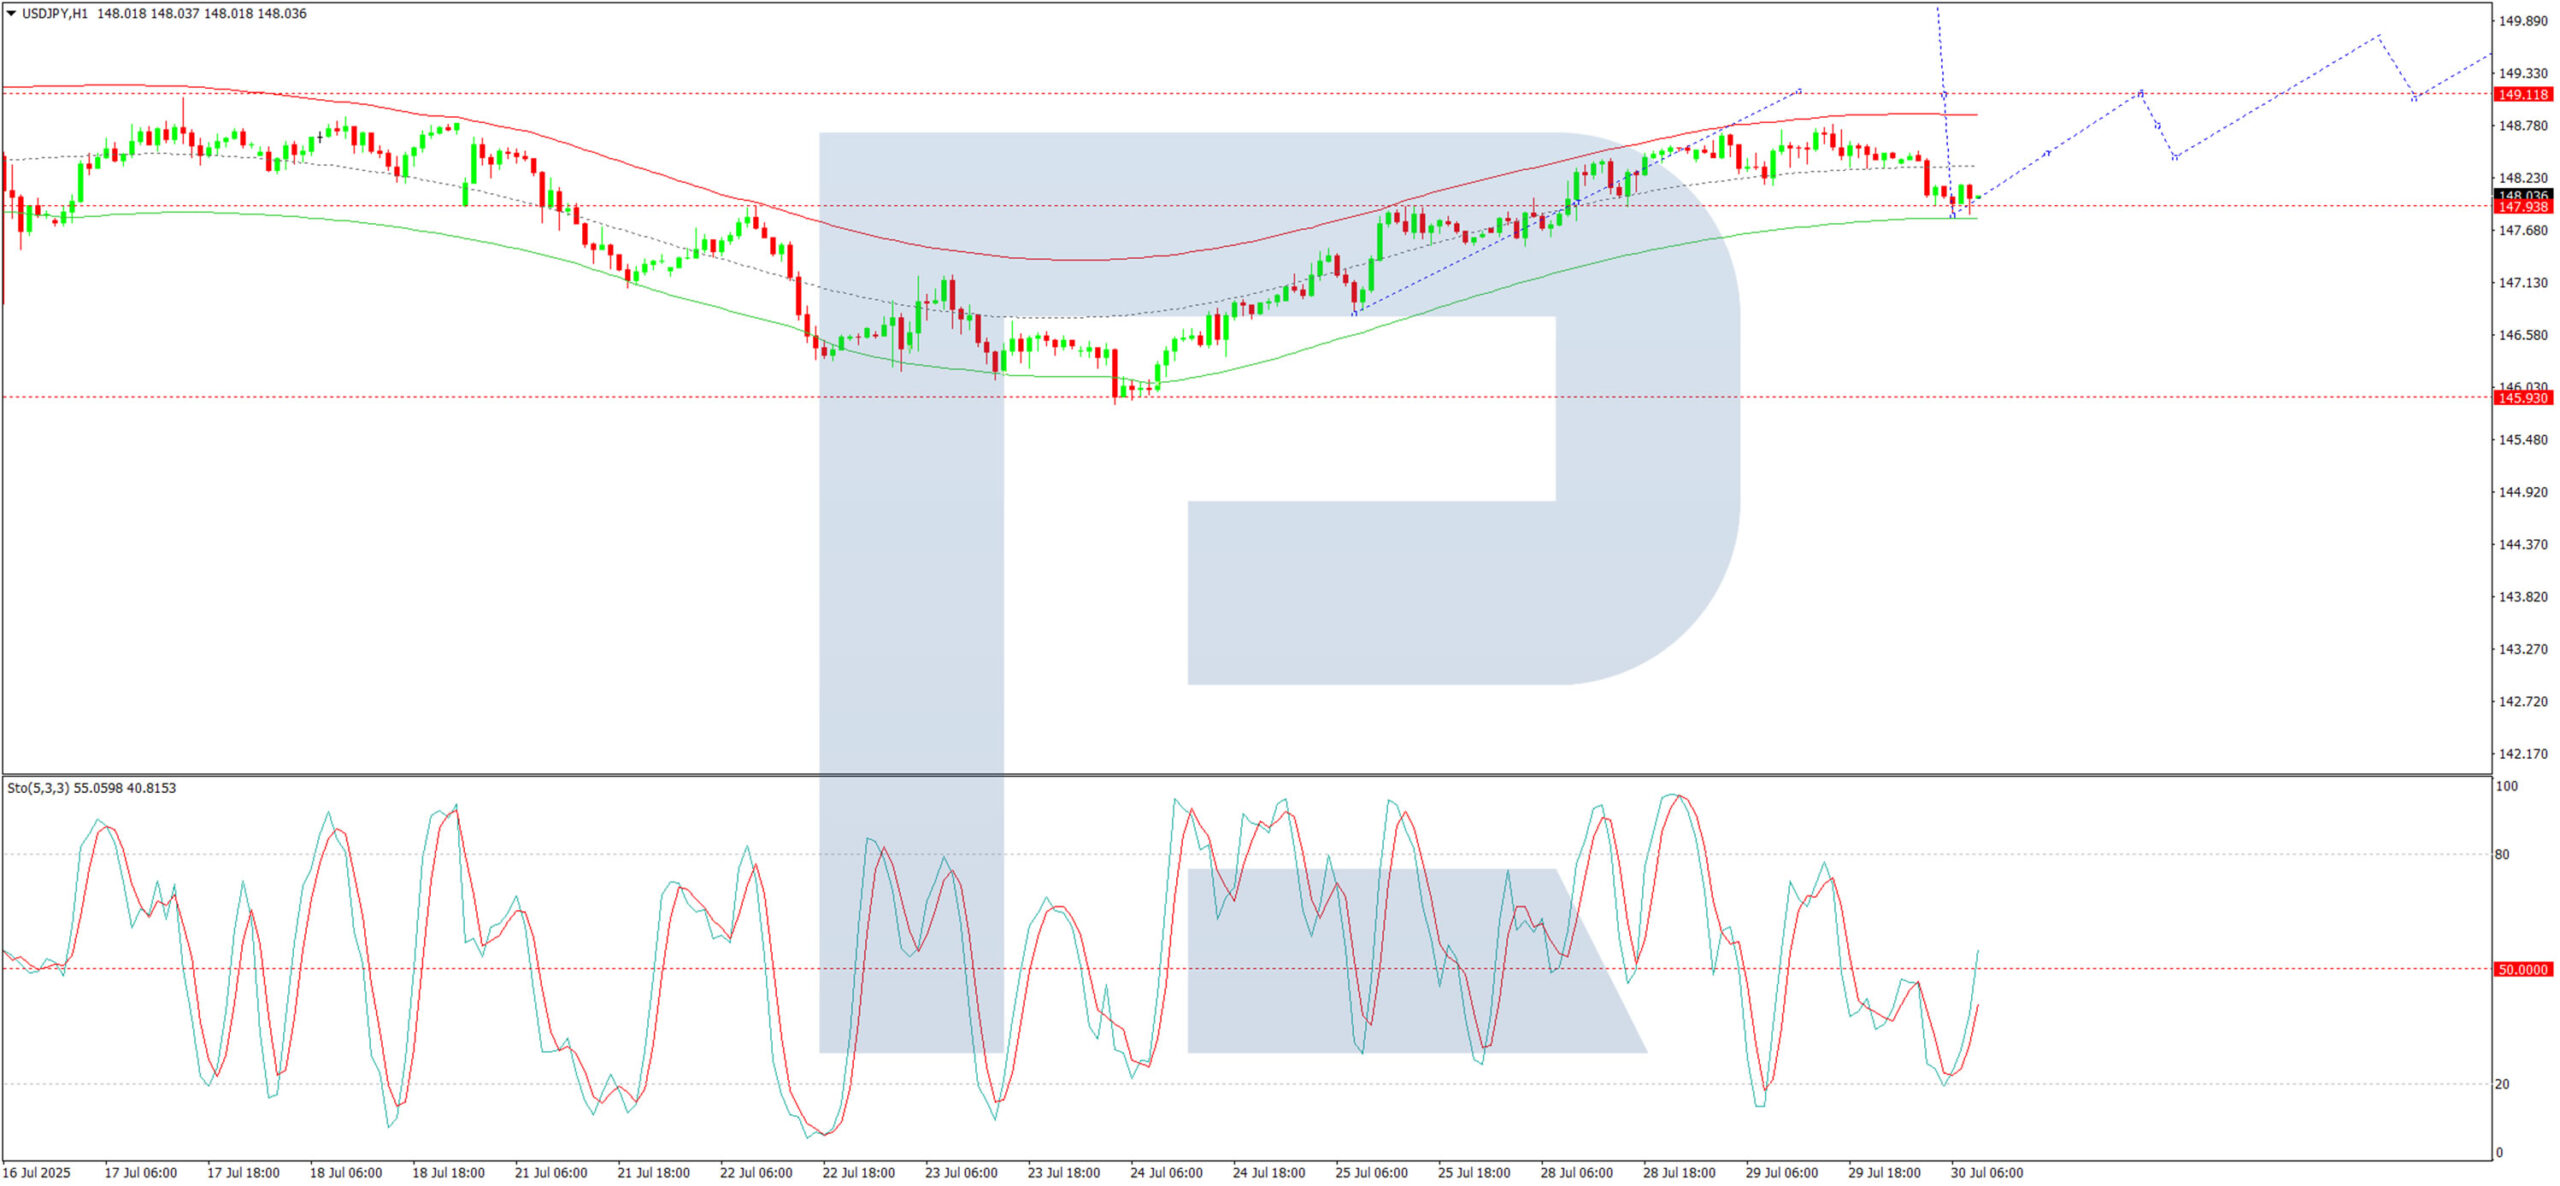
Switching to the H1 chart, the pair is forming a consolidation range around 147.90. A breakout to the upside could see a move towards 149.11, followed by a retracement to 148.44. Conversely, a downside break may trigger a decline towards 145.90. The Stochastic oscillator aligns with this outlook, as its signal line sits above 20 and is trending upwards.
Conclusion
The USD/JPY pair remains in a corrective phase, with near-term direction hinging on policy signals from the Fed and BoJ. While technical indicators currently support a bullish bias, traders should remain alert to the possibility of breakout moves as confirmation.
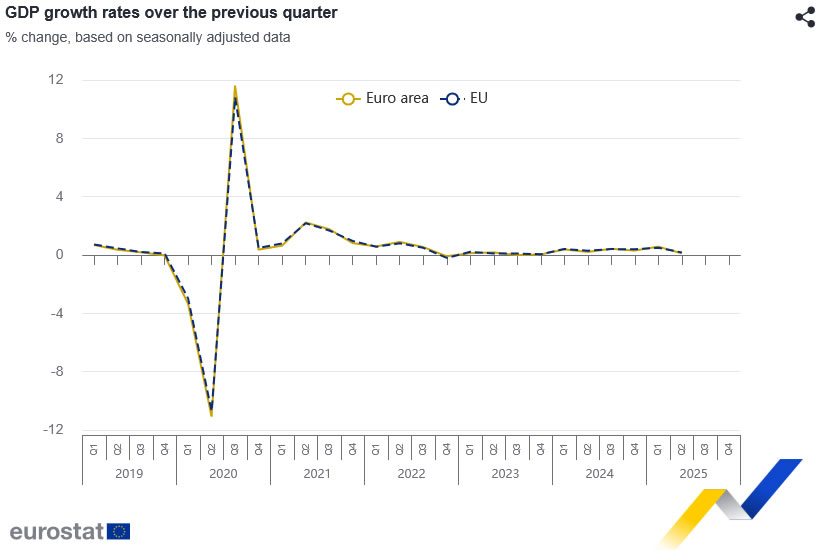
Eurozone GDP beats with 0.1% qoq growth, but Germany and Italy contract
Eurozone GDP grew 0.1% qoq in Q2, slightly above market expectations of flat growth, while the broader EU expanded 0.2% qoq. On a year-over-year basis, GDP rose 1.4% yoy in the Eurozone and 1.5% yoy in the EU—marking a mild deceleration from Q1's annual pace of 1.5% yoy and 1.6% yoy respectively. .
Spain led the quarter with a strong 0.7% qoq gain, followed by Portugal (0.6%) and Estonia (0.5%). However, Germany and Italy both posted marginal contractions of -0.1%, and Ireland saw the largest drop at -1.0%. Despite the mixed quarterly results, all member states reported positive year-on-year growth.
EUR/USD Hits Lowest Level Since Early July
As the EUR/USD chart indicates today, the euro has fallen below the 1.1550 mark against the US dollar, reaching the lows of June 2025. As a result, July may become the first month in 2025 to record a decline in the currency pair.
Why Is EUR/USD Declining?
There are two key factors driving the euro’s weakness relative to the US dollar:
→ Anticipation of the Federal Reserve Meeting. At 21:00 GMT+3 today, the Fed’s interest rate decision will be released. According to Forex Factory, analysts expect the Federal Funds Rate to remain unchanged at 4.25%-4.50%.
→ Market Reaction to the US-EU Trade Agreement. The trade deal signed last weekend between the United States and Europe is being critically assessed by market participants.
As noted in our Monday analysis, signs of a bearish takeover emerged on the chart following the agreement’s signing. Since then, EUR/USD has declined by approximately 1.3%. The question now is whether the downtrend will continue.
Technical Analysis of the EUR/USD Chart
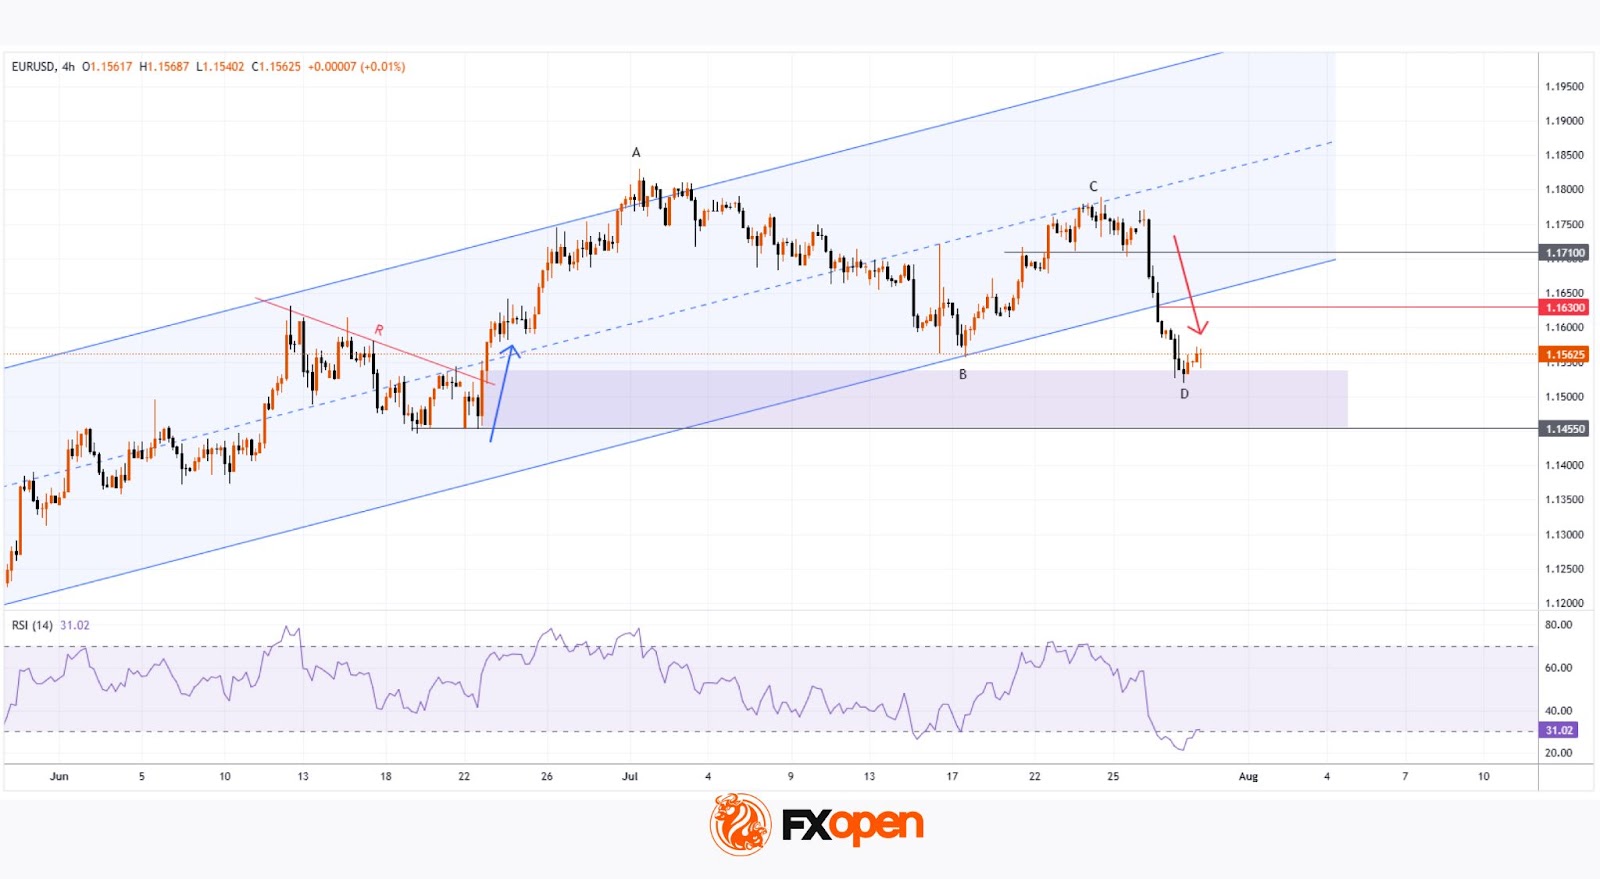
The upward channel that had remained valid since mid-May was decisively broken by bears this week. The nature of the breakout (highlighted by the red arrow) was particularly aggressive, with the price dropping from the 1.1710 level to the D point low without any meaningful interim recoveries.
Key observations include:
→ The drop has resulted in a classic bearish A-B-C-D market structure, characterised by lower highs and lower lows.
→ On the 4-hour timeframe, the RSI indicator has fallen into oversold territory, reaching its lowest point of 2025 so far.
→ Notably (as highlighted by the blue arrow), there was a strong rebound from the 1.1455 support level earlier. Bulls demonstrated significant strength at that time, breaking through the R resistance line.
Given these factors, we could assume that after this week’s sharp decline, EUR/USD may attempt a short-term recovery from the support zone (highlighted in purple). Should this scenario unfold, potential resistance may emerge near the 1.1630 level, as this area aligns with:
→ The 50% Fibonacci retracement of the C→D decline;
→ The breakout point of the lower boundary of the previous ascending channel, indicating a shift in market balance in favour of the bears.
Trade over 50 forex markets 24 hours a day with FXOpen. Take advantage of low commissions, deep liquidity, and spreads from 0.0 pips. Open your FXOpen account now or learn more about trading forex with FXOpen.
This article represents the opinion of the Companies operating under the FXOpen brand only. It is not to be construed as an offer, solicitation, or recommendation with respect to products and services provided by the Companies operating under the FXOpen brand, nor is it to be considered financial advice.