Sample Category Title
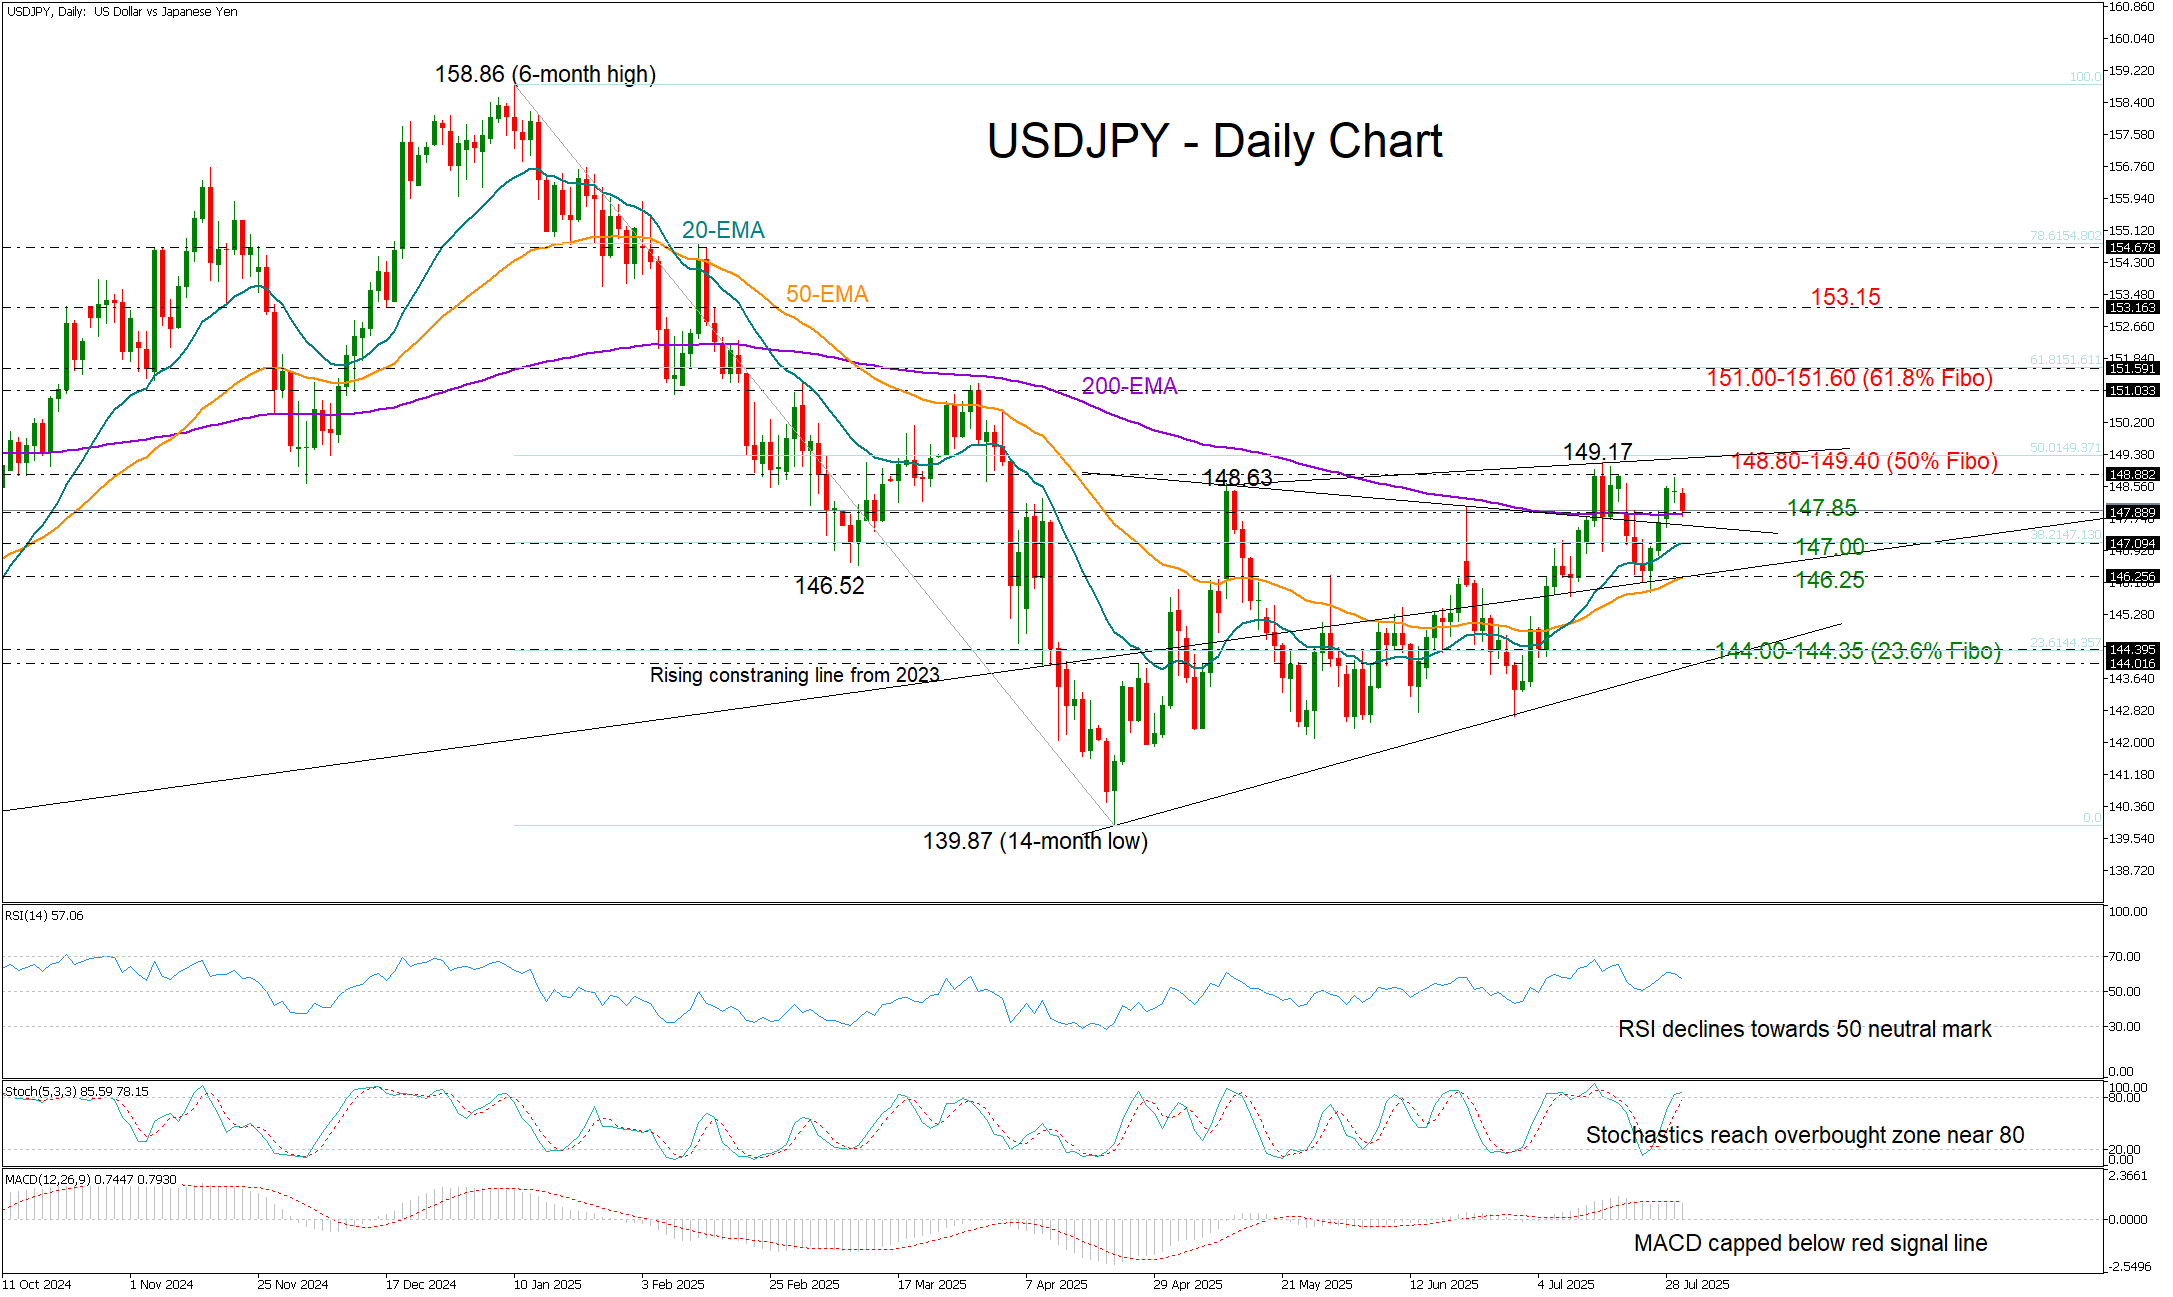
USD/JPY Runs Out of Fuel Near July’s High
- USD/JPY falls after another rejection near 148.80–149.40.
- Technical risk tilts to the downside; focus on 200-day EMA.
USDJ/PY surrendered to the bears early on Wednesday after its three-day bullish streak ran out of steam just below the 148.80–149.40 ceiling, which capped July’s gains.
While market stability is typical ahead of FOMC policy meetings, upcoming US GDP growth figures – and particularly the price component – could inject early volatility before the central bank's rate decision. Investors are anticipating a swift 2.4% rebound following the -0.5% contraction in Q1, the first such decline in over two years.
Technically, Tuesday’s doji candlestick has already raised concerns that the pair could remain trapped within the three-month-old sideways pattern. The momentum indicators are offering little optimism: the stochastic oscillator is about to peak in overbought territory, and the RSI is trending downward toward the neutral 50 mark.
As such, traders may wait for a confirmed negative move below the 200-day exponential moving average (EMA) at 147.80 or even a slide beneath the 20-day EMA at 147.00 to target the 50-day EMA at 146.25. A failure to rebound there could open the door for a deeper decline toward the 144.00–144.35 area, where a tentative support line from April and the 23.6% Fibonacci retracement of the January–April downleg are sitting.
To the upside, a sustained break above the 148.80–149.40 resistance zone is a prerequisite for a rally toward the 151.00 round level and the 61.8% Fibonacci mark at 151.60. Beyond that, the pair could aim for a further advance toward 153.15.
Summing up, USD/JPY remains in a wait-and-see mode, with downside risks increasing after a second rejection at the key resistance zone of 148.80-149.40. A decisive move below the 200-day EMA could signal the start of the next bearish cycle.
EUR/USD Dips Further While USD/CHF Consolidates Gains
EUR/USD extended losses and traded below the 1.1600 support. USD/CHF is rising and might aim for a move toward the 0.8120 resistance.
Important Takeaways for EUR/USD and USD/CHF Analysis Today
- The Euro struggled to clear the 1.1800 resistance and declined against the US Dollar.
- There is a key downward channel forming with resistance at 1.1575 on the hourly chart of EUR/USD at FXOpen.
- USD/CHF is showing positive signs above the 0.8040 resistance zone.
- There is a connecting bullish trend line forming with support at 0.7990 on the hourly chart at FXOpen.
EUR/USD Technical Analysis
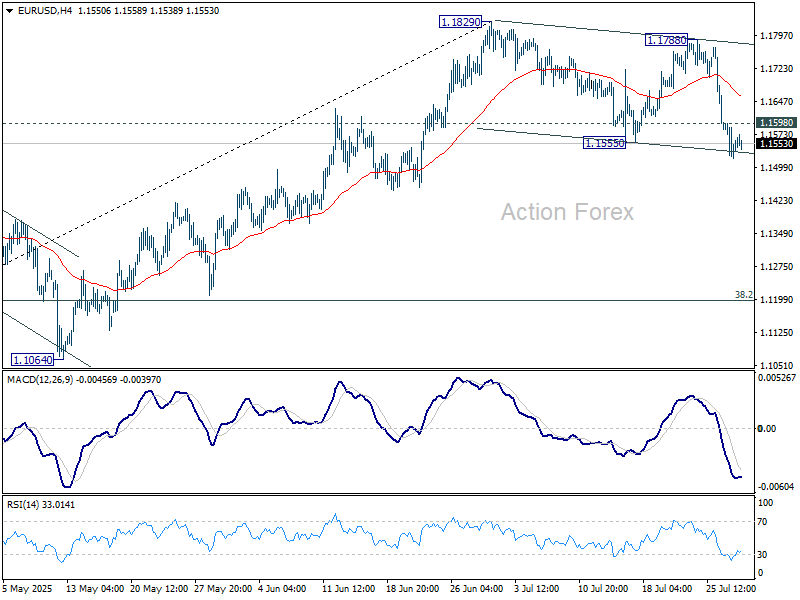
On the hourly chart of EUR/USD at FXOpen, the pair failed to clear the 1.1800 resistance. The Euro started a fresh decline below the 1.1720 support against the US Dollar.
The pair declined below the 1.1660 support and the 50-hour simple moving average. Finally, it tested the 1.1520 level. A low was formed at 1.1519 and the pair is now consolidating losses. The market is showing bearish signs, and the upsides might remain capped.
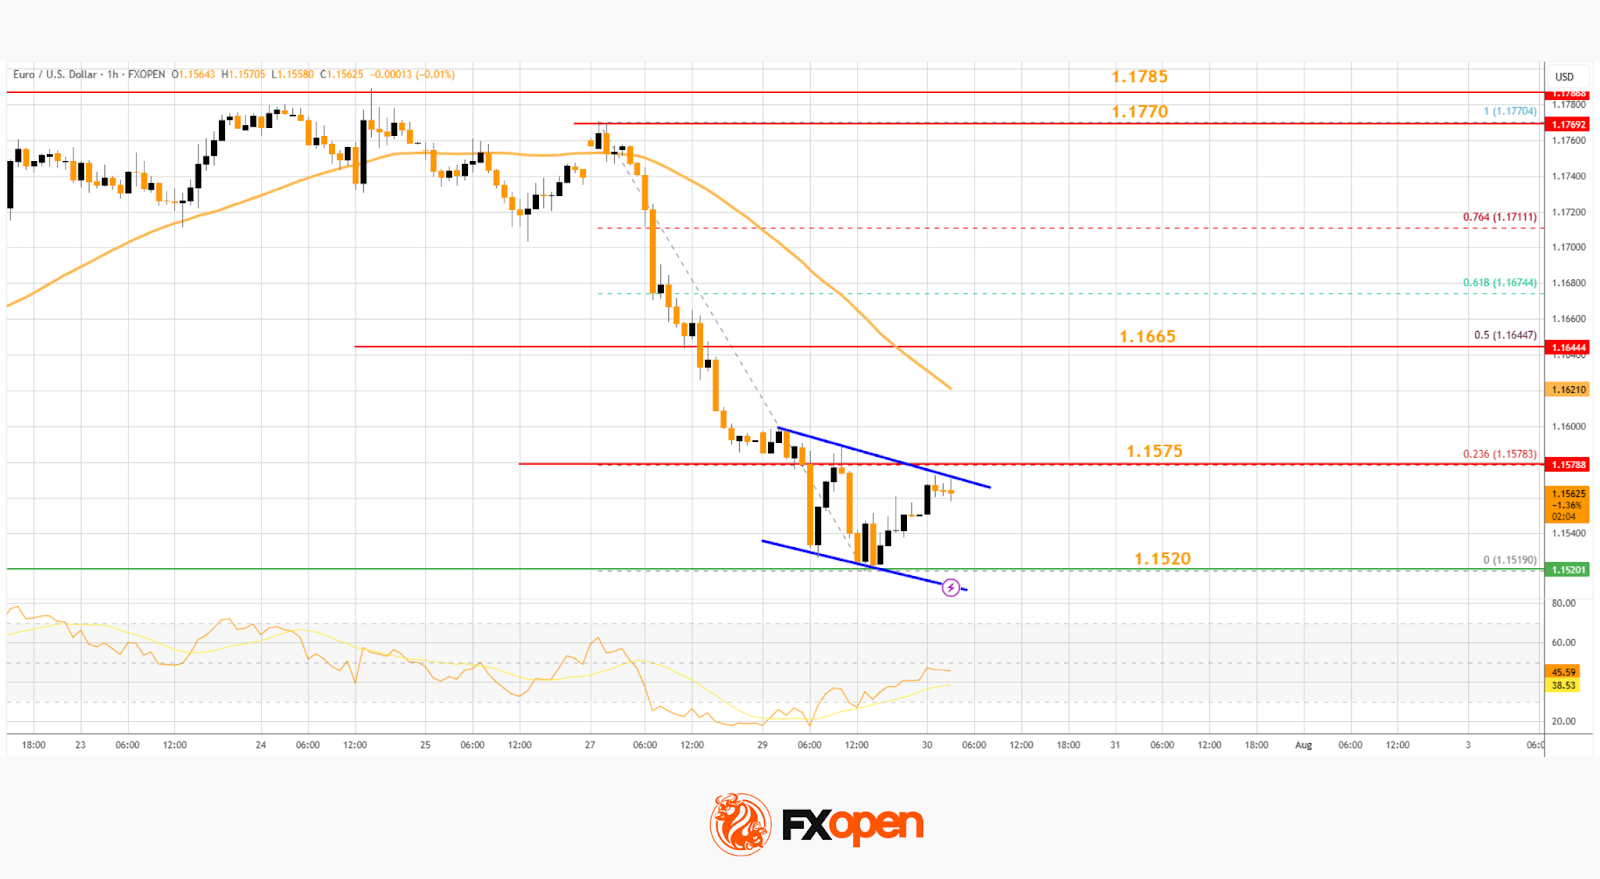
There was a minor increase toward the 23.6% Fib retracement level of the downward move from the 1.1770 swing high to the 1.1519 low. Immediate resistance on the upside is near the 1.1575 level.
There is also a key downward channel forming with resistance at 1.1575. The next major resistance is near the 1.1665 zone and the 50-hour simple moving average or the 50% Fib retracement level.
The main resistance sits near the 1.1770 level. An upside break above the 1.1770 level might send the pair towards 1.1800. Any more gains might open the doors for a move towards 1.1850.
On the downside, immediate support on the EUR/USD chart is seen near 1.1520. The next major support is near the 1.1465 level. A downside break below 1.1465 could send the pair towards 1.1350.
USD/CHF Technical Analysis
On the hourly chart of USD/CHF at FXOpen, the pair started a decent increase from the 0.7910 support. The US Dollar climbed above the 0.8000 resistance zone against the Swiss Franc.
The bulls were able to pump the pair above the 50-hour simple moving average and 0.8040. A high was formed at 0.8079 and the pair is now consolidating gains above the 23.6% Fib retracement level of the upward move from the 0.7911 swing low to the 0.8079 high.
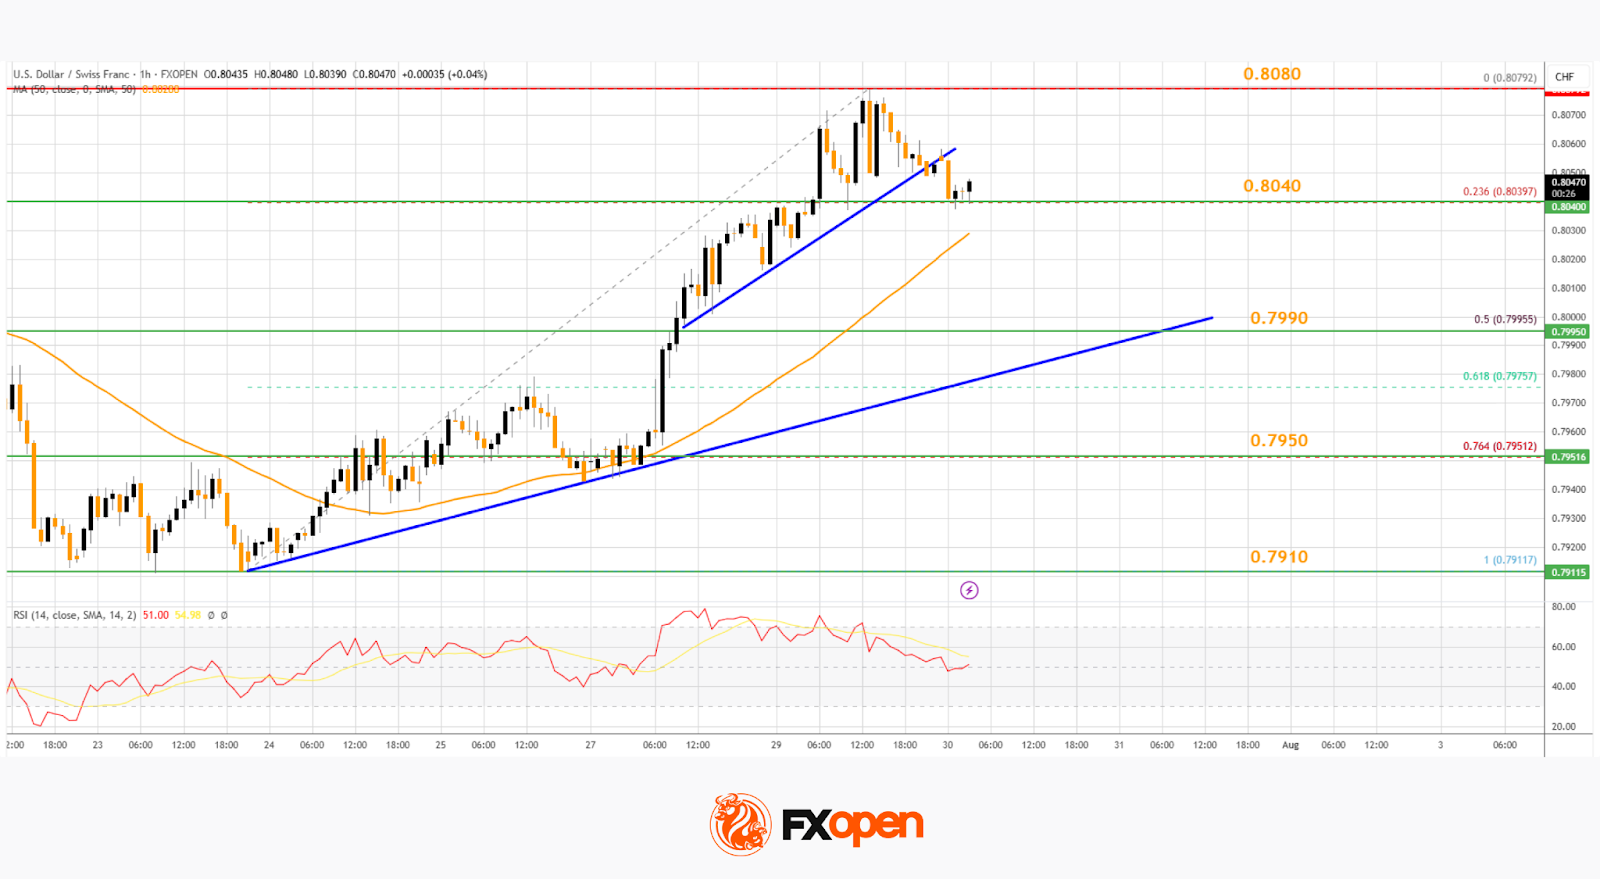
There is also a connecting bullish trend line forming with support at 0.7990. On the upside, the pair is now facing resistance near 0.8080. The main resistance is now near 0.8120.
If there is a clear break above the 0.8120 resistance zone and the RSI remains above 50, the pair could start another increase. In the stated case, it could test 0.8200. If there is a downside correction, the pair might test the 0.7990 level.
The first major support on the USD/CHF chart is near the 0.7950 level and the 76.4% Fib retracement level.
The next key support is near 0.7910. A downside break below 0.7910 might spark bearish moves. Any more losses may possibly open the doors for a move towards the 0.7850 level in the near term.
Trade over 50 forex markets 24 hours a day with FXOpen. Take advantage of low commissions, deep liquidity, and spreads from 0.0 pips. Open your FXOpen account now or learn more about trading forex with FXOpen.
This article represents the opinion of the Companies operating under the FXOpen brand only. It is not to be construed as an offer, solicitation, or recommendation with respect to products and services provided by the Companies operating under the FXOpen brand, nor is it to be considered financial advice.
GBPUSD Elliott Wave Insight: Bounce Should Fail Into Support Zone
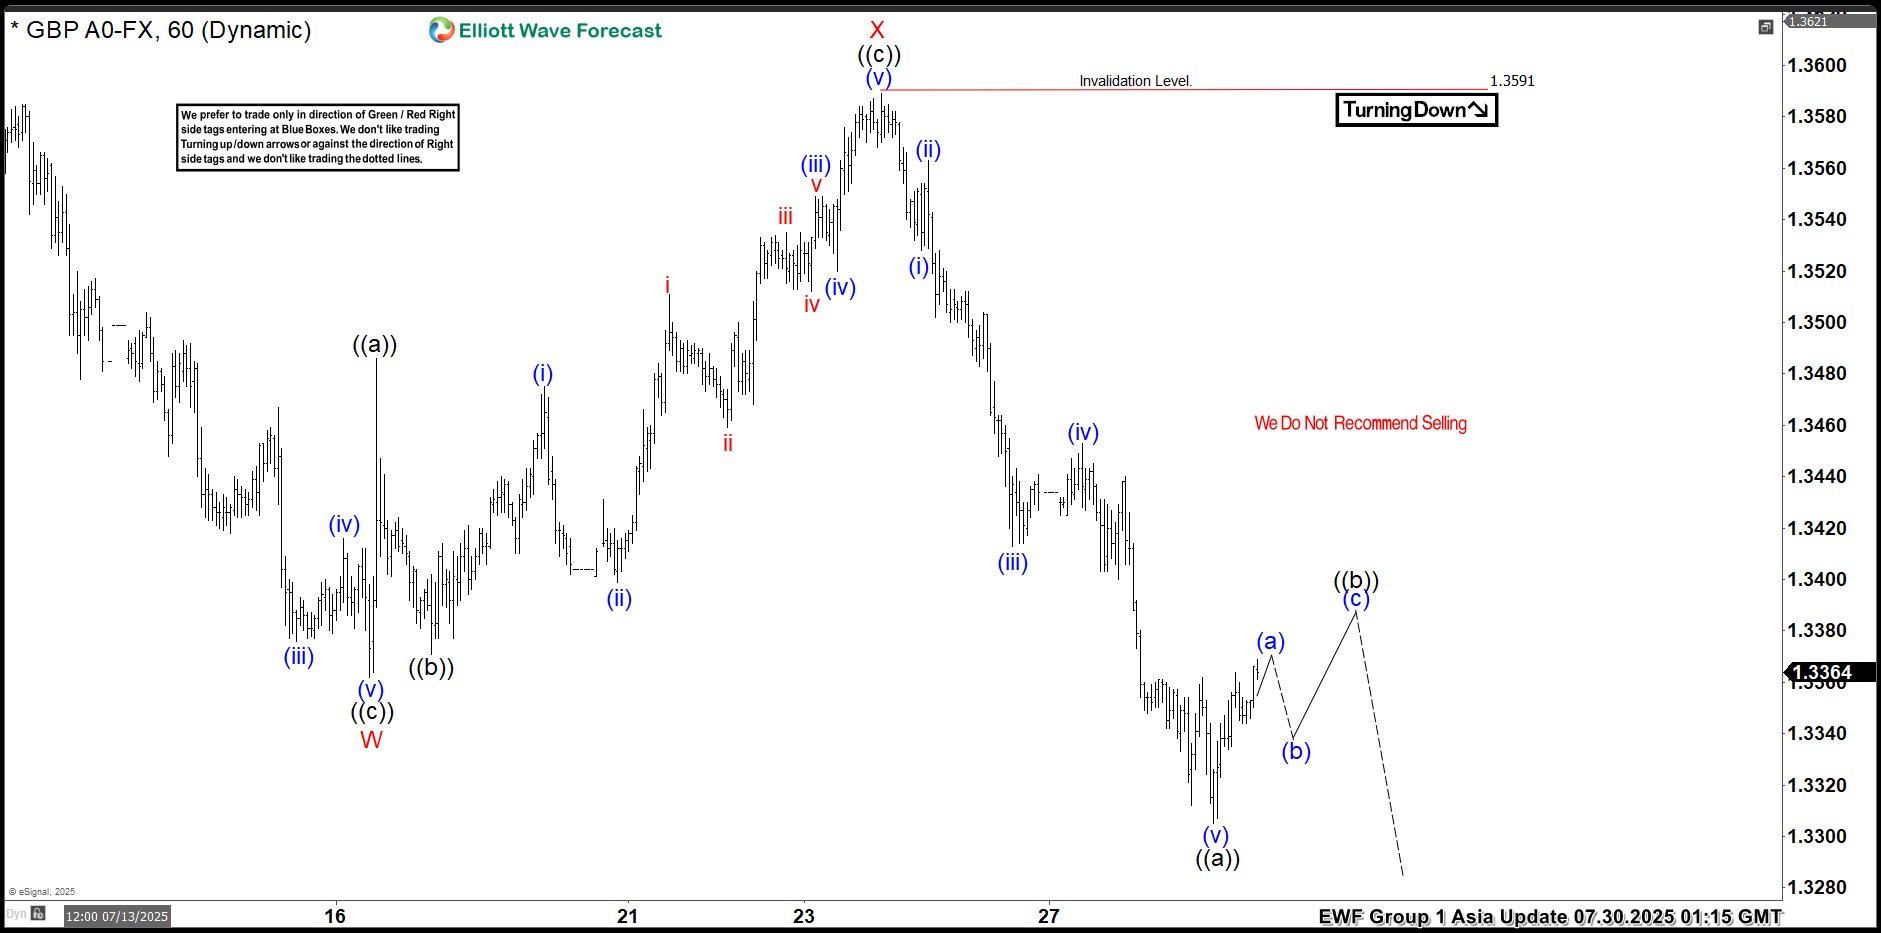
The GBPUSD is trading in higher high sequence from 9.22.2022 low in weekly. The bounce is corrective Elliott Wave sequence & expect further upside. It favors pullback in proposed 7 swings from 7.01.2025 high & extend into 1.3162 – 1.2898 area, while below 7.23.2025 high. It should find buyers in to extreme area for next leg higher in daily or at least 3 swings bounce. In 4-hour, it started correcting lower from 7.01.2025 high. It ended W at 1.3362 low of 7.16.2025 & X at 1.3589 high of 7.23.2025 each in 3 swings. Below X high, it favors downside in Y in 3 swings as it broke below 7.16.2025 low, expecting into extreme area. Within W, it ended ((a)) at 1.3523 low, ((b)) at 1.3620 high & ((c)) at 1.3362 low. Above there, it placed ((a)) at 1.3486 high, ((b)) at 1.3371 low & ((c)) as X connector at 1.3589 high. The double correction unfolds in 3-3-3 structure, which will completes, when current bounce fail below 7.23.2025 high to new low into extreme area. It ended ((a)) of Y into 0.618 – 0.764 Fibonacci extension area of W & expect 3 or 7 swings bounce in ((b)).
Below X high, it placed ((a)) of Y at 1.3305 low & favors bounce in ((b)) in 3 or 7 swings against 7.23.2025 high. Within ((a)), it ended (i) at 1.3528 low, (ii) at 1.3563 high, (iii) at 1.3413 low, (iv) at 1.3543 high & (v) at 1.3305 low. Above there, it favors bounce in (a) of ((b)) and expect small upside before it should pullback in (b). The next pullback in (b) should stay above 1.3305 low choppy price action before continue upside in (c). Ideally, ((b)) can bounce between 1.3413 – 1.3481 area as 0.382 – 0.618 Fibonacci retracement of ((a)) before continue lower. Wave ((b)) bounce expect to fail below 1.3591 high before extend lower in ((c)) into 1.3162 – 1.2898 to finish double correction. Because of higher high in daily since September-2022 low, it should find buyers in extreme area to resume higher. It expects sideways to higher until FOMC event followed by selloff, while bounce fail below 7.23.2025 high. We like to buy the pullback into extreme area for next leg higher or at least 3 swings reaction.
GBPUSD – 60-Minute Elliott Wave Technical Chart:
GBPUSD – Elliott Wave Technical Video:
https://www.youtube.com/watch?v=SzqapuFzQpo
Fed Policy Meeting Takes Center Stage
Markets
Yesterday’s first batch of US economic data wasn’t exactly groundbreaking. JOLTS job openings in June came in close to expectations with 7.43mln, easing from the 7.71mln in May while the July Conference Board’s consumer confidence indicator improved a bit more than expected from 95.2 to 97.2. The present situation was seen slightly less favourable than in June but only because of an upward revision to that month’s reading. The expectations component edged higher to 74.4 to nevertheless remain below both the pre- and post-pandemic levels. In any case it didn’t suffice for US yields to stop a decline that was already ongoing earlier in the day. A strong $44bn 7-year auction later only added to the drop. Net daily changes varied between -5.8 (2-yr) to -10.2 bps (30-yr). Such large moves also suggest some Treasury short covering ahead of tonight’s FOMC meeting. Bunds underperformed with yields adding up to 2.6 bps at the front. The sharp narrowing of interest rate differentials helped EUR/USD off the intraday lows but nothing more than that. The couple still lost the 1.1578 neckline to end the day at 1.1547. DXY tested the previous mid-July high at 98.95 but eventually closed below that intermediate resistance. USD/JPY snapped a three-day rise at 148.46. EUR/GBP (0.8648) followed through on technical return action lower after Monday’s failed test of the November 2023 high.
Some trade headlines have been hitting the wires over the last couple of hours again. China’s negotiator told reporters in the wake of a two-day meeting with US counterparts in Stockholm that they agreed on extending the current August 12 tariff deadline. UST Bessent was more cautious and said Trump will make the final call. In the talks with India, the US president said he thinks the country may end up with a 20-25% levy. Moving on to the busy economic calendar today we spot a French Q2 GDP beat this morning. Growing by 0.3% q/q was well above the 0.1% expected and follows a beat in Spain yesterday as well (0.7% q/q). Details were not as bright as the headline figure suggests though. Inventory building offset weak domestic demand and declining capital investments. Germany, Italy and the Euro area publish GDP numbers later today. The same goes for the US, where Q2 growth should have rebounded from an import-lead drag in Q1. The Fed policy meeting takes center stage though. While Powell is bound to leave rates unchanged at 4.25-4.5%, markets are particularly on the lookout for any hint regarding future easing now some (though definitely not all) of the tariff fog is ebbing away. While we don’t expect that to happen given talks with another major trading partner China are still ongoing and the relative resilience of the labour market, such a scenario would pressure the US dollar and rates. Money markets price in a 65% chance for a cut in September.
News & Views
Australian inflation eased to 0.7% q/q from 0.9% in 2025Q2, falling just shy of the 0.8% expected. The yearly print retreated to 2.1% from 2.4%, the lowest annual inflation rate since 2021Q1. Core gauges such as the trimmed mean and weighted median rose by 0.6% to be up 2.7% y/y. Per sector, annual goods inflation was down to 1.1% from 1.3% while services eased from 3.7% to 3.3%. The main contributors to the quarterly rise were housing (+1.2%), food and non-alcoholic beverages (+1%), and health (+1.5%) with transport (-0.7%) partially offsetting the rise due to automotive fuel (-3.4%). The numbers further solidify market expectations for an August rate cut by the Australian central bank (RBA). The RBA unexpectedly kept the policy rate unchanged at 3.85% earlier this month amid risks for a higher-than-expected Q2 CPI outcome. While technically having materialized (for the core gauge, at least), it was only marginal (2.7% vs the 2.6% the RBA expected). Front end Australian swap yields decline up to 4.5 bps. The Aussie dollar holds steady near the lower bound of an upward sloping channel around AUD/USD 0.6514.
Oil prices rebounded over the last days with yesterday’s 3.5% spike particularly catching the eye. Brent crude trades well north of $72/b, the highest since tensions in the Middle East hit a high after Israeli strikes on Iran. The latest uptick followed US president Trump drastically cutting the timeline for Russia to seek a ceasefire with Ukraine from 50 to 10 days. Failing to do so would prompt US sanctions on buyers of Russian oil, mainly China and India. This risks eventually ending up in millions of barrels of reduced Russian oil exports.
EUR/USD Daily Outlook
Daily Pivots: (S1) 1.1510; (P) 1.1554; (R1) 1.1590; More...
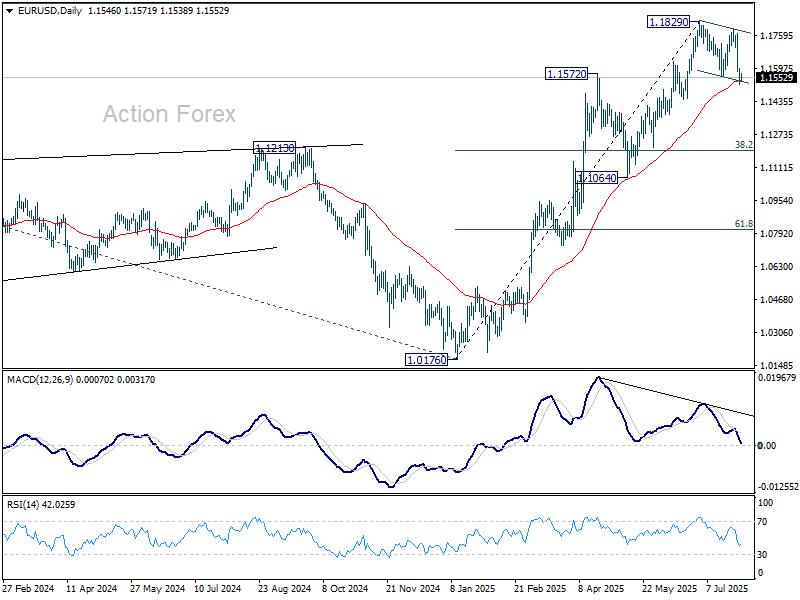
Focus stays on 55 D EMA (now at 1.1536). Sustained break there will argue that fall from 1.1829 is already correcting the whole rise from 1.0176. Deeper decline should then be seen to 38.2% retracement of 1.0176 to 1.1829 at 1.1198. Nevertheless, strong rebound from the EMA will maintain near term bullishness. Above 1.1598 minor resistance will turn intraday bias neutral first.
In the bigger picture, rise from 0.9534 long term bottom could be correcting the multi-decade downtrend or the start of a long term up trend. In either case, further rise should be seen to 100% projection of 0.9534 to 1.1274 from 1.0176 at 1.1916. This will remain the favored case as long as 1.1604 support holds.
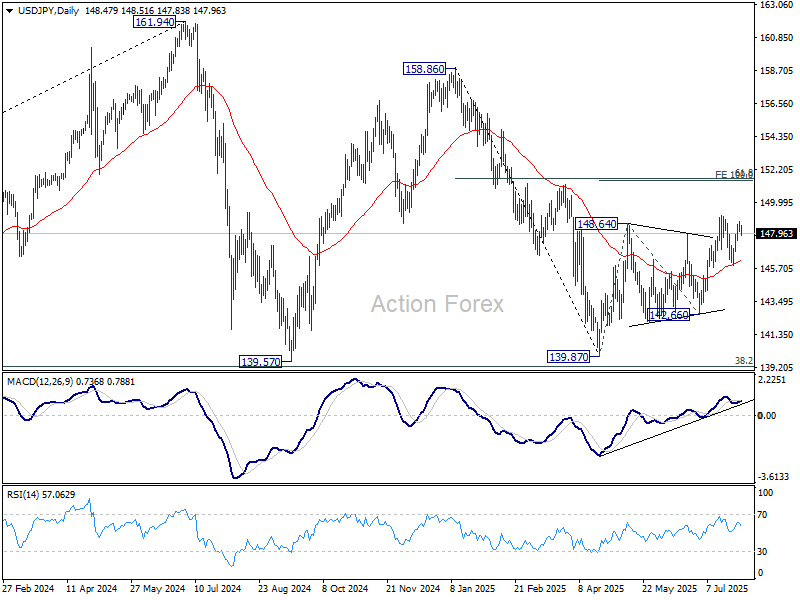
USD/JPY Daily Outlook
Daily Pivots: (S1) 148.15; (P) 148.48; (R1) 148.80; More...
Intraday bias in USD/JPY is turned neutral as it retreated ahead of 149.17 resistance. On the upside, firm break of 149.17 will resume the whole rise from 139.87 to 100% projection of 139.87 to 148.64 from 142.66 at 151.43, which is close to 151.22 fibonacci level. However, break of 147.50 support will extend the corrective pattern from 149.17, and target 145.84 support.
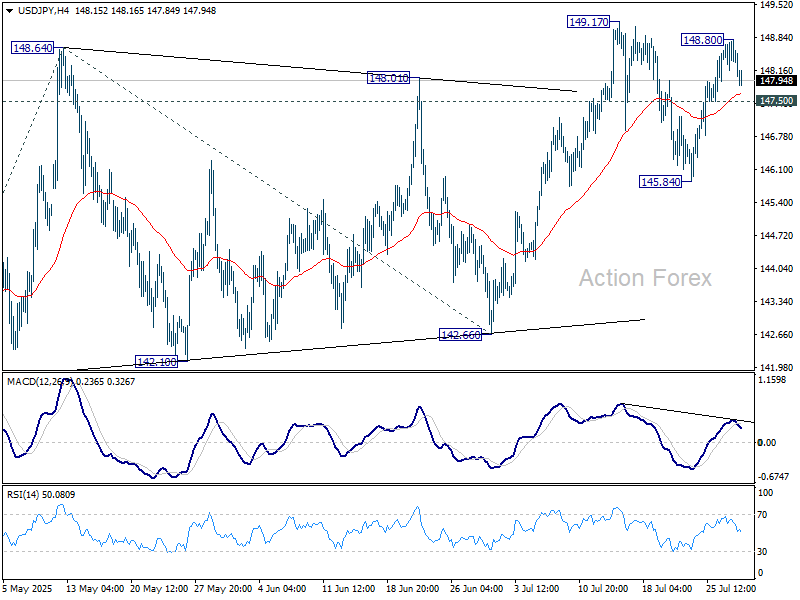
In the bigger picture, price actions from 161.94 (2024 high) are seen as a corrective pattern to rise from 102.58 (2021 low). Decisive break of 61.8% retracement of 158.86 to 139.87 at 151.22 will argue that it has already completed with three waves at 139.87. Larger up trend might then be ready to resume through 161.94 high. In case the corrective pattern extends with another fall, strong support is expected from 38.2% retracement of 102.58 to 161.94 at 139.26 to bring rebound.
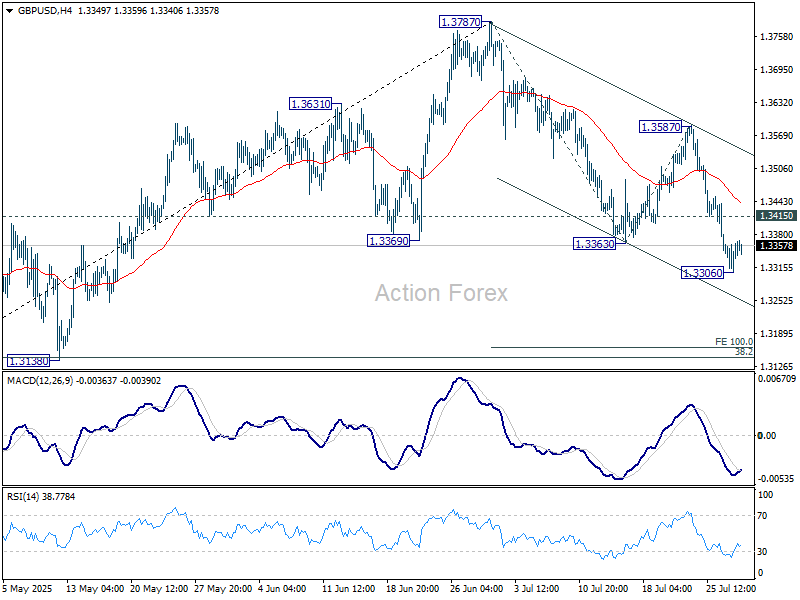
GBP/USD Daily Outlook
Daily Pivots: (S1) 1.3316; (P) 1.3342; (R1) 1.3376; More...
Intraday bias in GBP/USD is turned neutral with 4H MACD crossed above signal line. Some consolidations would be seen but risk will stay on the downside as long as 1.3587 resistance holds. Fall from 1.3787 is seen as a correction to the whole rise from 1.2099. Below 1.3306 will target 100% projection of 1.3787 to 1.3363 from 1.3587 at 1.3163.
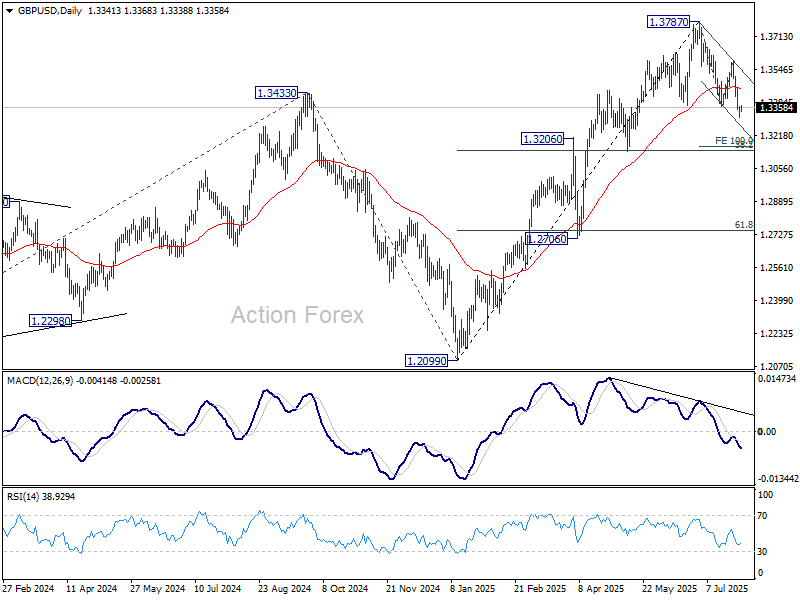
In the bigger picture, up trend from 1.3051 (2022 low) is in progress. Next medium term target is 61.8% projection of 1.0351 to 1.3433 from 1.2099 at 1.4004. Outlook will now stay bullish as long as 55 W EMA (now at 1.3045) holds, even in case of deep pullback.
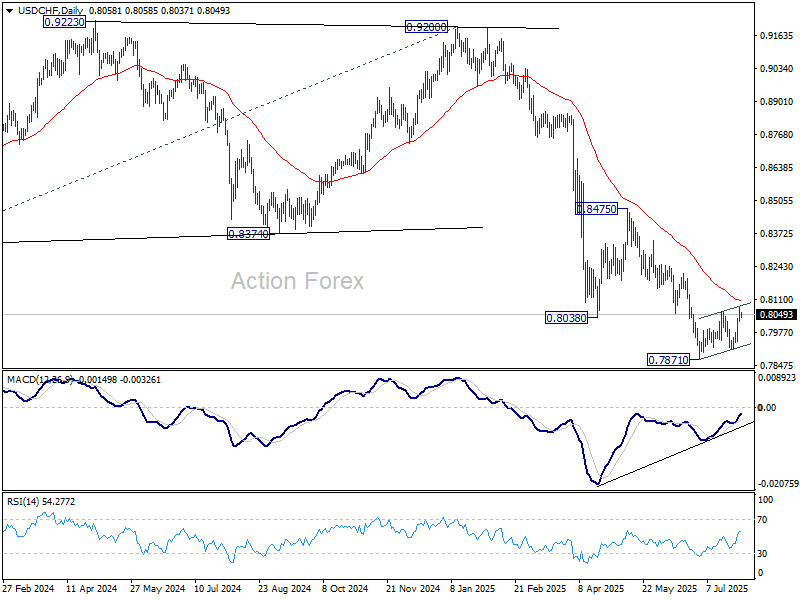
USD/CHF Daily Outlook
Daily Pivots: (S1) 0.8022; (P) 0.8050; (R1) 0.8090; More….
USD/CHF's corrective bounce from 0.7871 might extend higher. But upside should be limited by 55 D EMA (now at 0.8105). On the downside, below 0.8023 minor support will turn intraday bias neutral first. However, sustained trading above 55 D EMA will indicate medium term bottoming, and target 0.8475 resistance next.
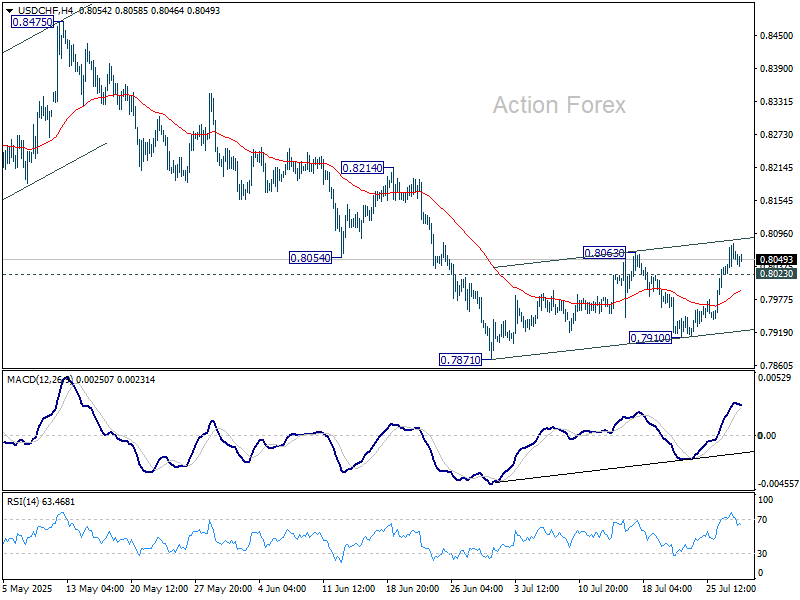
In the bigger picture, long term down trend from 1.0342 (2017 high) is still in progress. Next target is 100% projection of 1.0146 (2022 high) to 0.8332 from 0.9200 at 0.7382. In any case, outlook will stay bearish as long as 0.8475 resistance holds.
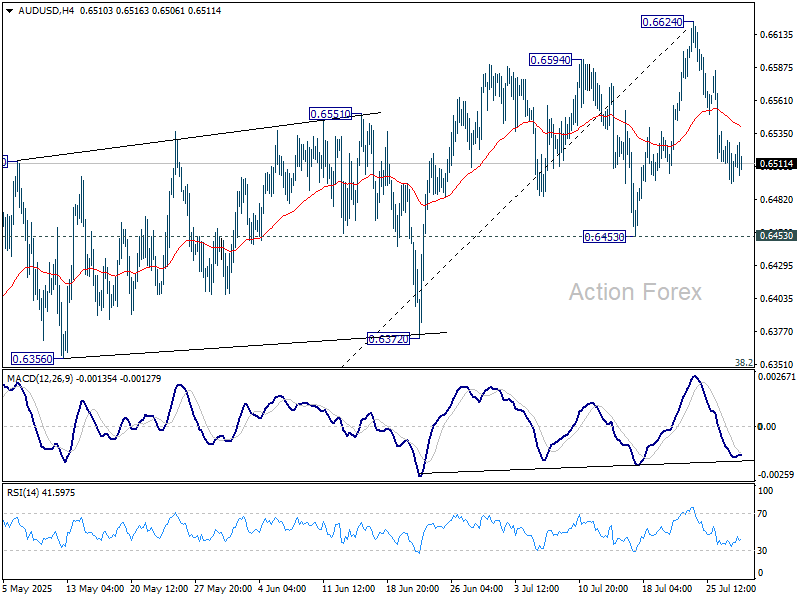
AUD/USD Daily Report
Daily Pivots: (S1) 0.6494; (P) 0.6512; (R1) 0.6528; More...
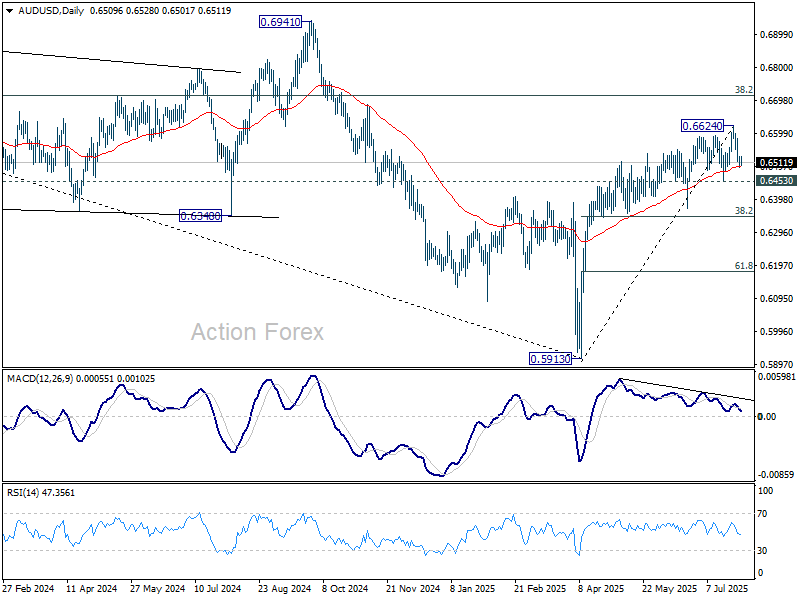
Intraday bias in AUD/USD remains neutral for the moment. Rally from 0.5913 might still extend through 0.6624. However, considering bearish divergence condition in D MACD, upside should be limited by 0.6713 fibonacci level on next rise. Meanwhile, firm break of 0.6453 will turn bias back to the downside for deeper fall.
In the bigger picture, there is no clear sign that down trend from 0.8006 (2021 high) has completed. Rebound from 0.5913 is seen as a corrective move. While stronger rally cannot be ruled out, outlook will remain bearish as long as 38.2% retracement of 0.8006 to 0.5913 at 0.6713 holds. Nevertheless, considering bullish convergence condition in W MACD, even in case of another fall through 0.5913, downside should be contained above 0.5506 (2020 low).
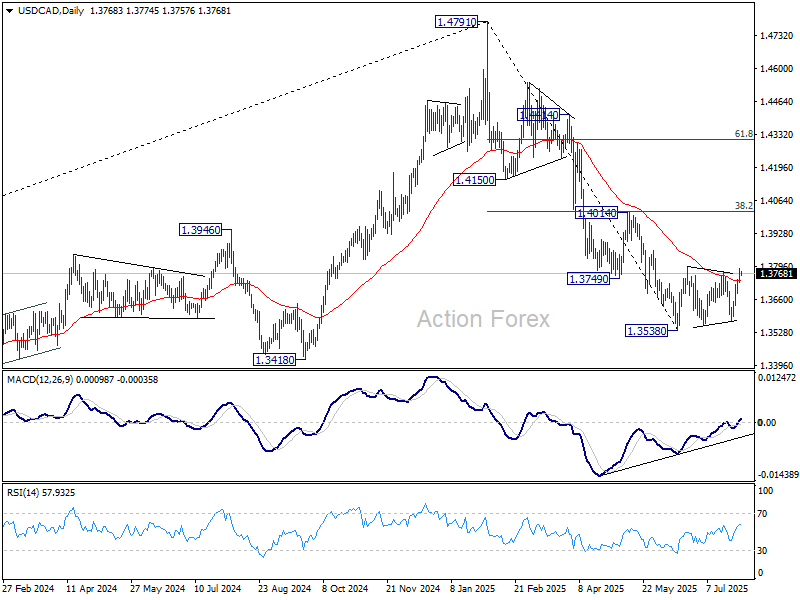
USD/CAD Daily Outlook
Daily Pivots: (S1) 1.3738; (P) 1.3763; (R1) 1.3797; More...
USD/CAD's break of 1.3773 resistance and 55 D EMA suggests that price actions from 1.3538 are already correcting the whole fall from 1.4791. Intraday bias is back on the upside with further rally, possibly towards 1.4014 cluster resistance (38.2% retracement of 1.4791 to 1.3538 at 14017). But strong resistance should be seen there to limit upside. On the downside, below 1.3687 minor support will turn intraday bias neutral first.
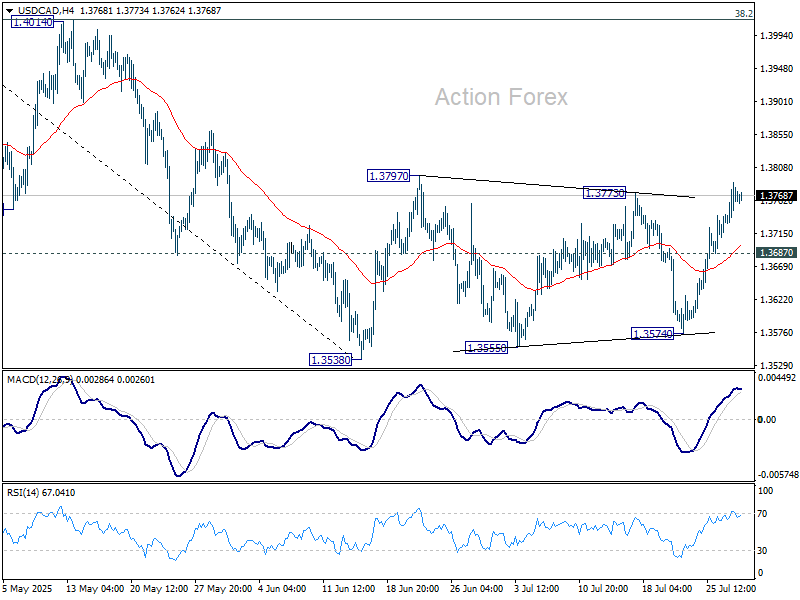
In the bigger picture, price actions from 1.4791 medium term top could either be a correction to rise from 1.2005 (2021 low), or trend reversal. In either case, further decline is expected as long as 1.4014 resistance holds. Next target is 61.8% retracement of 1.2005 (2021 low) to 1.4791 at 1.3069.