

Sample Category Title
Australian Dollar Under Pressure, CPI Expected to Ease
The Australian dollar is down for a fourth straight day. In the European session, AUD/USD is trading at 0.6497, down 0.36% on the day. The Aussie has slipped 1.5% in the current slide, as the US dollar continues to make inroads against most of the major currencies.
Australian CPI expected to ease to 2.2%
Australia's inflation rate has been falling and that trend is to continue in the second quarter report, which will be released on Wednesday. CPI is expected to ease to 2.2% y/y, down from 2.4% in Q1, which was the lowest level since Q1 2021. Quarterly, CPI is expected to tick lower to 0.8% in Q2, down from 0.9% in Q1.
The markets will be keeping a close eye on services inflation, which has been persistently well above the Reserve Bank of Australia's 2%-3% target. In the first-quarter report, services inflation fell to 3.7%, down sharply from 4.3% in Q4 2024.
Underlying inflation has also declined. The trimmed mean, the RBA's key gauge of core CPI, dropped to 2.9% y/y Q1, down from 3.2% in Q4 2020, which was the lowest level since Q4 2021.
If inflation eased in Q2, it will likely cement a rate cut at the next meeting on Aug. 12. The RBA is looking to lower rates, which will help growth and ease the inflation squeeze on consumers.
The RBA shocked the markets earlier this month when it maintained rates, as the markets had widely expected a quarter-point trim. The money markets have priced in a rate cut at the Aug. 12 meeting at around 87% and it's very unlikely that the Reserve Bank will blindside the markets at two straight meetings, which would hurt the central bank's credibility.
AUD/USD Technical
- AUD/USD has pushed below support at 0.6514 and is testing 0.6500. Below, there is support at 0.6484
- There is resistance at 0.6530 and 0.6544
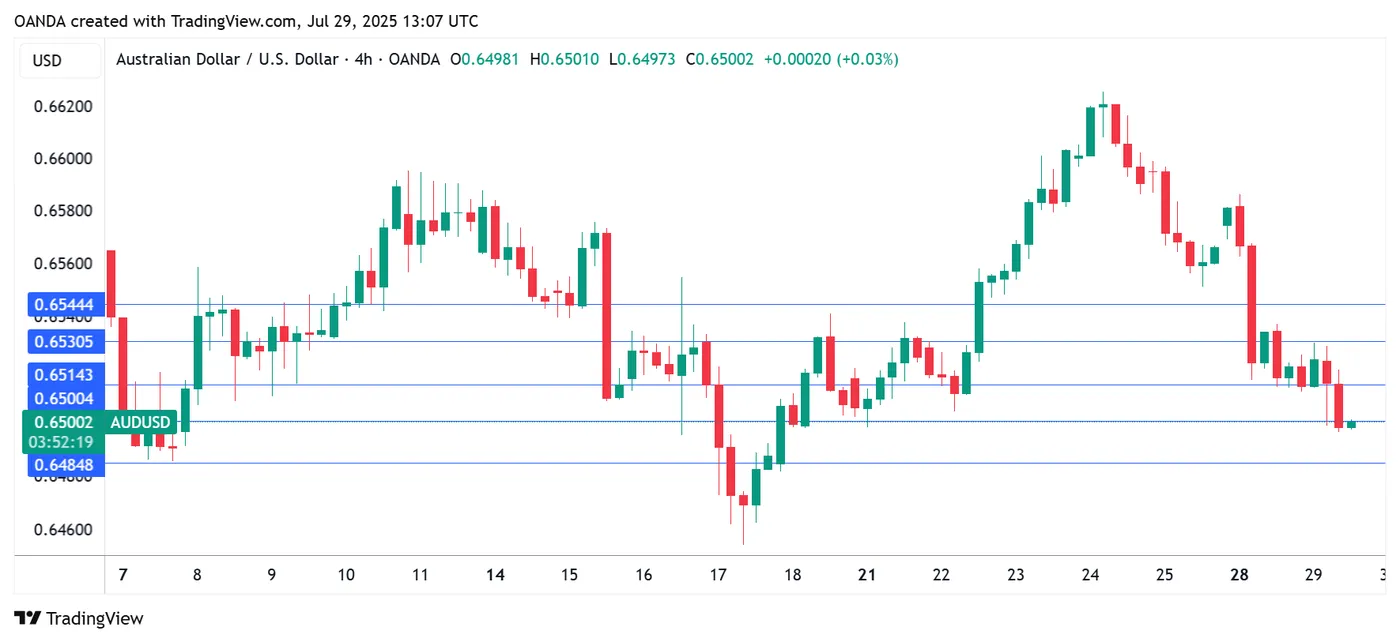
AUDUSD 4-Hour-Chart, July 29, 2025
USD/JPY Mid-Day Outlook
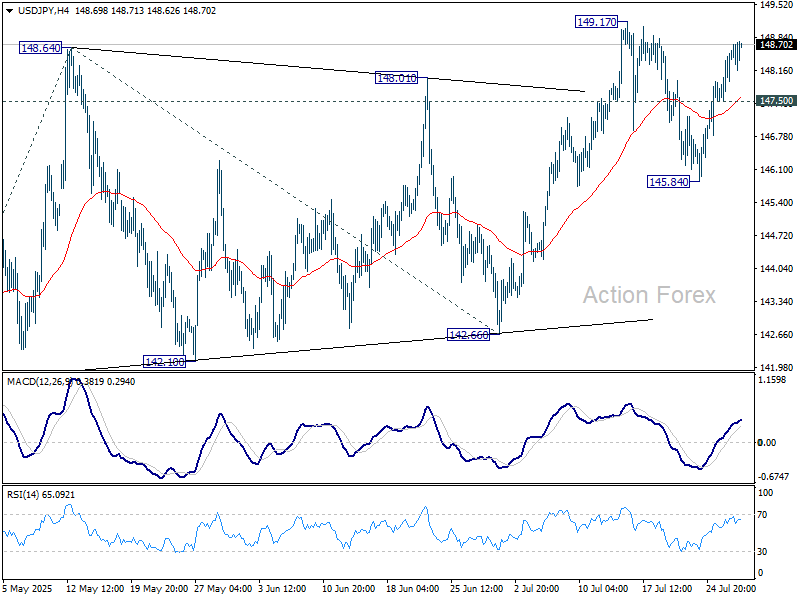
Daily Pivots: (S1) 147.85; (P) 148.22; (R1) 148.91; More...
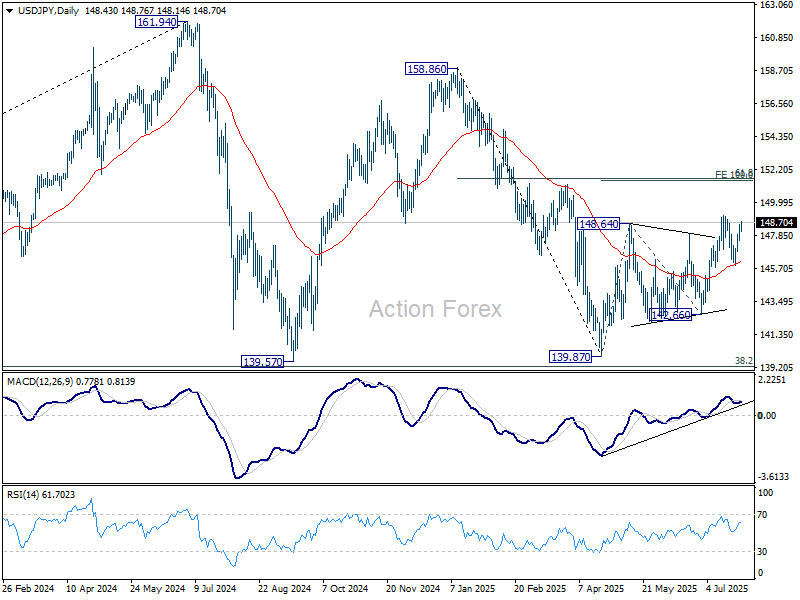
Intraday bias in USD/JPY stays on the upside for retesting 149.17 resistance. Firm break there will resume whole rise from 139.87 to 100% projection of 139.87 to 148.64 from 142.66 at 151.43, which is close to 151.22 fibonacci level. On the downside, below 147.50 minor support will turn intraday bias neutral first. But risk will stay on the upside as long as 145.84 support holds, in case of retreat.
In the bigger picture, price actions from 161.94 (2024 high) are seen as a corrective pattern to rise from 102.58 (2021 low). Decisive break of 61.8% retracement of 158.86 to 139.87 at 151.22 will argue that it has already completed with three waves at 139.87. Larger up trend might then be ready to resume through 161.94 high. In case the corrective pattern extends with another fall, strong support is expected from 38.2% retracement of 102.58 to 161.94 at 139.26 to bring rebound.
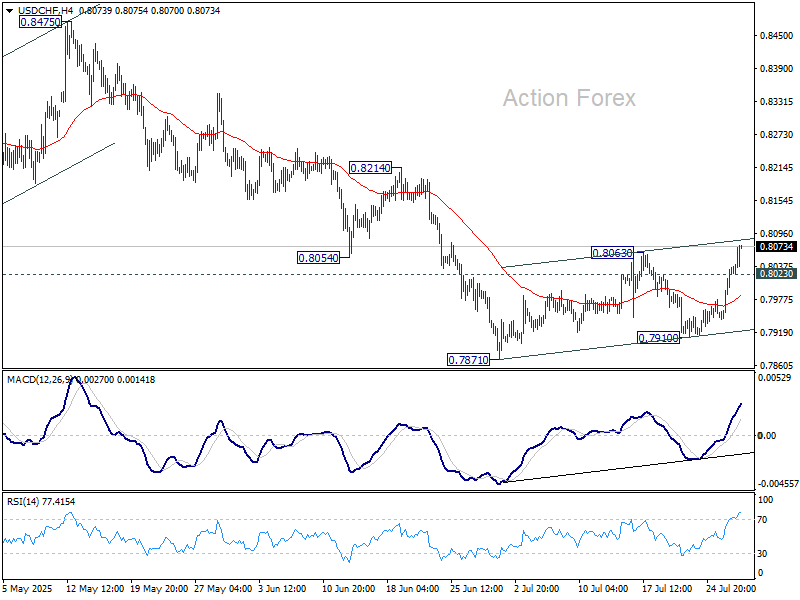
USD/CHF Mid-Day Outlook
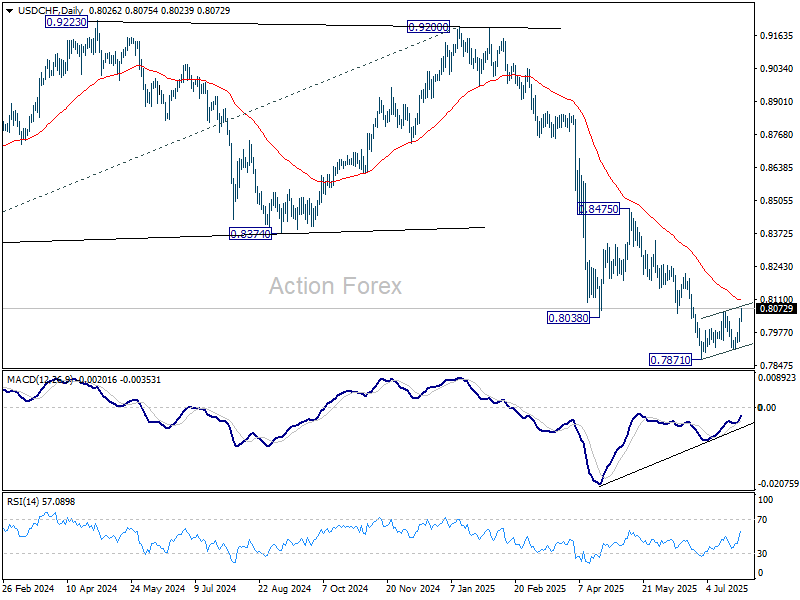
Daily Pivots: (S1) 0.7974; (P) 0.8007; (R1) 0.8068; More….
No change in USD/CHF's outlook and intraday bias stays on the upside. Price actions from 0.7871 are still seen as a corrective pattern. Further rise would be seen to 55 D EMA (now at 0.8107), but upside should be limited there. On the downside, below 0.8023 minor support will turn intraday bias neutral first. However, sustained trading above 55 D EMA will indicate medium term bottoming, and target 0.8475 resistance next.
In the bigger picture, long term down trend from 1.0342 (2017 high) is still in progress. Next target is 100% projection of 1.0146 (2022 high) to 0.8332 from 0.9200 at 0.7382. In any case, outlook will stay bearish as long as 0.8475 resistance holds.
GBP/USD Mid-Day Outlook
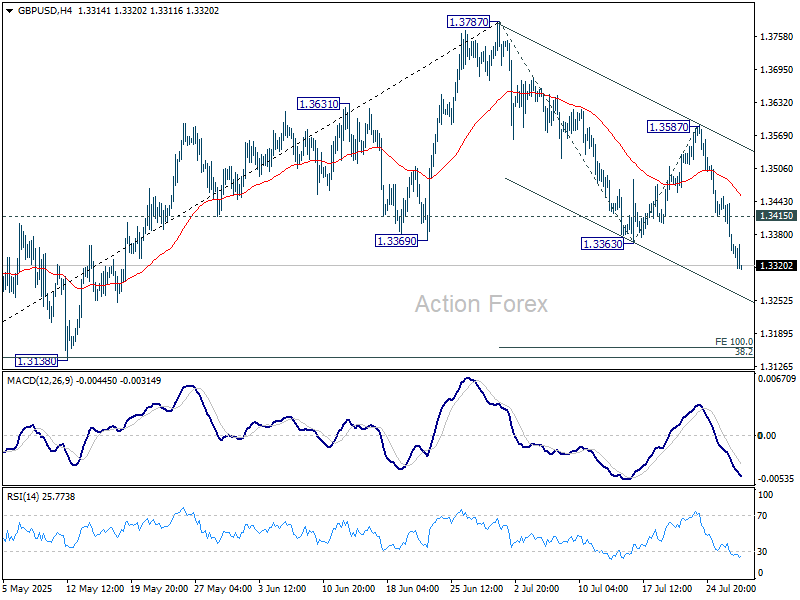
Daily Pivots: (S1) 1.3320; (P) 1.3386; (R1) 1.3422; More...
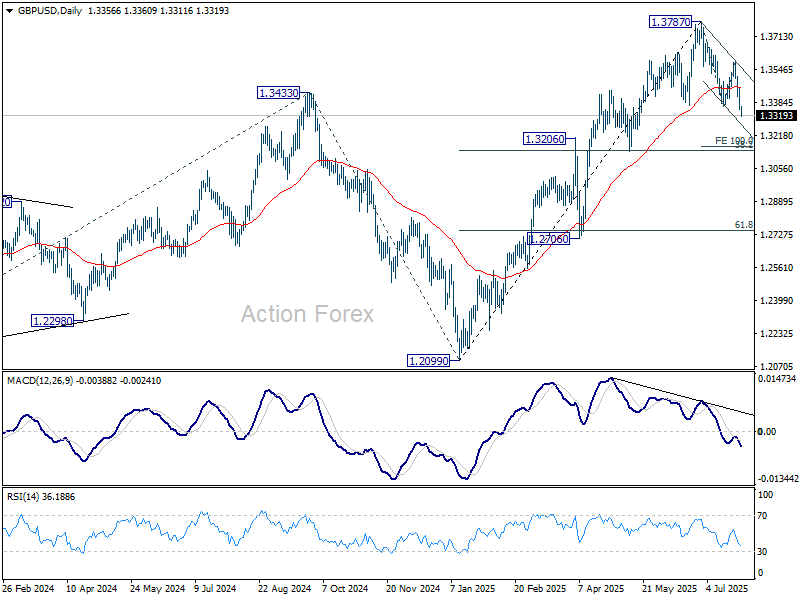
Intraday bias in GBP/USD remains on the downside for the moment. Fall from 1.3787 is seen as correcting whole rise from 1.2099. Deeper fall would be seen to 100% projection of 1.3787 to 1.3363 from 1.3587 at 1.3163. On the upside, above 1.3415 minor resistance will turn intraday bias neutral first. But risk will stay on the downside as long as 1.3587 resistance holds, in case of recovery.
In the bigger picture, up trend from 1.3051 (2022 low) is in progress. Next medium term target is 61.8% projection of 1.0351 to 1.3433 from 1.2099 at 1.4004. Outlook will now stay bullish as long as 55 W EMA (now at 1.3045) holds, even in case of deep pullback.
EUR/USD Mid-Day Outlook
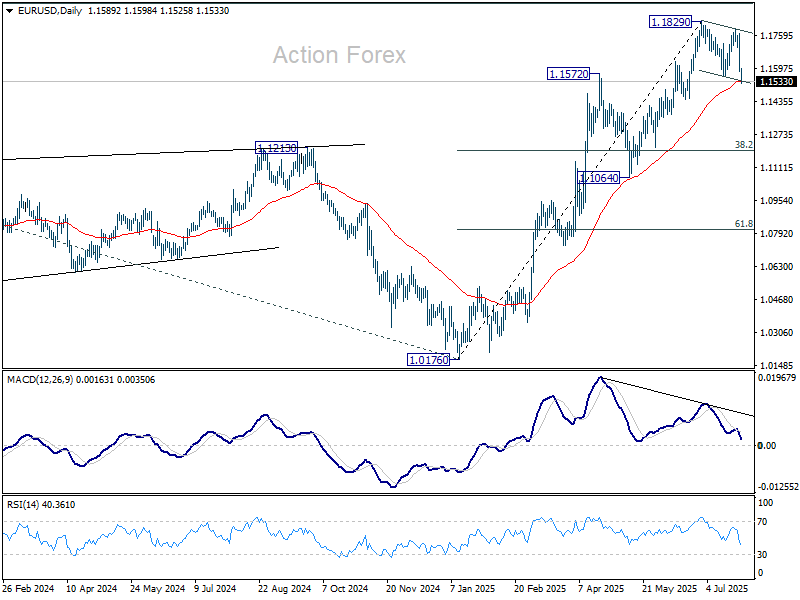
Daily Pivots: (S1) 1.1526; (P) 1.1648; (R1) 1.1711; More...
Intraday bias in EUR/USD remains on the downside with focus on 55 D EMA (now at 1.1538). Sustained break there will argue that fall from 1.1829 is already correcting the whole rise from 1.0176. Deeper decline should then be seen to 38.2% retracement of 1.0176 to 1.1829 at 1.1198. Nevertheless, strong rebound from the EMA will maintain near term bullishness. Above 1.1598 minor resistance will turn intraday bias neutral first.
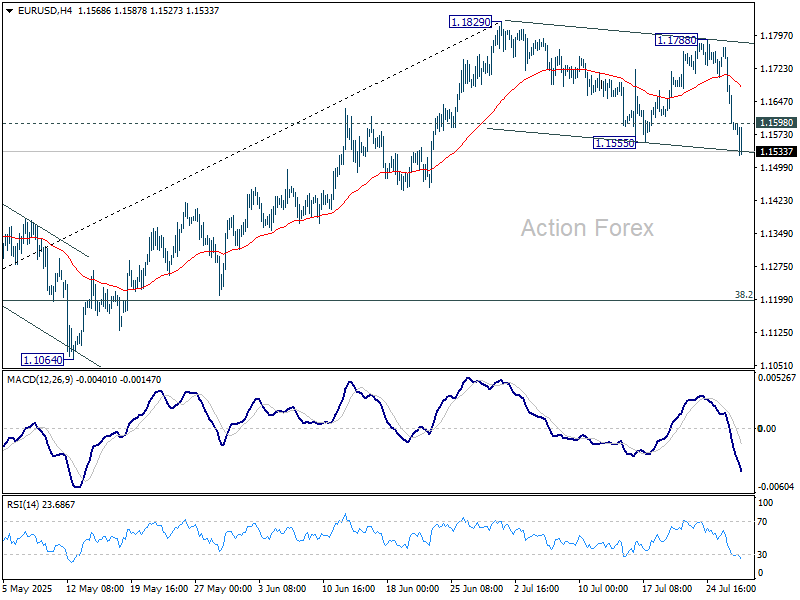
In the bigger picture, rise from 0.9534 long term bottom could be correcting the multi-decade downtrend or the start of a long term up trend. In either case, further rise should be seen to 100% projection of 0.9534 to 1.1274 from 1.0176 at 1.1916. This will remain the favored case as long as 1.1604 support holds.
Markets Back Dollar Strength, Await Australian Inflation Clarity
Dollar’s broad-based advance continues today, underpinned by firm sentiment that recent US trade deals with the EU and Japan mark the clearing of major global trade risks, at least for now. Though US–China talks continue in Stockholm, markets appear unbothered. Officials on both sides have indicated willingness to negotiate terms and extend the August 12 tariff truce by another 90 days. The absence of escalation risk is helping to sustain a risk-on bias, even if a full breakthrough is still pending.
Euro, meanwhile, continues to lag. Even as EU politicians criticize the terms of the US-EU framework agreement, equity markets seem more constructive. Germany’s DAX and France’s CAC 40 both gained more than 1% in early European trade, lifted by a string of upbeat earnings reports and relief that trade escalation was at least avoided.
This divergence in sentiment is visible across currencies. Dollar tops the leaderboard this week so far, followed by Loonie and Yen. On the other side, Euro is the weakest performer, trailed by the Franc and Kiwi. Aussie and Sterling are stuck in the middle.
Next up, focus turns to Australia’s Q2 CPI due in the Asian session. Headline inflation is expected to slow from 2.4% yoy to 2.2% yoy, continuing the steady down trend from 7.8% yoy peak in Q4 2022. The RBA held rates steady last month on a split vote of 6-3. Since then, jobs data have softened while price growth remains sticky. A soft CPI reading would help cement the case for another rate cut in August.
Technically, AUD/USD has been clearly losing upward momentum since May, as seen in D MACD. But there is not clear sign of topping yet. However, firm break of 0.6453 support will argue that it will at least be correcting the rebound from 0.5913, and target 38.2% retracement of 0.5913 to 0.6624 at 0.6352.

In Europe, at the time of writing, FTSE is up 0.54%. DAX is up 1.10%. CAC is up 1.20%. UK 10-year yield is down -0.017 at 4.638. Germany 10-year yield is up 0.002 at 2.695. Earlier in Asia, Nikkei fell -0.79%. Hong Kong HSI fell -0.15%. Singapore Strait Times rose 0.33%. Singapore Strait Times fell -0.28%. Japan 10-year JGB yield rose 0.006 to 1.575.
ECB survey shows inflation fears recede, growth pessimism softens
Eurozone consumers are dialing back their inflation expectations, according to the ECB's latest Consumer Expectations Survey for June. Median one-year inflation expectations fell from 2.8% to 2.6%, fully reversing the uptick seen in March and April. Longer-term expectations remained anchored, with three-year and five-year outlooks steady at 2.4% and 2.1% respectively, the latter unchanged for seven consecutive months.
Household sentiment on spending also weakened. Expected nominal spending growth dropped to 3.2% in June, down from 3.5% in May and 3.7% in April. The continued decline suggests rising caution among consumers, likely driven by lingering geopolitical uncertainty, uneven wage growth, and lower perceived price pressures ahead.
On growth, expectations became slightly less negative. Median expectations for economic growth over the next 12 months improved to -1.0% from -1.1% in May and -1.9% in April. Still, households broadly expect economic contraction, reflecting the Eurozone’s fragile recovery and ongoing concerns around trade, manufacturing, and domestic demand.
EUR/USD Mid-Day Outlook
Daily Pivots: (S1) 1.1526; (P) 1.1648; (R1) 1.1711; More...
Intraday bias in EUR/USD remains on the downside with focus on 55 D EMA (now at 1.1538). Sustained break there will argue that fall from 1.1829 is already correcting the whole rise from 1.0176. Deeper decline should then be seen to 38.2% retracement of 1.0176 to 1.1829 at 1.1198. Nevertheless, strong rebound from the EMA will maintain near term bullishness. Above 1.1598 minor resistance will turn intraday bias neutral first.
In the bigger picture, rise from 0.9534 long term bottom could be correcting the multi-decade downtrend or the start of a long term up trend. In either case, further rise should be seen to 100% projection of 0.9534 to 1.1274 from 1.0176 at 1.1916. This will remain the favored case as long as 1.1604 support holds.
USD/JPY: Bulls Start to Lose Traction Ahead of Key Barriers But Still Hold Grip
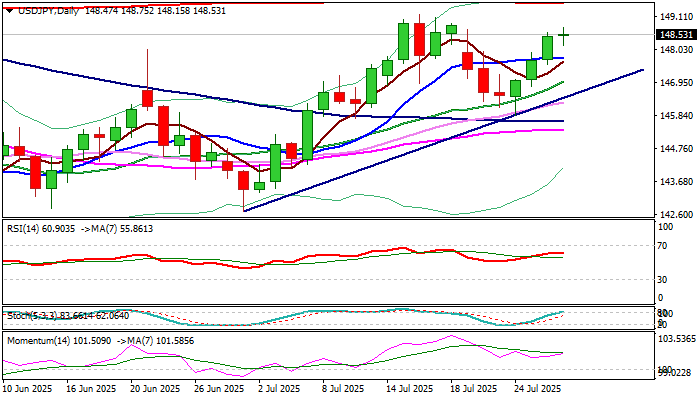
Strong rally in past three days started to run out of steam on Tuesday, as daily action was so far shaped in long-legged Doji candle that signals indecision.
Bulls show signs of fatigue after retracing over 76.4% of 149.18/145.85 bear-leg and hitting recovery high just under key near-term support at 149.18 (July 16 peak), where the rally faced headwinds.
Overbought daily Stochastic contributes to developing negative signals, but overall picture on daily chart remains firmly bullish, suggesting that consolidation or shallow correction may precede fresh push higher, with probe through 149.18 and 149.53 (200DMA) to expose psychological 150 barrier.
Dips should ideally find support at 147.70/50 zone (10DMA / Fibo 38.2% of 145.85/148.75 upleg) to mark a healthy correction and keep bulls intact.
Res: 148.75; 149.18; 149.53; 150.00.
Sup: 148.06; 147.65; 147.50; 147.30.
Pound Falls to 9-Week Low, UK Food Inflation Jumps
The British pound is down for a fourth straight day, as the US dollar is showing strength against most of the majors. The pound has declined 1.5% in the current slide.
In the European session, GBP/USD is trading at 1.3338, down 0.10% on the day. The pound fell as low as 1.3315 earlier, its lowest level since May 19.
UK food inflation rises
UK inflation has been going up, so it was no surprise that the British Retail Consortium (BRC) Shop Price Index jumped 0.7% in July, up sharply from 0.4% in June and above the forecast of 0.2%.
Food inflation rose for a six consecutive month, rising 4.0% y/y in July, up from 3.7% in June. The driver of the increase was a rise in the cost of meat and tea. The increase in food prices helped boost UK inflation, which climbed to 3.6% y/y in June from 3.4% in May.
Consumers are being squeezed by rising inflation and high interest rates and are responding by holding tighter on the purse strings. The Confederation of British Industry (CBI) reported today that retail sales volumes continue to fall sharply, with a reading of -34 in July. This was an improvement from -46 in June but missed the forecast of -28.
Despite the fact that inflation is moving the wrong way, the markets expect that the Bank of England will lower interest rates next month. The central bank wants to trim the current cash rate of 4.25% and boost the economy, but the upward risk of inflation remains a headache for BoE policymakers who don't want to see inflation continue to move away from the Bank's 2% target.
GBP/USD Technical
- GBP/USD is putting pressure on support at 1.3337. This is followed by support at 1.3321
- There is resistance at 1.3359 and 1.3375
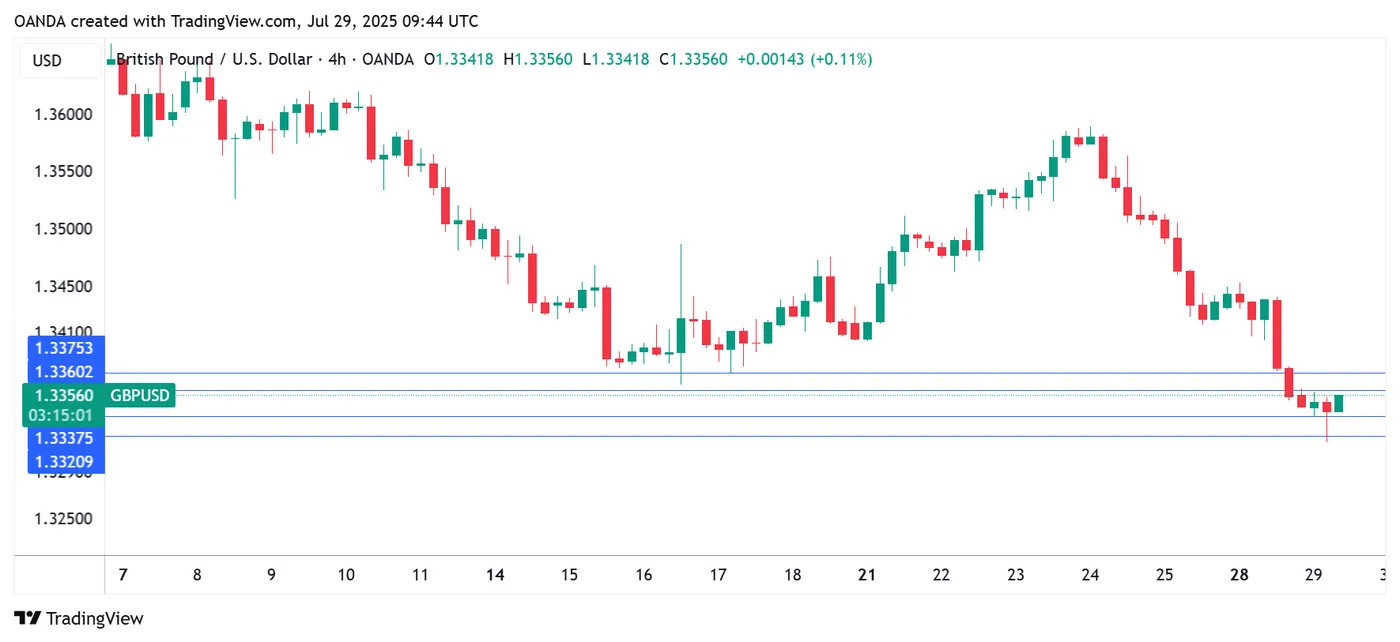
GBPUSD 4-Hour Chart, July 29, 2025
Ethereum continues attempt to climb above $4,000
Market Overview
The crypto market lost 1%, falling back to a capitalisation of $3.9 trillion. This was a natural pullback against the backdrop of the dollar’s impressive strengthening the day before. However, on Tuesday, the bulls were back in charge, bringing the market back to a level above Monday’s opening but not yet reaching its peak.
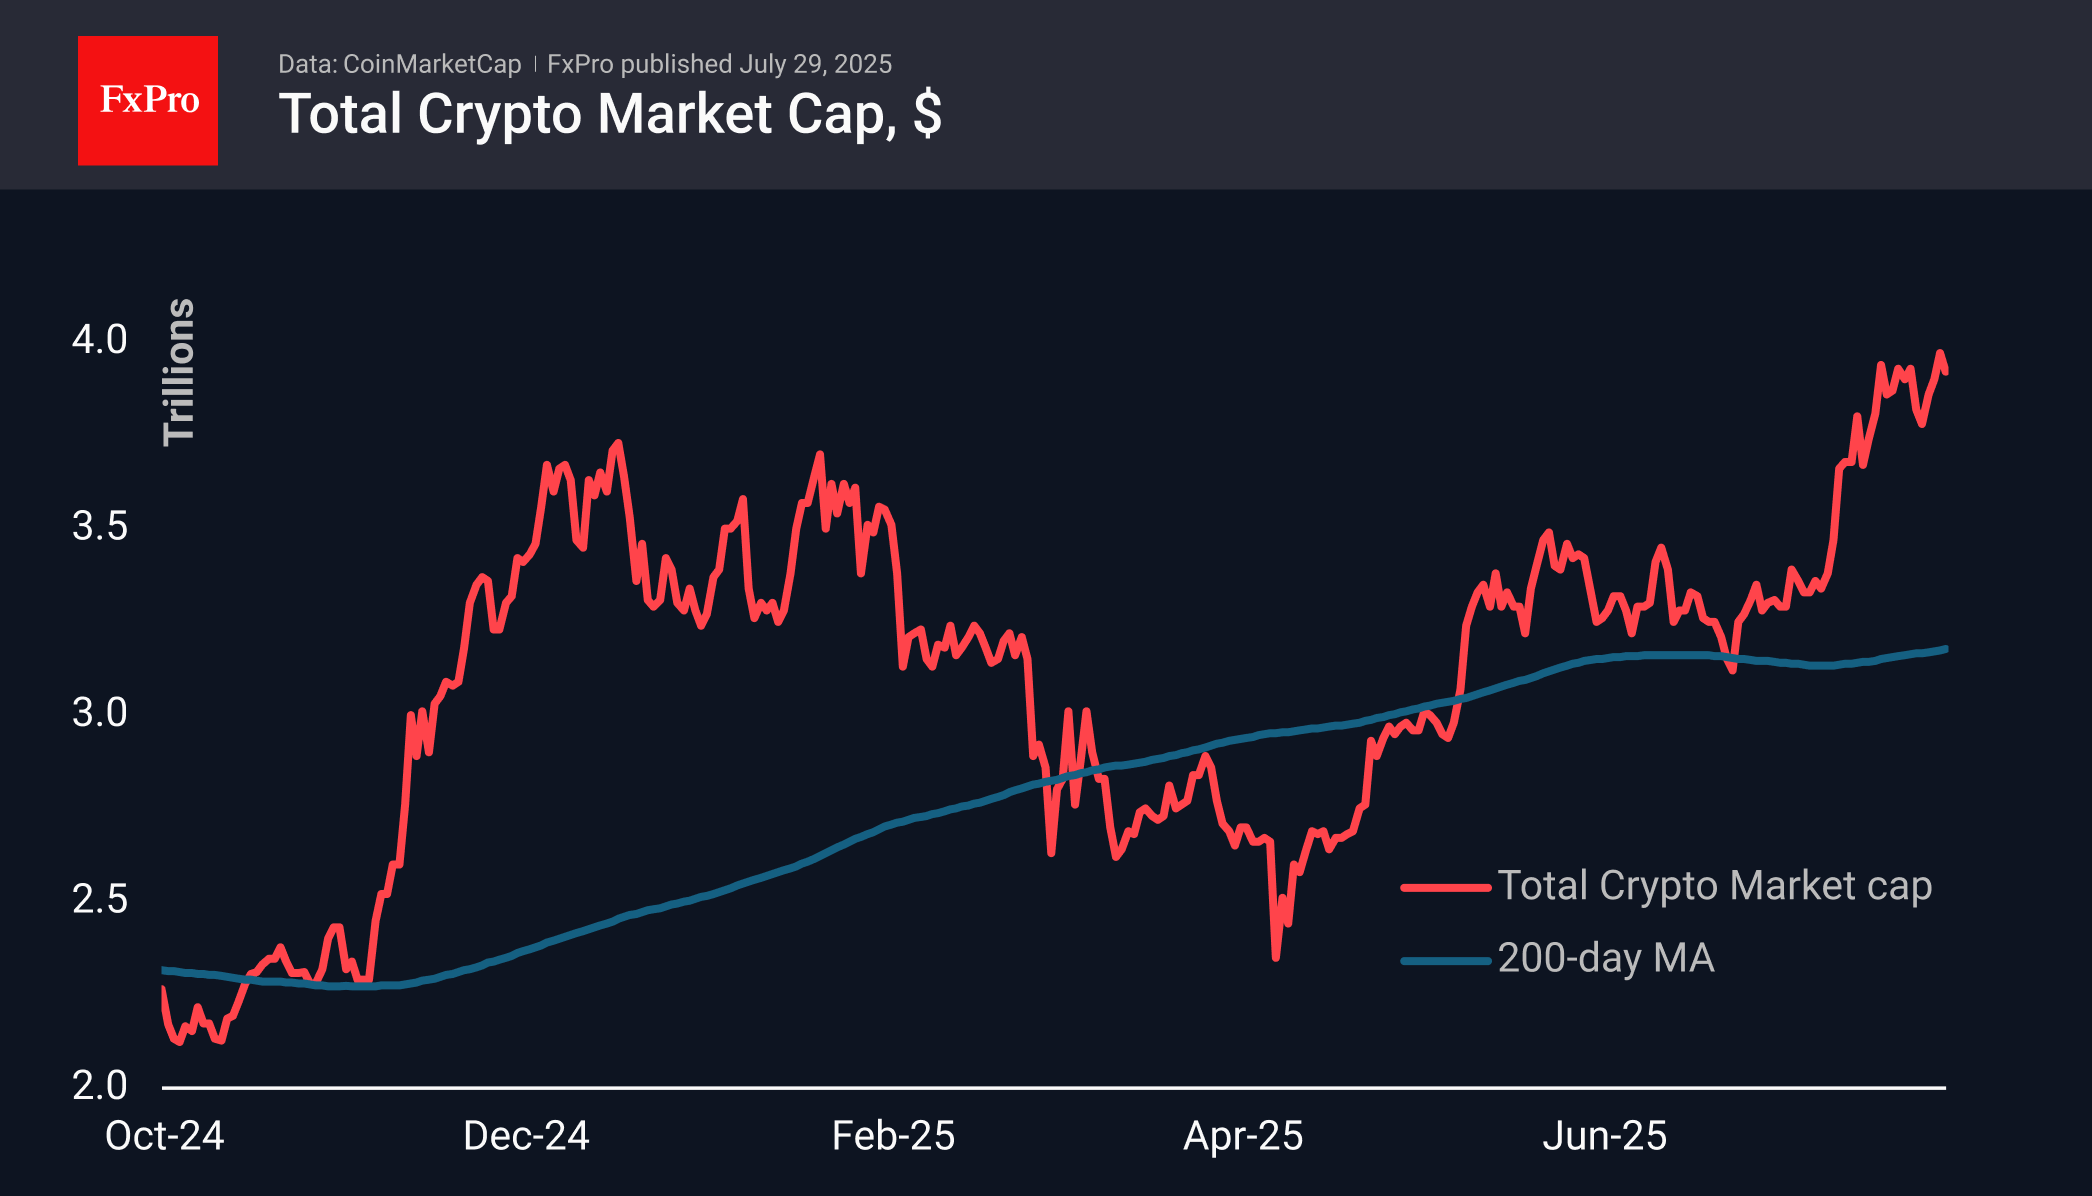
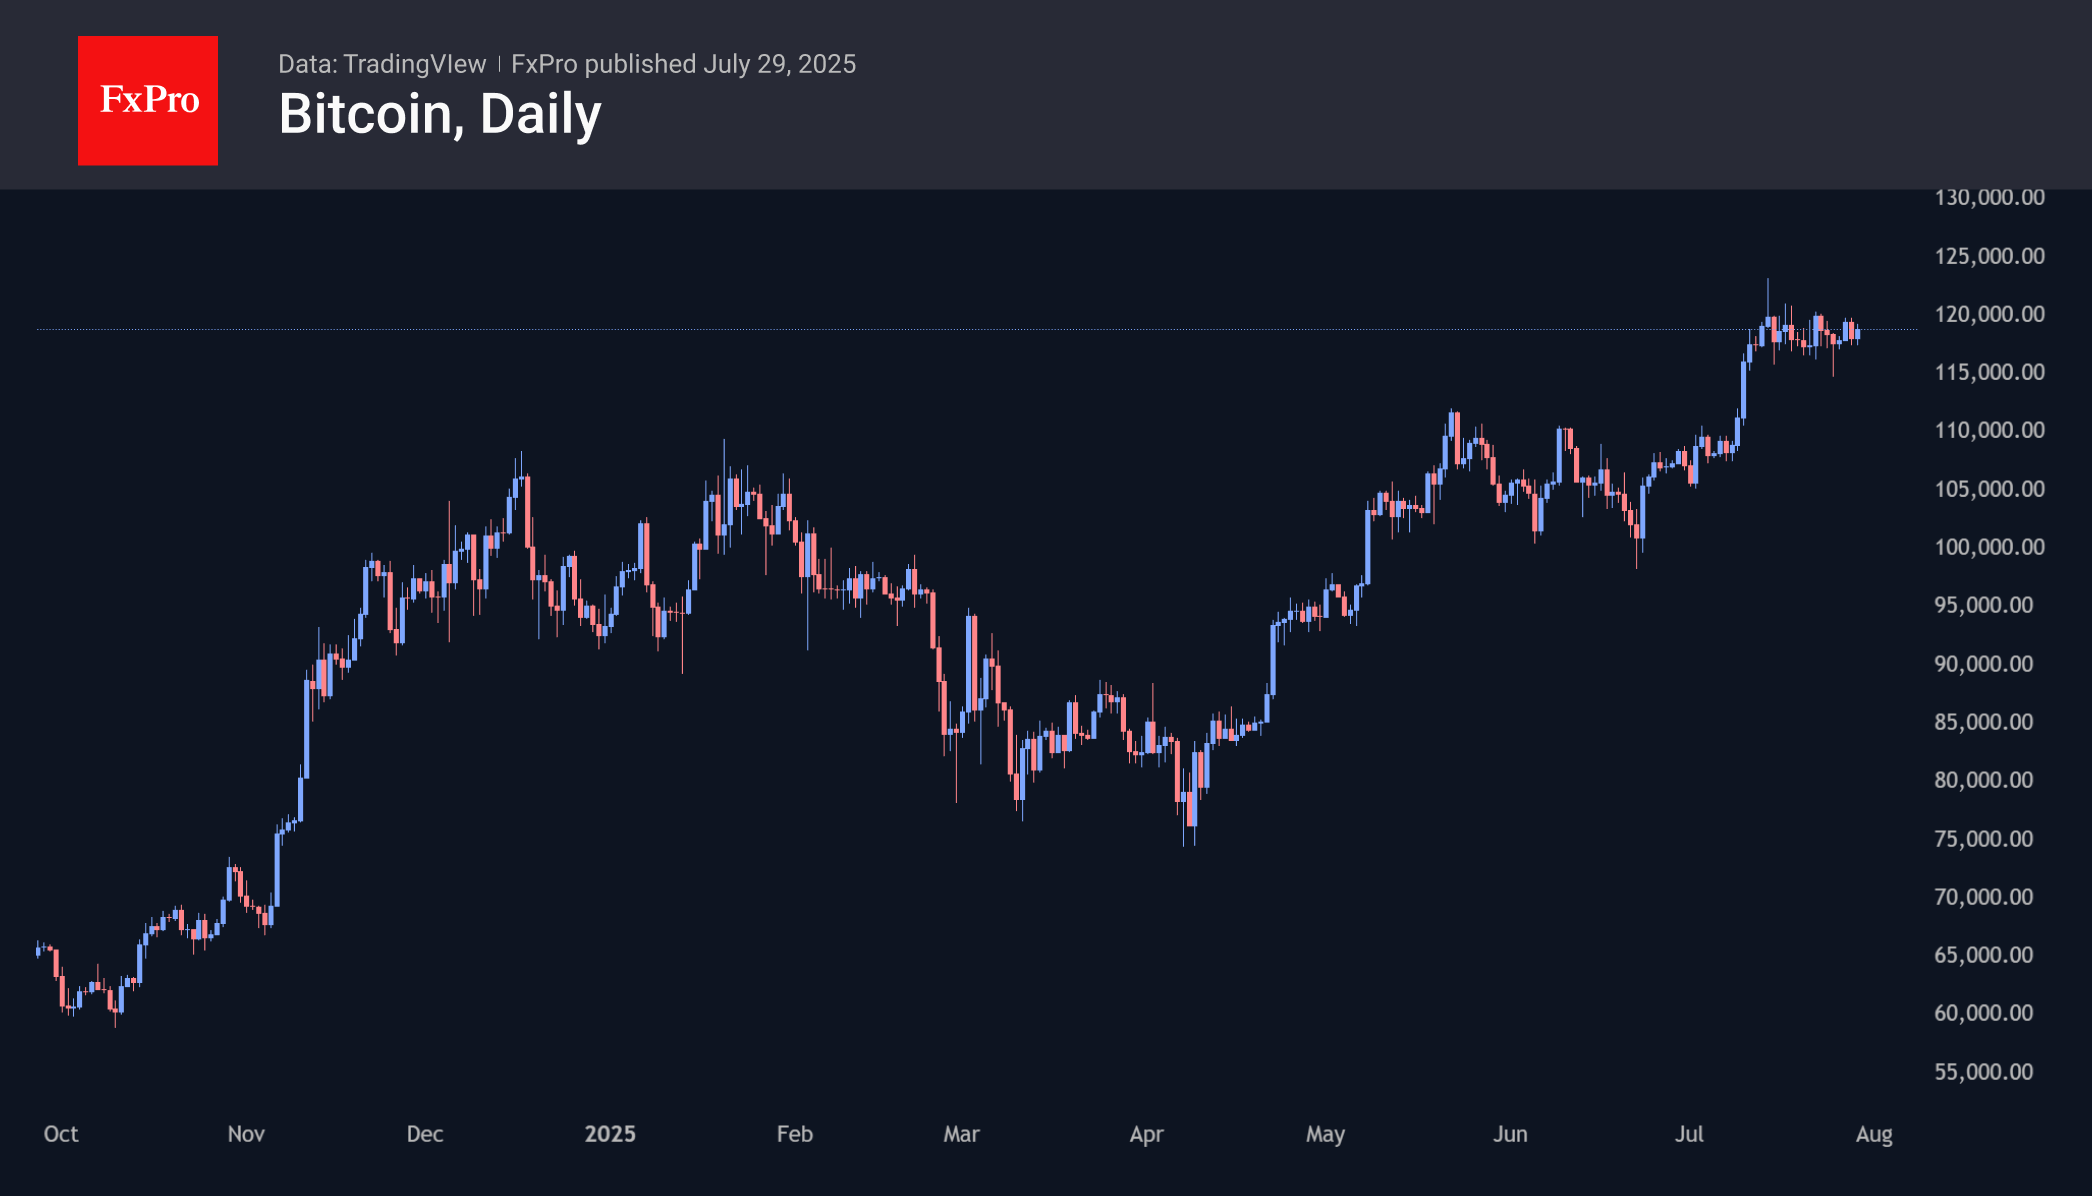
Bitcoin is trading near $118.7K, unable to break through the resistance at $120K. This indecision to break out of the range is likely to continue until the market sees the Fed’s key rate decision on Wednesday evening.
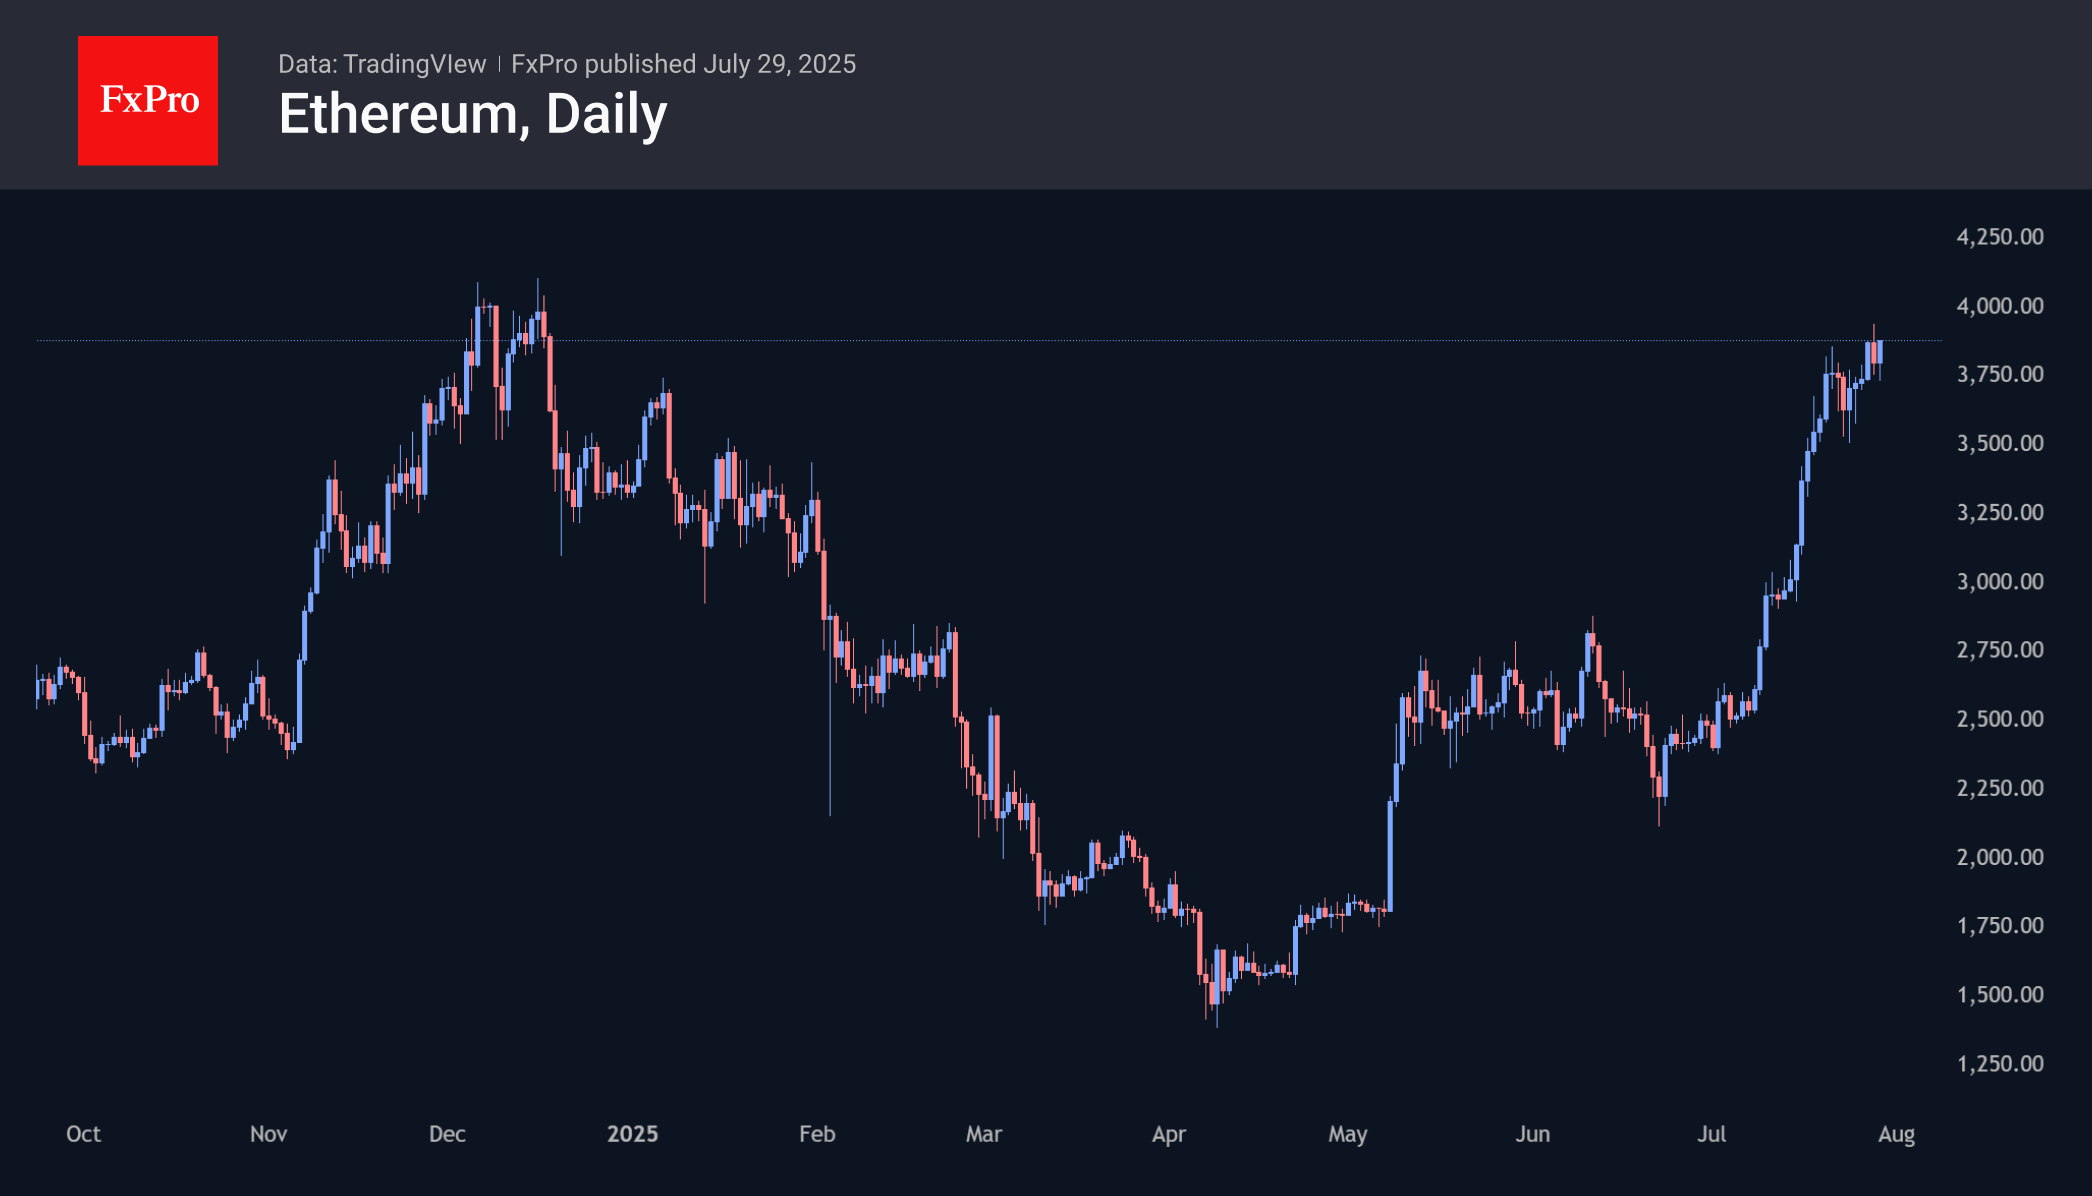
Ethereum rose to $3,930 at the end of the day, fell back to $3,700 on Monday, where it found interest from new buyers and rose to $3,830 at the time of writing. The last seven days have seen a fairly sharp upward trend, and if this trend continues, the price will rise above $4,000 by the end of this week.
News Background
According to CoinShares, global investment inflows into crypto funds last week amounted to $1.908 billion. Investments in Ethereum increased by $1.595 billion, Solana by a significant $312 million, XRP by $190 million, and Sui by $8 million. Investments in Bitcoin decreased by $175 million.
Japan’s Metaplanet announced the acquisition of 780 BTC ($92.5 million) at an average price of $118,600. The company’s total reserves now amount to 17,132 BTC, worth over $2 billion.
According to Blockware, Bitcoin will no longer show ‘parabolic’ rallies or ‘devastating’ bear cycles, as institutional investors have changed the market dynamics and reduced volatility.
According to Strategic ETH Reserve, the volume of the second cryptocurrency on the balance sheets of public companies has reached 2.32 million ETH (~$9.11 billion) — 1.92% of the total Ethereum supply. Bitmine Immersion Tech, associated with Fundstrat founder Tom Lee, pursues the most aggressive strategy. The company has ~566,800 ETH ($2.23 billion) on its balance sheet.
BNB, the fifth-largest cryptocurrency by capitalisation, updated its historical high above $860 on Monday. Against this background, Binance founder Changpeng Zhao’s estimated fortune exceeded $76 billion. According to Forbes, Zhao owns 64% of the BNB supply — about 89.1 million tokens.
US Dollar Index (DXY) Reaches One-Month High
The US Dollar Index (DXY) has risen to its highest level since early July. According to media reports, the bullish sentiment in the market is driven by the following factors:
→ Optimism around US trade agreements. A new trade deal with the EU — which includes a 15% tariff on European goods — is being perceived by the market as favourable for the United States.
→ Confidence in the resilience of the US economy. Strong Q2 corporate earnings have acted as an additional bullish catalyst. Investors may have started covering short positions against the dollar, viewing concerns over a US slowdown as overstated.
→ Expectations that the Federal Reserve will keep interest rates on hold.
From a technical standpoint, today’s DXY chart reflects strengthening bullish momentum.
Technical Analysis of the DXY Chart
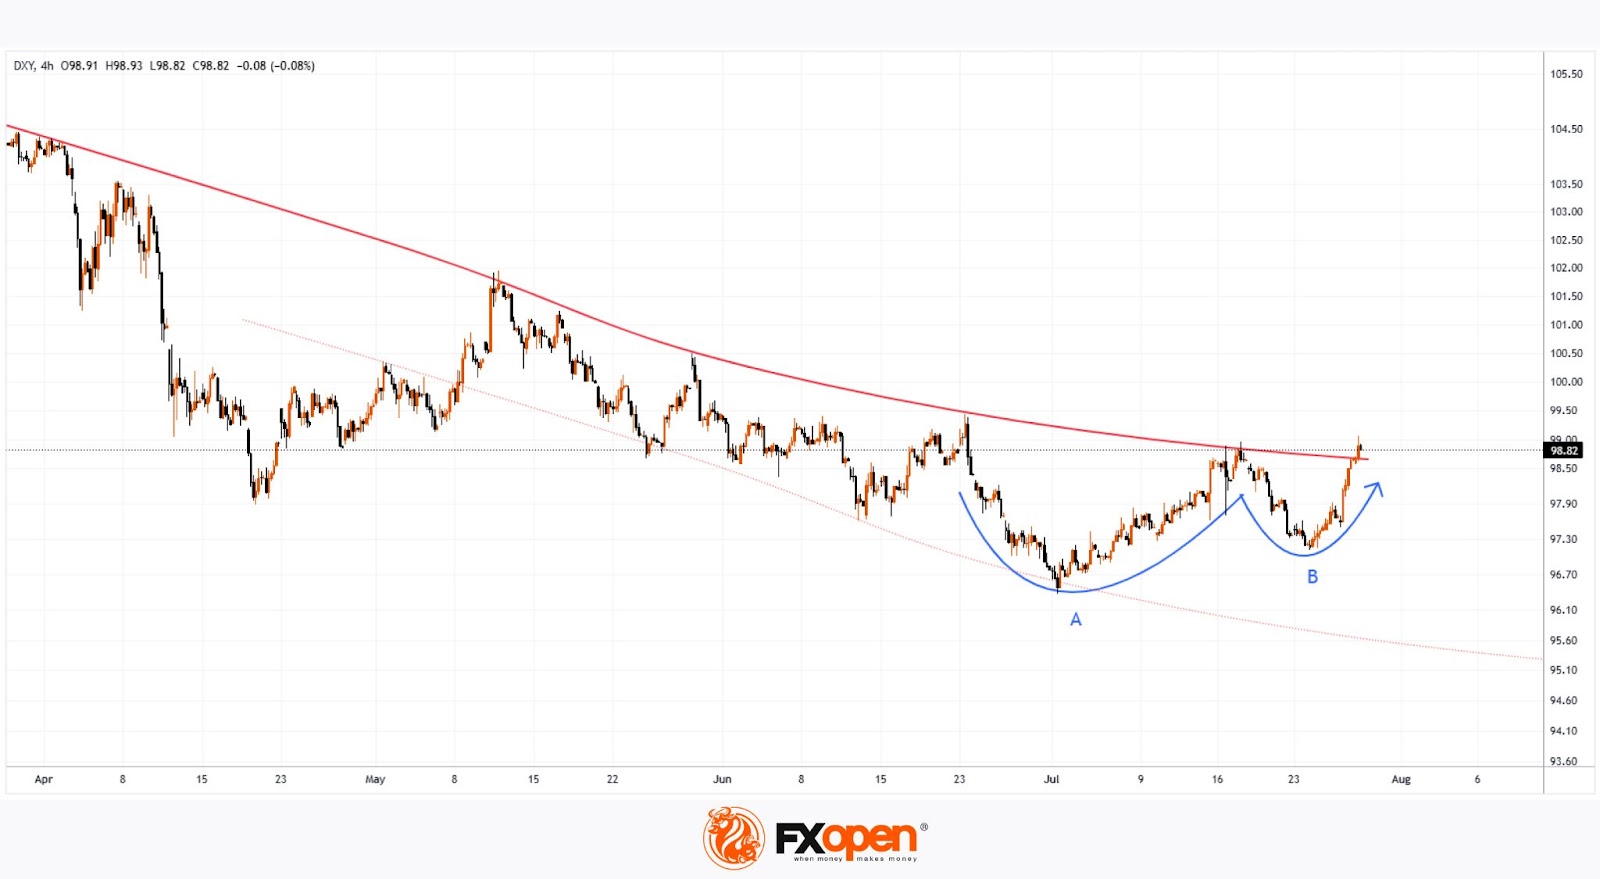
Two U-shaped formations (A and B) that developed over the summer have created a bullish сup and рandle pattern — a formation that suggests waning bearish pressure, as evidenced by the shallower second dip.
This setup points to the potential for a bullish breakout above the trendline (marked in red) that has defined the downward movement in the DXY throughout the first half of 2025.
As previously analysed, there are signs that the dollar index may have found a base following a period of decline. This could indicate a shift in market sentiment and the possible end of the recent bearish phase.
Trade global index CFDs with zero commission and tight spreads. Open your FXOpen account now or learn more about trading index CFDs with FXOpen.
This article represents the opinion of the Companies operating under the FXOpen brand only. It is not to be construed as an offer, solicitation, or recommendation with respect to products and services provided by the Companies operating under the FXOpen brand, nor is it to be considered financial advice.