Sample Category Title
Ranges hold in EUR/USD and stocks even as US-EU deal slammed
Investor sentiment cooled overnight as markets reassessed the US–EU trade agreement more critically. While initially welcomed for averting harsher tariff scenarios, the deal is now being viewed by many as a near-term drag on European growth. What once seemed like a "good deal" in absolute terms is now being interpreted as a relative setback for the EU economy.
Political backlash within Europe has intensified. French Prime Minister Francois Bayrou called the framework a "dark day" for Europe, accusing the bloc of capitulating to US demands. German Chancellor Friedrich Merz also warned that the tariffs embedded in the deal would inflict “significant” damage on Germany’s export-driven economy.
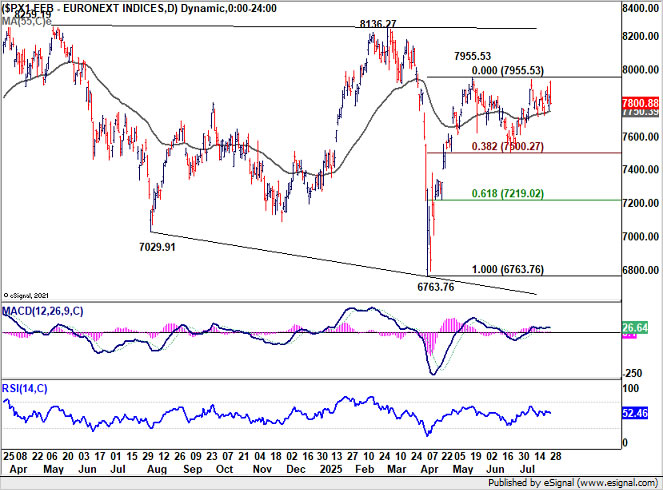
Despite the rhetoric, equity market reactions remained contained. Germany’s DAX lost -1.02% and France’s CAC fell -0.43%, but both indexes remain within tight sideways trading ranges. In the US, DOW dipped slightly by -0.14% while S&P 500 eked out a small gain of 0.02%, signaling that investors don’t see the agreement as overwhelmingly skewed toward American interests either.
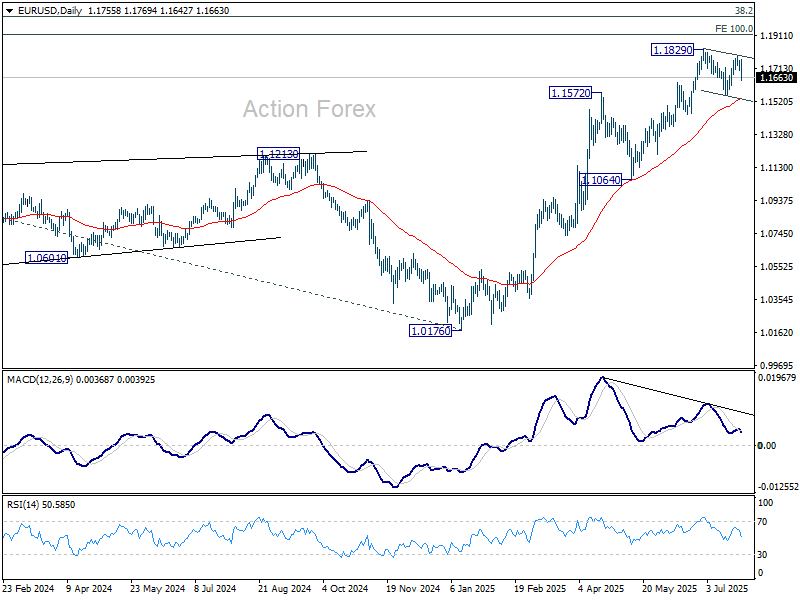
EUR/USD came under strong selling pressure yesterday. However, the move is seen as part of the corrective pattern from 1.1829 short term top. Larger up trend is still expected to resume later. This view will hold as long as 55 D EMA (now at 1.1538) holds.

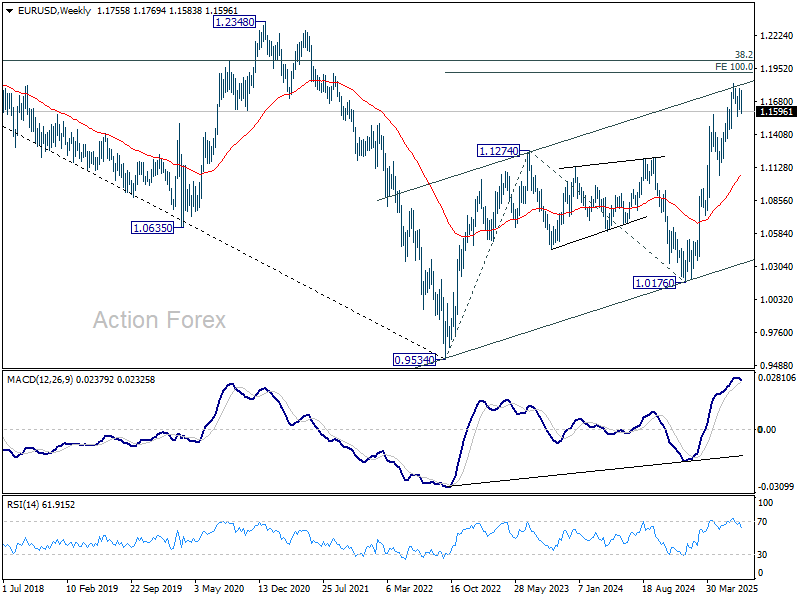
That said, technical headwinds are clearly building. The pair already touching the long term rising channel resistance, and nearing a long-term Fibonacci projection level at 1.1916, 100% projection of 0.9534 to 1.1274 from 1.0176 at 1.1916. Bearish divergence on D MACD suggests fading momentum, recent up trend is clearly running out of steam. Sustained break of 55 D EMA will argue that it's already in a larger scale correction after rejection by 1.1916.
Gold Shows Signs of Fatigue Inside Established Range
Gold has been in a $250 range since hitting new all-time highs after Liberation Day in April 2025.
Despite many signs of new trends very close to beginning, the only true thing is that Gold has not been able to find a trend.
The question that may arise, particularly after last week's rebound on the 2025 upward trendline, which failed to even touch the All-time high record, is: Do Gold bulls have enough fundamental resources to push the metal to new highs?
The weekly session has started with some great volatility, particularly as the US Dollar is breaking higher in a strong manner and with the EU-US Trade Deal being close to concluded.
This volatility has been negative for Gold which had been going up on more tense global trade outlooks. As a matter of fact, global trade is felt to be looking better as more Deals are reached.
Before taking a look at the technicals, let's see if positioning helps us to get a good idea of what is going on.
Client positioning in Gold

Client Positioning for Gold, July 28, 2025 – Source: OANDA Labs
Client positioning in Gold is overweight long. Positioning tends to typically be an inversely correlated tool to imminent Market moves – If players are long, an inability to add to positions emphasis further reversals, in this case it gives a bearish tilt.
Now turning to Technicals for the precious metal
Gold Daily Chart
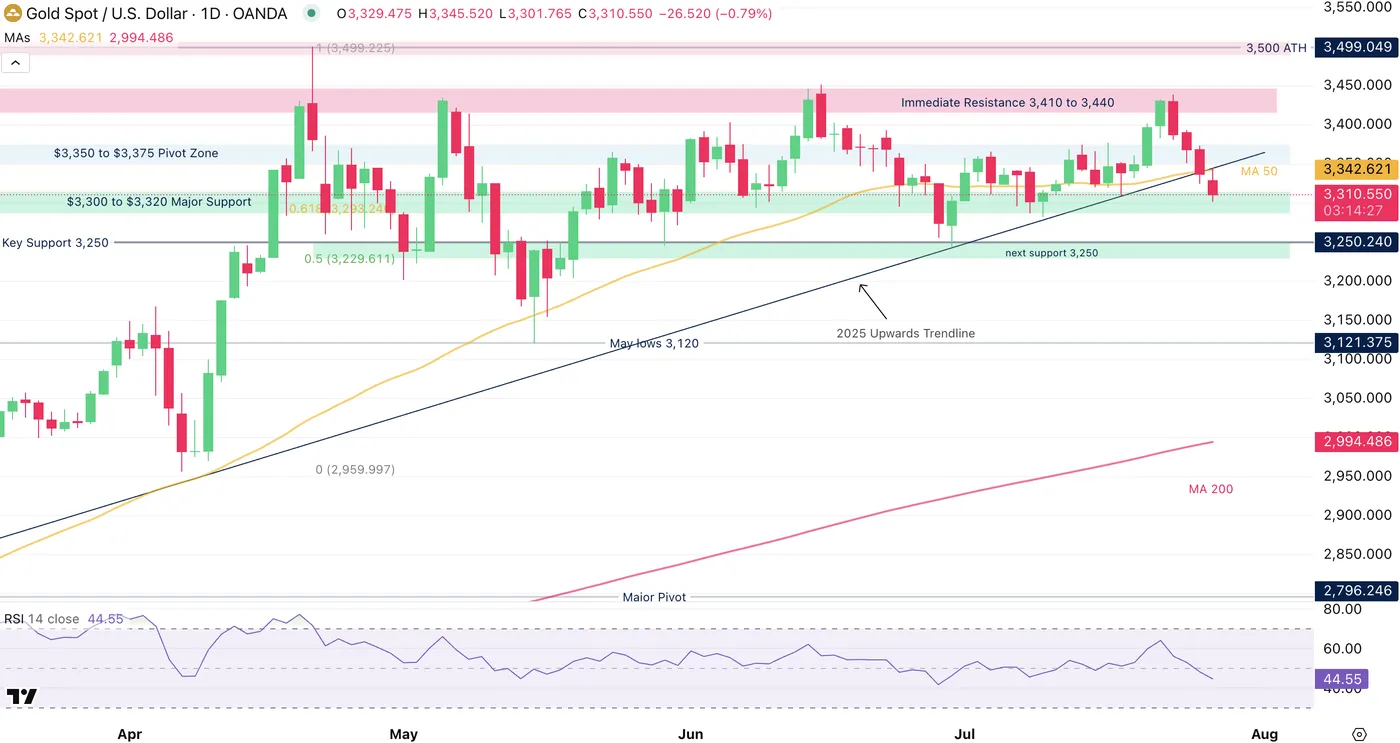
Gold Daily Chart, July 28, 2025 – Source: TradingView
Gold was on a strong move towards that previously pointed to potentially hitting the all-time highs – A spike at the $3,439 highs got met with an Engulfing bearish candle after the reaching of the US-Japan Trade deal.
Since, an over-$100 correction has brought the precious metal below the 2025 upwards trendline, particularly after opening down on the weekly open, just below its key 50-Day Moving average ($3,342).
Buyers having failed to hold the rally above it gives more emphasis to the ongoing selling – However the action is still rangebound with the prices entering the $3,300 to $3,320 Support Zone.
Any close below would look at the end-June $3,250 level that served as key support, with no other major support until $3,120 May lows
Gold 4H Chart
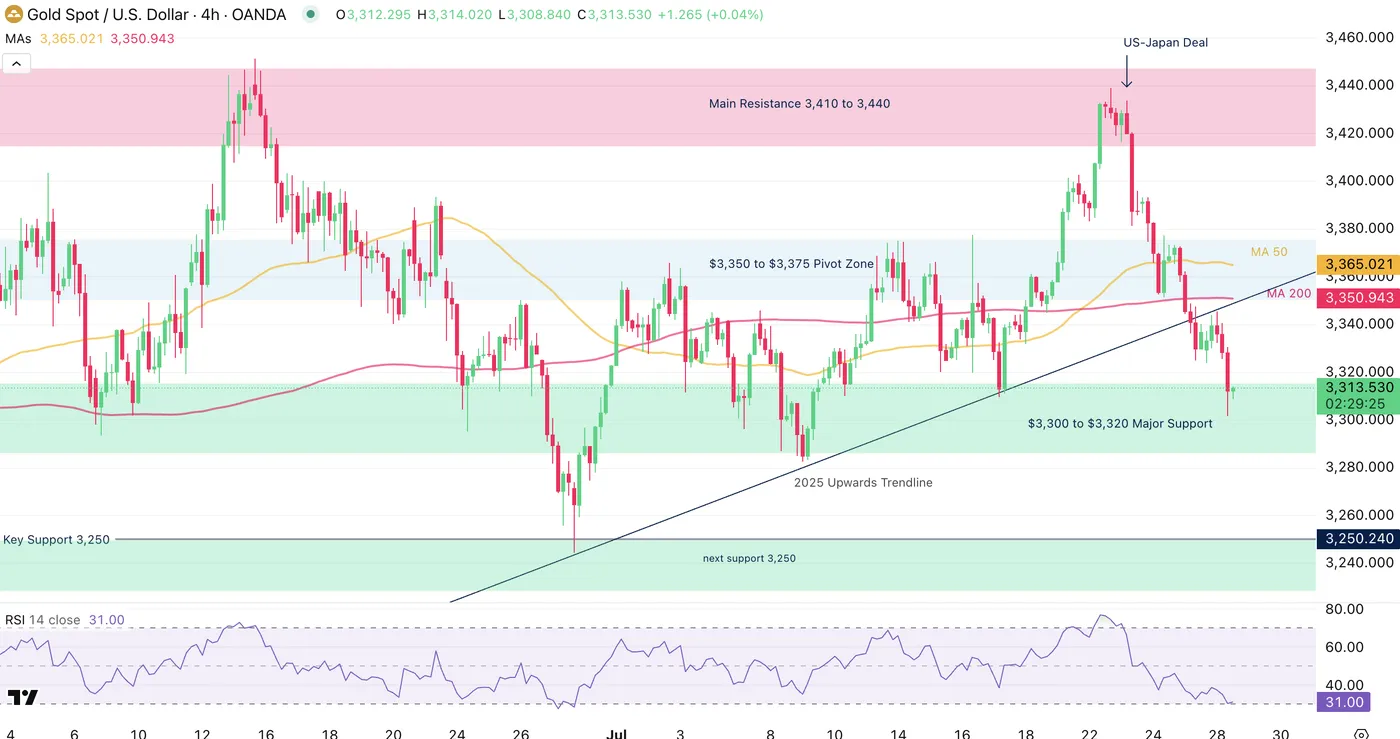
Gold 4H Chart, July 28, 2025 – Source: TradingView
The weekly open has quickly built towards the Key support mentioned on the Daily timeframe, which leaves a last hurdle for the bulls to support the range before a potential $50 breakdown.
$3,300 is not a pivot point to underestimate, and retracements in Gold tend to be short – Therefore even if the level breaks, it will be essential to see where other buyers step in ($3,250 is the next key support).
There has been a long-tailed wick at the morning session selling candle leading to a small rebound – Any rebound from here will have to be strong enough to bring prices above the $3,350 Pivot Zone in confluence with the 4H MA 200.
Any selloff from there would open the door for a more concrete downwards reversal in a break-retest fashion which would infer a need for further analysis.
Reactions from here are a major key for the action to come.
Gold 30m Chart
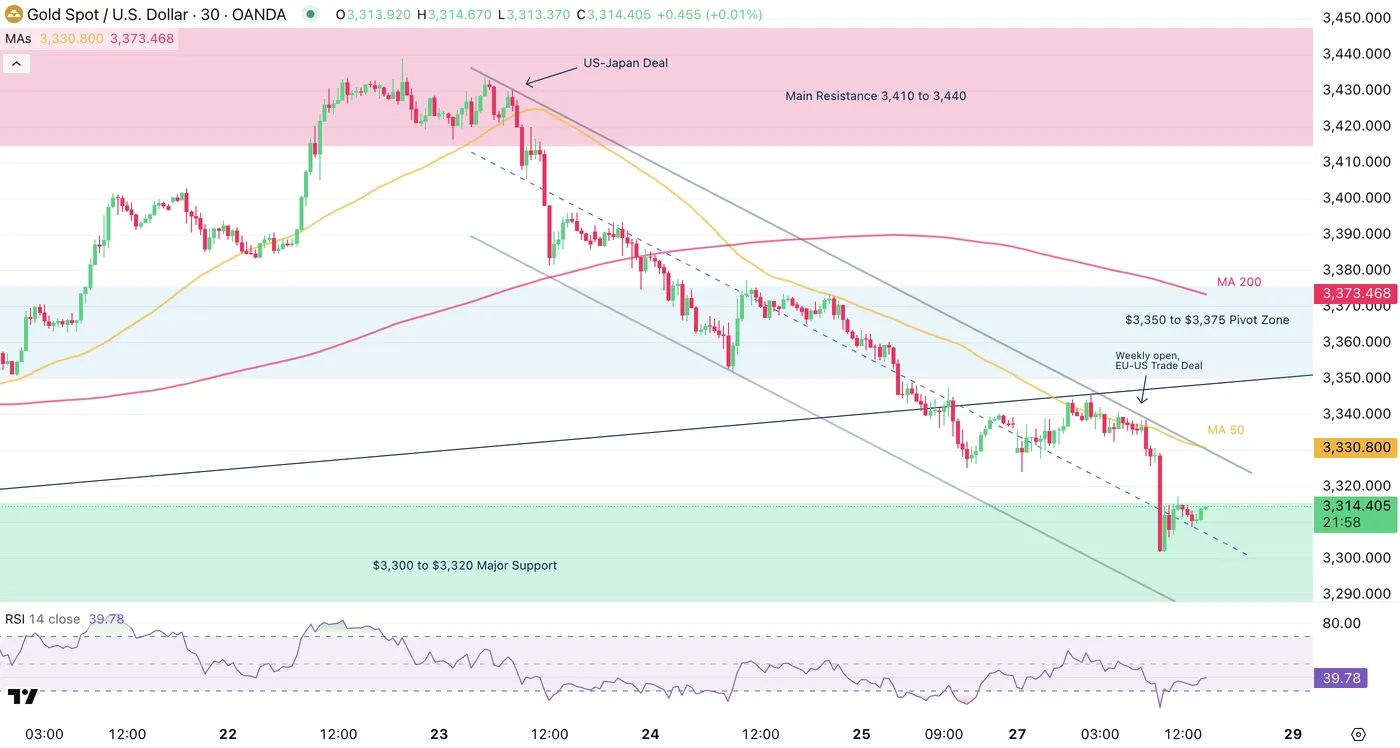
Gold 30M Chart, July 28, 2025 – Source: TradingView
Looking even closer, the battle is nnot won yet for the Bears.
The formation of a intermediate-downwards channel shows a potential test of its higher bound which coincides with the 30m 50-period MA ($3,330); a first hurdle to break for the range to hold and to give a chance to regain higher levels.
That MA is actually a key to intraday momentum, having served as resistance for sellers to step in so keep that one closely in check.
Safe Trades!
AUDUSD Weakens as Markets Brace for a Pivotal Week
A fundamental overview of the AUD to prepare for a key week
This week is promised to be a major mover for the Forex market, and the AUD is far from being excluded from potential movement.
Between Central Bank meetings, including Wednesday’s FOMC and Australia’s Quarterly Inflation data, AUD Traders must stay prepared for the upcoming action.
The Royal Bank of Australia held its Main Rate at 3.85% at the beginning of July, citing higher inflation and more than decent employment figures. However, the week after, the figures were not as good.
The initial reaction was stronger for the AUD, but the motion is starting to show some change right after the pair hit some 8-month highs.
Some headwinds are in the longer-term outlook for the Currency pair. Australian funds are increasingly hedging their foreign investments (particularly with the US), which would typically increase fundamental demand for the currency.
This is already taking place, as evidenced by the consistent and stable uptrend formed after the Liberation Day troughs. But markets are forward-looking, and traders need to adapt fast.
The upcoming Wednesday FOMC meeting will be a major key to the pair's dynamics, with a focus on the FED's communication.
The RBA still has about 60 bps of cuts priced in for the rest of the year (with a cut largely priced in for the next meeting), and this pricing is subject to much change, particularly with the inflation data coming up. FYI, the upcoming RBA meeting will be taking place on August 12.
AUDUSD Technical Analysis
AUDUSD Daily Chart
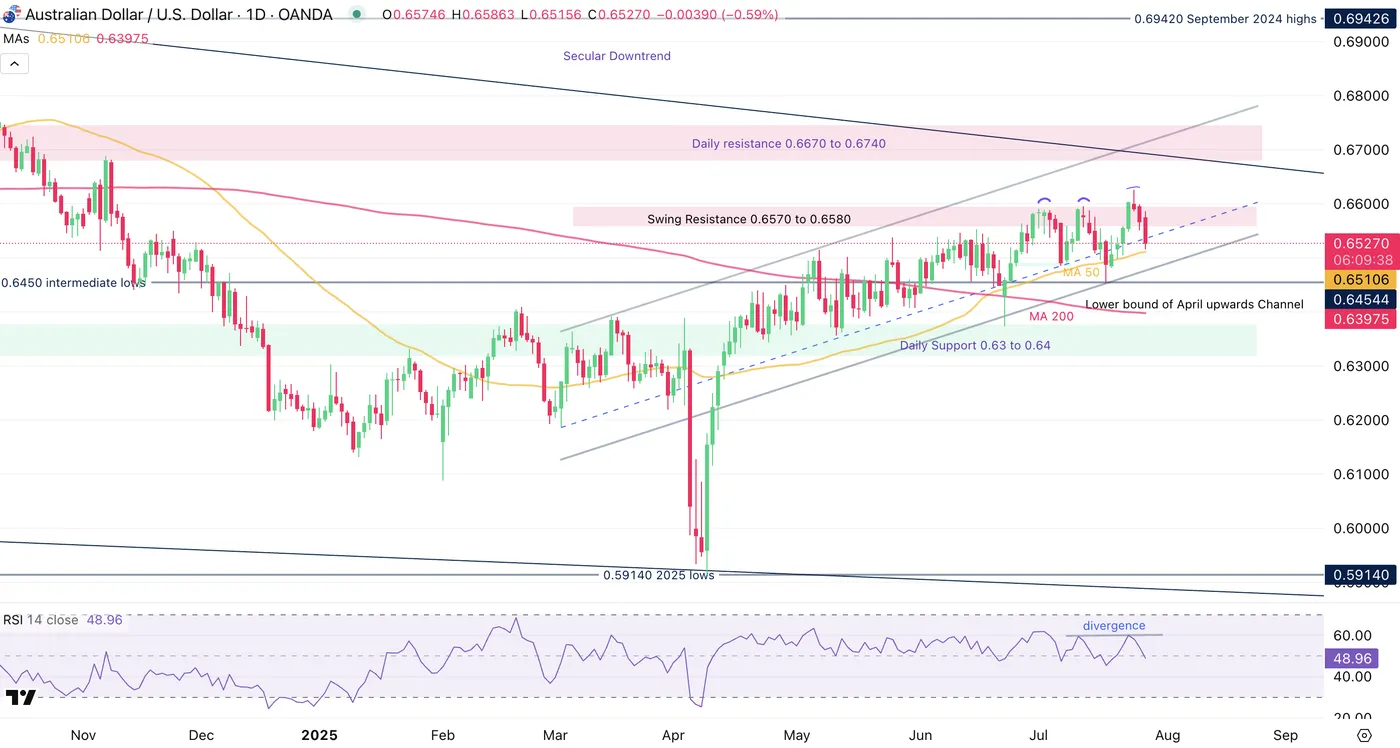
AUDUSD Daily Chart, July 28, 2025 – Source: TradingView
The Aussie had invalidated a double top formation as the US Dollar saw some newfound weakness in the first trading days of the past week, taking the pair to some 8-month highs (0.66250) – failed continuation downwards brought some strong buying in the pair (failed patterns tend to be good signs of strong reversals).
However, the action has reversed again as the Greenback saw a reversal higher after Wednesday trading and this has marked another, more concrete top in AUDUSD with the forming of a bearish divergence.
Daily momentum is neutral but now tilting downwards. With the 50-Day MA acting as immediate support (0.6510), sellers will want to get a stronger push to regain longer-term control of the action.
AUDUSD 4H Chart
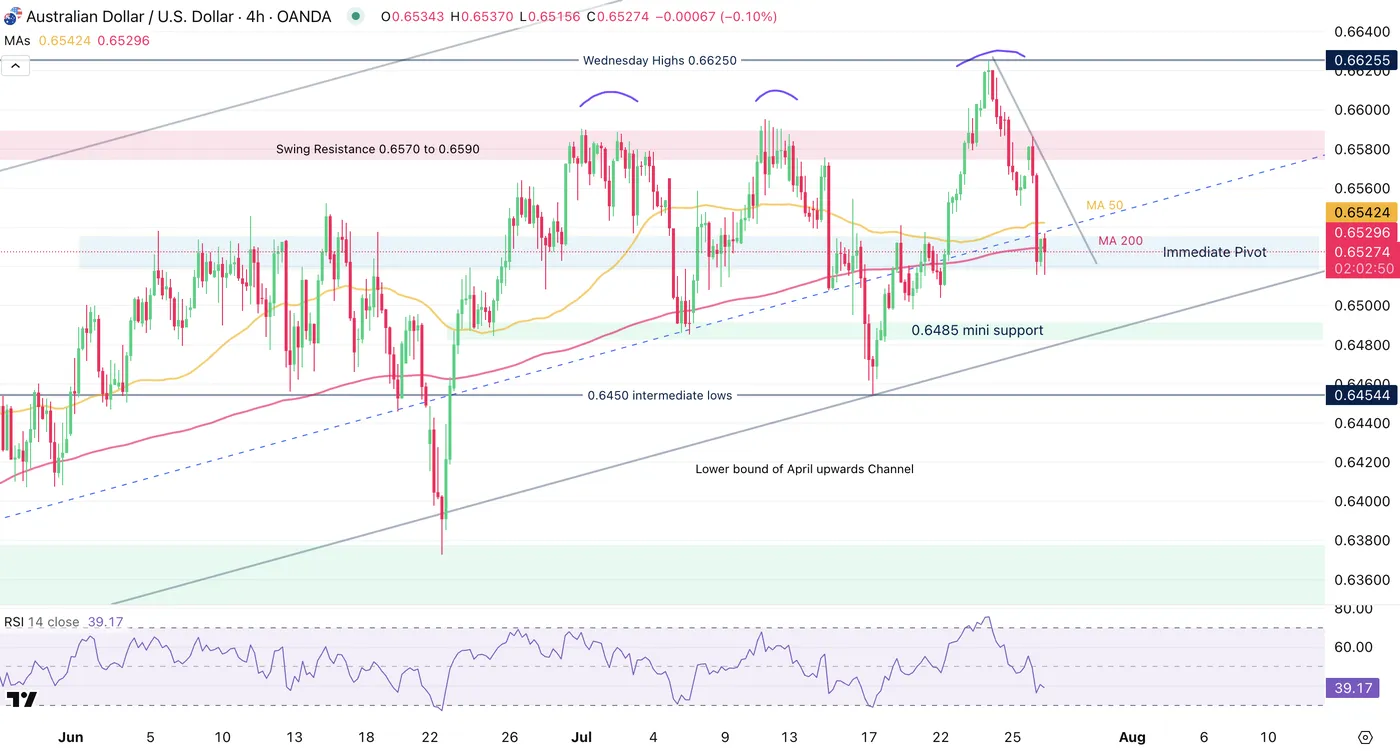
AUDUSD 4H Chart, July 28, 2025 – Source: TradingView
Markets have retracted sharply from the last highs and actually passing below the tighter channel lower bound (dotted blue line).
This itself will be attracting some trend-reversal traders but the action has to break conclusively below the Immediate Pivot Zone (level detailed below) before the downwards reversal shows an even higher probability of continuation.
Nevertheless, a failure to continue the selling momentum will point to rangebound action due to the 3 tops and 2 bottoms formed through the past two weeks of trading.
Levels to place on your charts:
Support Levels:
- Immediate Pivot Zone (0.65150 to 0.65350) - above + bullish, below + bearish
- 0.6485 mini support
- 0.6450 intermediate lows
- 0.63 to 0.64 Main Daily Support
Resistance Levels:
- Swing Resistance 0.6570 to 0.6590
- Wednesday Highs 0.66250
- Daily resistance 0.6670 to 0.6740 and high of upwards Channel
AUDUSD 1H Chart
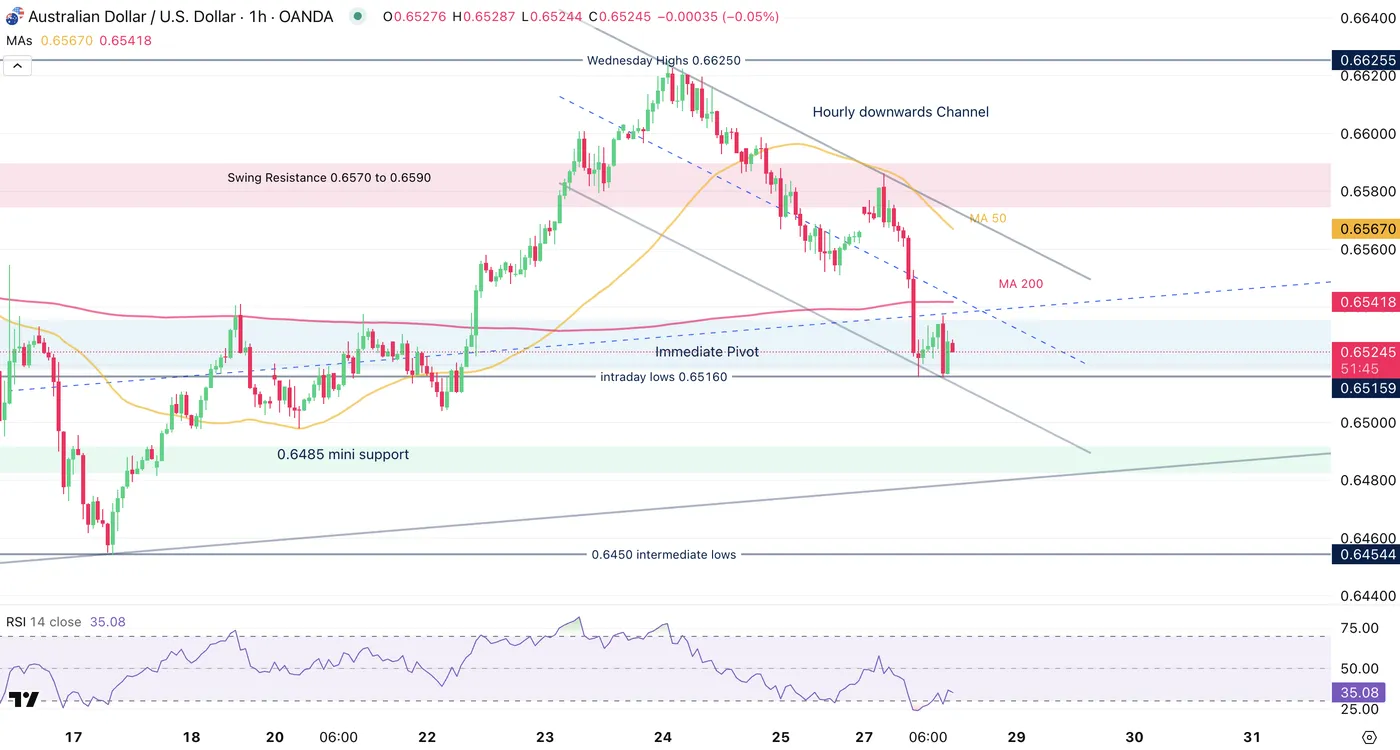
AUDUSD 1H Chart, July 28, 2025 – Source: TradingView
The week has started with some steep correction in the pair as markets are selling the Trade Deal news, with the Greenback seeing some newfound demand.
The selling has found a lower bound after marking oversold levels (0.65160 current session lows), forming the Immediate Pivot. The action still is more bearish than neutral with the ongoing lower consolidation.
The current lows allow for the formation of a downwards hourly channel where reactions to the lower bound will be key to watch for momentum decision – keep this one closely on your charts.
Get ready for the upcoming Australian Inflation data on Tuesday 21:30 (QoQ Inflation consensus at 0.8%, any beat will continue to diminish rate cut expectations, upward demand for the AUD and vice versa)
Safe Trades and successful week!
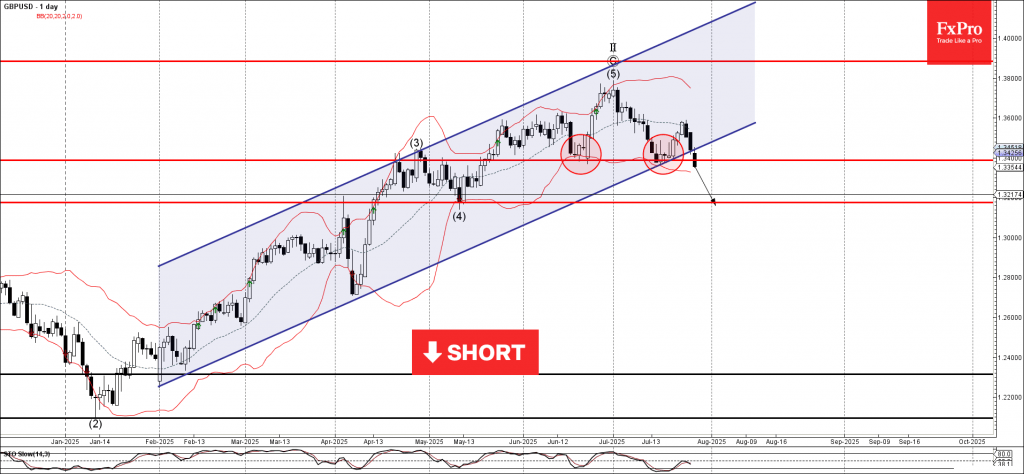
GBPUSD Wave Analysis
GBPUSD: ⬇️ Sell
- GBPUSD broke support zone
- Likely fall to support level 1.3175
GBPUSD currency pair recently broke the support zone between the support level 1.3385 (which has been reversing the price from June) and the support trendline of the daily up channel from January.
The breakout of this support zone should accelerate the active intermediate impulse wave (1) from the start of July.
GBPUSD currency pair can be expected to fall to the next support level 1.3175 (former multi-month low from May, low of the earlier correction (4)).
EURUSD Wave Analysis
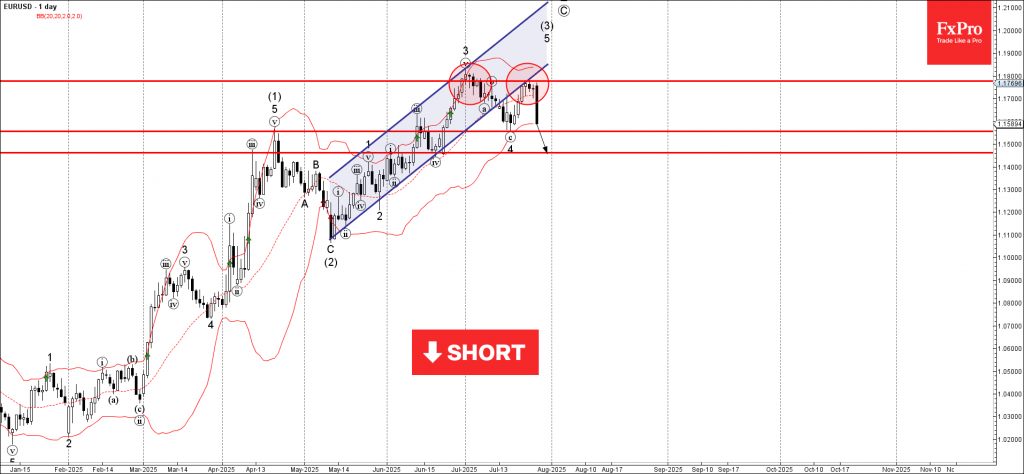
EURUSD: ⬇️ Sell
- EURUSD reversed from the resistance level 1.1775
- Likely to fall to support levels 1.1555 and 1.1460
EURUSD recently reversed down from the resistance zone between the resistance level 1.1775 (which stopped the previous impulse wave 3 at the start of July, as can be seen below) and the upper daily Bollinger Band.
This resistance zone was further strengthened by the lower trendline of the recently broken up channel from May (acting as resistance after it was broken earlier).
Given the strongly bullish US dollar sentiment, EURUSD can be expected to fall to the next support levels 1.1555 and 1.1460 – the low of waves 4 and iv.
Oil Prices Jump as Trump Trade Deals Boost Global Sentiment
It was largely expected to arrive, and Market participants finally got it: The EU-US Trade Deal has finally (almost) been reached.
For now, markets have only an outline of the actual Deal that needs to be finalized, but to the Market’s understanding, the Deal is done.
The US Dollar is looking a bit stronger after the news, particularly against the Euro after forming what resembles a double-top – let’s see how the Markets play this one.
Equities, on the other hand, are showing a mixed reaction, with the DAX selling off after the news, for example.
The subject of today's piece is US Oil, which, although still trading in its range, is seeing some sharp buying.
Let’s take a look at the technicals that precede a potential breakout.
US Oil Intraday charts
The rangebound action warrants a closer look to Oil prices, reason why we will omit from taking a look at the Daily charts in today's analysis
US Oil 4H Chart
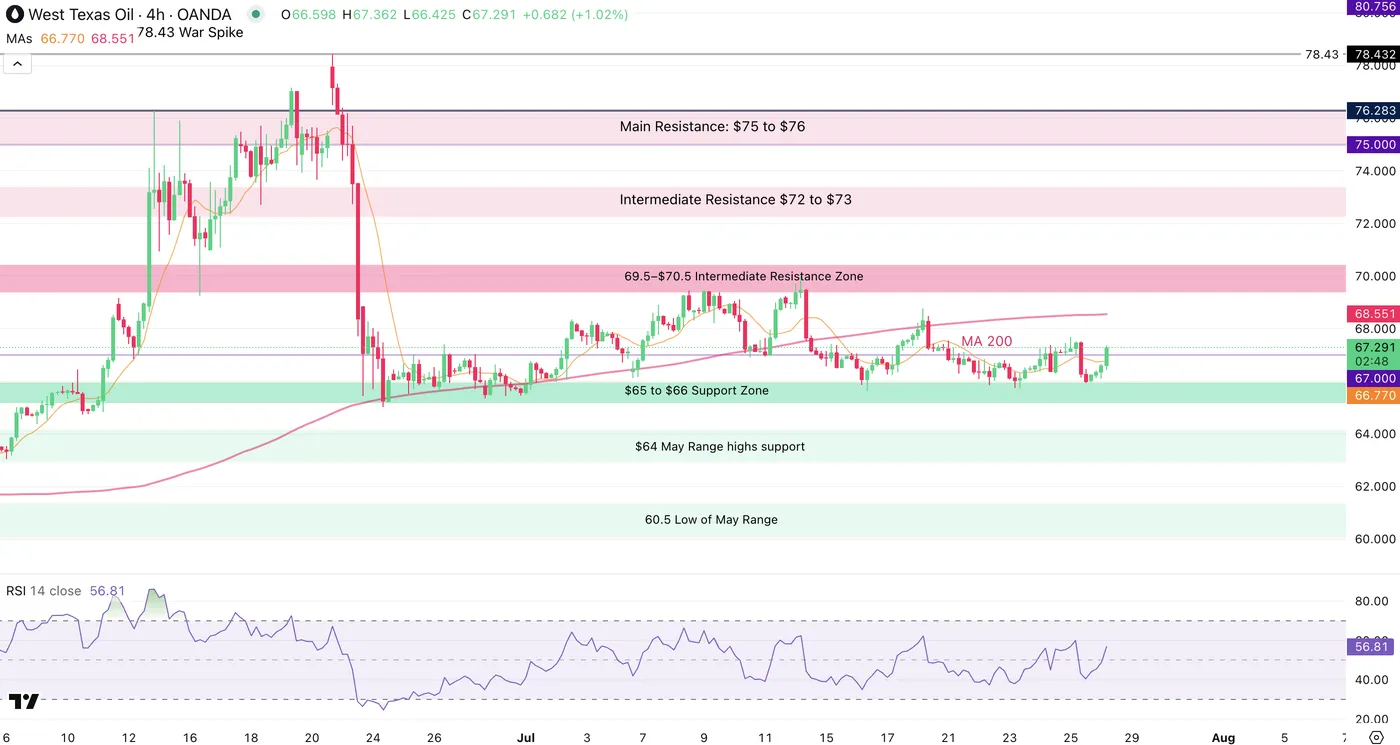
US Oil 4H Chart, July 28, 2025 – Source: TradingView
The action has decidedly been rangebound in the Black Gold despite failing twice to break above around $70 and consequently seeing a tightening of the range to $65.5 - $67.
We mentioned in our preceding Oil analysis how a range, despite showing signs of the balance tilting to the buyers or the sellers' side, can be expected to hold as long as it holds.
It is the same as trends which traders usually anticipate to reverse way earlier than they actually do – this is why it's important to be patient and wait for confirmation.
Let's see closer however to see if there is anything to tip the scales in this morning's action.
US Oil 1H Chart
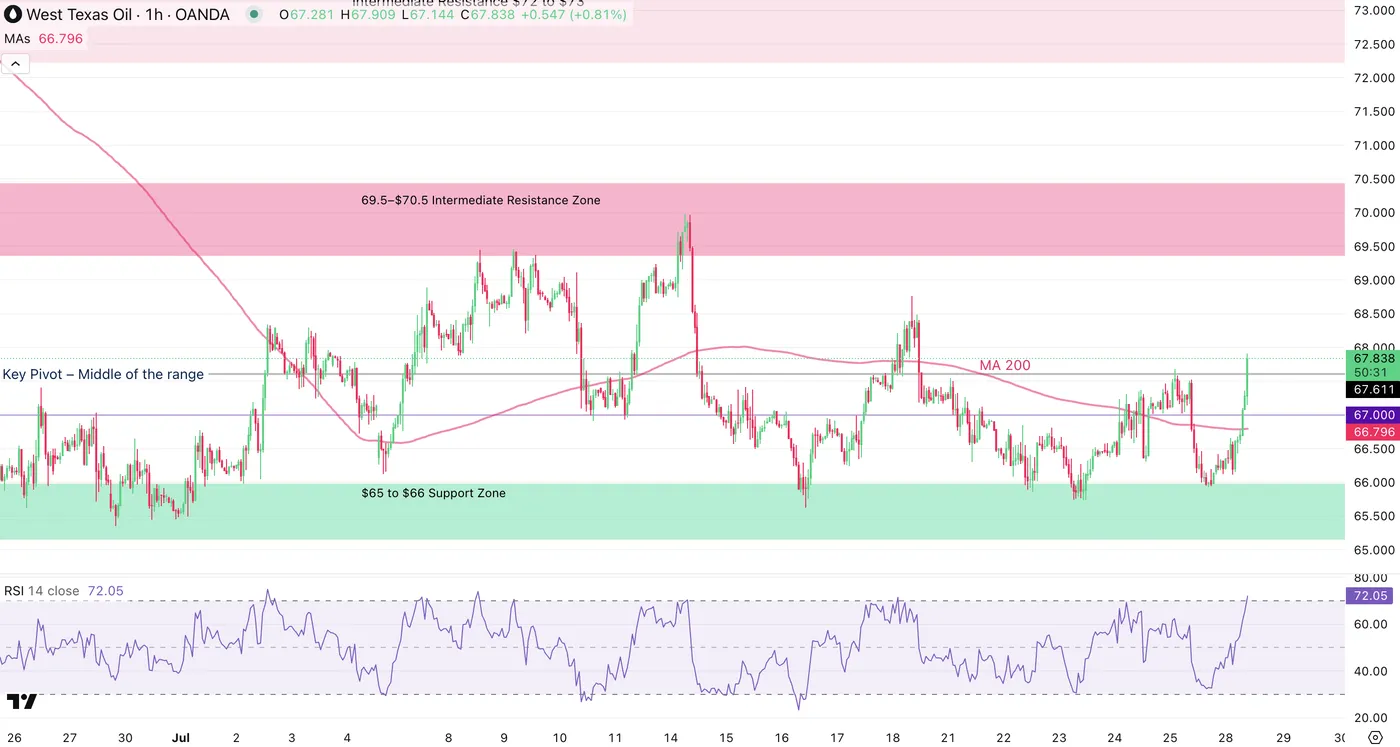
US Oil 1H Chart, July 28, 2025 – Source: TradingView
Buyers are stepping in quite aggressively with traders taking the commodity up close to 3% since the Sunday open.
The action is currently overbought but with the strength of the current buying, it would be more common to see consolidation around here rather than a full retest of the range lows.
Oil bulls are taking prices just above the Key Pivot level in the Middle of the range around $67.50 – In rangebound action, always keep an eye on such levels to spot if the breaching of such triggers reactions.
And reactions we are getting. Let's take an even closer look.
US Oil 15m Chart
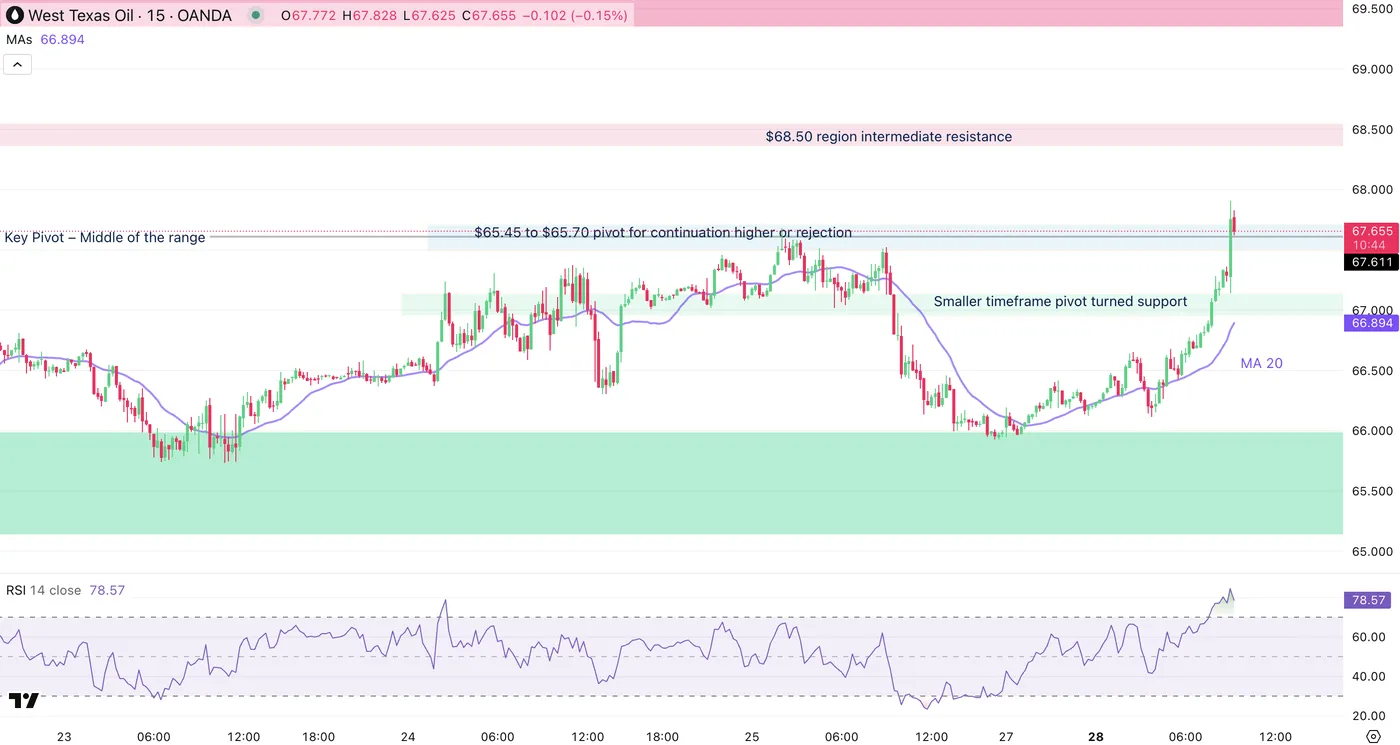
US Oil 15m Chart, July 28, 2025 – Source: TradingView
The move is currently stalling from way overbought levels, but the action is holding above the Pivot zone mentioned right above (65.45 to $65.70).
Buyers have stepped in quite strongly in this morning wave forming a tight bull channel
Holding above the pivot zone will indicate higher probabilities of testing the highs of the range, with an intermediate resistance from earlier July trading stepping in around $68.50.
Safe trades and successful trading week!
Sunset Market Commentary
Markets
Outside of stock markets, there’s little market euphoria to be spotted following the US-European trade deal over the weekend. And even the likes of the EuroStoxx50 are well below their intraday highs. Gains of as much as 1.3% were pared to around 0.4% currently. The euro slides against the USD. EUR/USD forfeits 0.9% to fill offers around 1.164 currently. From a technical and momentum point of view the pair is headed at minimum for a retest of the 1.1573 neckline of a double top formation. Is it buy the rumour (that lingered end last week), sell the fact or simply a good enough reason for some EUR-profit taking after the rebound last week? Or perhaps it is the realization that a 15% levy, which is not nothing, is bound to reduce European exports (and therefore also demand for the euro) and growth in a broader perspective? The differing views on the deal among European leaders obviously don’t help either with the French PM for example calling it an act of submission and a dark day for Europe. The weaker euro is also complemented by an across-the-board stronger USD (against G10 peers). This suggests there’s some relief on the dollar side of the equation, maybe related to the fact that Trump’s aggressive trade rhetoric so far does not translate into similar policies. Remember how his shocker tariff card on April 2 triggered a sell-off across all US assets, including the USD. Investors are probably also wary to add to dollar shorts going into an important economic update this week and a Fed policy meeting at which there’s little reason to leave the current wait-and-see attitude. The trade-weighted dollar index fights its way back north of the 98 barrier. Sterling is seizing the sluggish euro momentum to avoid a break below the EUR/GBP November 2023 high. After a brief test of that 0.8768 this morning, EUR/GBP quickly turned south to trade around 0.8682 currently, which coincides with the lower bound of a 2-month upward sloping trend channel.
Core bonds part ways with German bunds outperforming US Treasuries. German net daily yield changes vary between -4 and -0.7 bps in a bull steepening move. Euro area money markets again add to ECB easing bets after having reduced them in the wake of last week’s policy meeting. Treasury yields are slightly up on the day, lead by the long end of the curve. A double $69bn 2-yr and $70bn 5-yr auction tonight may trigger some intraday moves though these tenors usually lack major market moving potential. UK gilts underperform both vs Bund Treasuries. Yields rise 1-2.2 bps, bear flattening the curve.
News & Views
A survey by the Confederation of British Industry (CBI) showed a downturn in British retail sales ran into its 10th month in July. The index came in at -34 with the improvement from June’s -46 offering meagre comfort. CBI’s principal economist Sartorius said that "Firms reported that elevated price pressures – driven by rising labour costs – and economic uncertainty continue to weigh on household demand, which has contributed to sales volumes falling since October 2024." The rising labour costs in turn are attributed to the UK government’s decision to increase social security contributions in the October budget. Weak demand was visible across the distribution sector, with sales in wholesale and motor trades also declining.
Jürgen Schaaf, an adviser to the ECB, expressed worry in a blog on the central bank’s website over the US dollar’s early dominance of stablecoins following the landmark GENIUS act signed by president Trump last Friday in which a regulatory framework is created. Schaaf said such dominance would provide the US with strategic and economic advantages, allowing it to finance debt more cheaply while exerting global influence. Schaaf also said that if dollar-based stablecoins become widely used in the euro area, be it for payments, savings or settlement, the ECB’s control over monetary conditions would be weakened. Stablecoins are crypto assets that are pegged to a currency, most commonly the US dollar.
European Shares Hit 4-Month High on Trade Deal Announcement
European Shares Hit 4-Month High on Trade Deal Announcement, Audi Cuts Forecast, FTSE 100 Slides From Fresh ATH
Asia Market Wrap - Sentiment Mixed Following US/EU Deal
The record-breaking run in US markets is likely to continue after the EU reached a trade deal with Trump, easing fears of a major trade war.
S&P 500 futures rose 0.4% after the index hit five straight all-time highs last week. European stock futures also jumped 1% following the deal, which includes a 15% tariff on most EU exports. The MSCI All Country World Index hit a new record, though Asian markets stayed flat. Trump and European Commission President Von der Leyen announced the deal on Sunday at Trump’s golf club in Turnberry, Scotland, but didn’t share specific details or any written agreement.
The deal, which was hard to negotiate, will place 15% tariffs on most EU exports, including cars, but avoids a trade war that could have seriously hurt the global economy.
US/EU Trade Deal - Audi Cuts Forecast Following Tariffs
The US and the European Union reached a trade deal on Sunday, setting a 15% import tariff on most EU goods, half of what was originally threatened and avoiding a larger trade war. Together, the US and EU make up nearly a third of global trade.
US President Donald Trump and European Commission President Ursula von der Leyen announced the agreement after a one-hour meeting at Trump’s golf course in Scotland. The deal came after months of tough negotiations. German Chancellor Friedrich Merz praised the agreement, saying it prevented a trade conflict that could have badly hurt Germany’s economy, especially its car industry. German carmakers like VW, Mercedes, and BMW have already been affected by the current 27.5% US tariff on car and parts imports.
While the 15% tariff is lower than the original threat, many in Europe still see it as too high, as they had hoped for a deal with no tariffs at all. Bernd Lange, head of the European Parliament’s trade committee, criticized the tariffs as unfair and warned that Europe’s planned investments in the US could harm the EU’s own economy.
A senior US official said Trump could raise the tariffs in the future if European countries fail to meet their investment promises.
German carmaker Audi, part of Volkswagen, lowered its financial forecast for the year on Monday. The company blamed higher US import tariffs and ongoing restructuring costs for the change.
Audi now expects its revenue to be between 65 billion and 70 billion euros ($76 billion to $82 billion), which is lower than its earlier prediction of 67.5 billion to 72.5 billion euros. It also reduced its expected operating profit margin to 5% to 7%, down from the previous range of 7% to 9%.
Audi is still reviewing the effects of the recent trade deal between the US and the EU.
European Open - European Shares Hit Four-Month Highs
European shares hit a four-month high on Monday, driven by gains in pharma and semiconductor stocks. The STOXX 600 index rose 0.7%, with Germany's DAX up 0.6%, France's CAC 40 gaining 0.8%, and the UK's FTSE 100 edging up 0.1%.
The recent US-EU trade deal, which includes a 15% tariff on most EU goods and a $600 billion EU investment in the U.S., boosted market optimism. The STOXX 600 is now just 1.8% below its all-time high from March, rebounding 19.5% since April.
Pharma stocks like Novo Nordisk (+0.4%) and Roche (+1.4%) hit monthly highs, while auto stocks, benefiting from reduced tariffs, reached two-month highs. Semiconductor companies ASML (+4.2%), Besi (+5.5%), and ASM International (+3.8%) were top performers.
However, spirits stocks Pernod Ricard (-1.4%) and Anheuser-Busch (-1.3%) fell as the trade deal left tariffs on spirits unresolved. Heineken dropped 4.3%, citing long-term tariff challenges. LVMH rose slightly amid reports of selling its Marc Jacobs brand.
On the FX front, The euro rose slightly to $1.1753, up 0.1% after an earlier 0.3% increase. It also gained 0.2% to 173.64 yen, marking its fifth straight session of growth and reaching a one-year high.
The dollar stayed steady at 147.65 yen, while the dollar index, which measures the US currency against others, remained flat at 97.582.
The British pound held steady at $1.3443. The Australian dollar was at $0.6568, and New Zealand's kiwi dollar stayed at $0.6014, with little movement.
Currency Power Balance
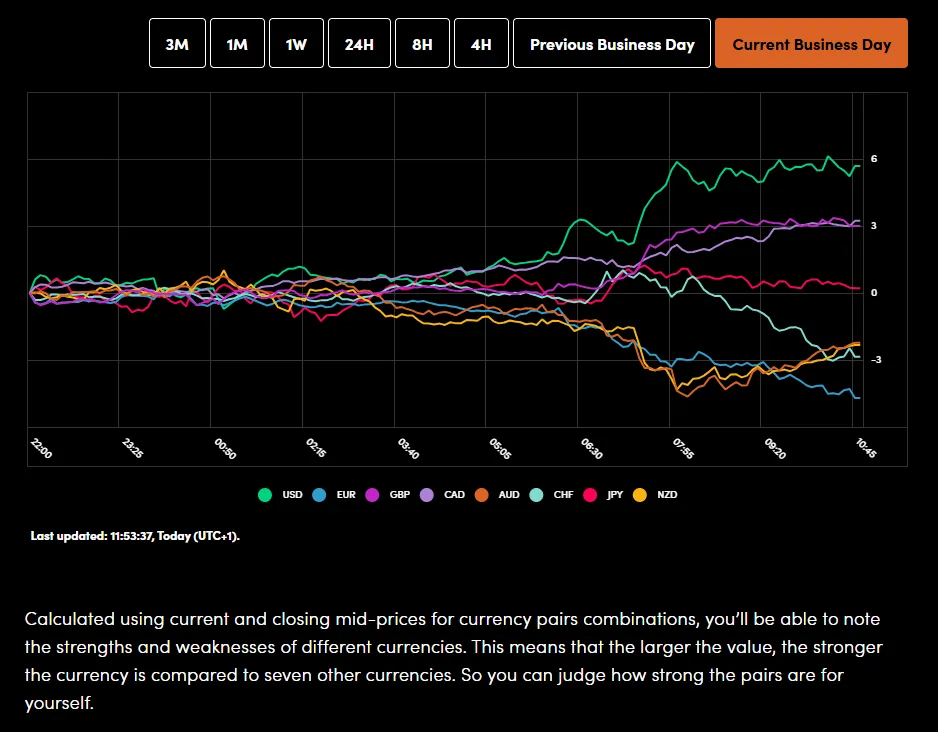
Source: OANDA Labs
Gold prices remain choppy as mixed price action dominated the Asian session and this has continued into the European open. Gold was trading at $3340/oz at the time of writing.
Oil prices rose slightly on Monday as investors reacted to the U.S.-EU trade deal. However, a stronger US dollar and reduced oil imports by India limited the gains.
Brent crude increased by 30 cents (0.4%) to $68.74 per barrel, while U.S. West Texas Intermediate crude went up by 27 cents (0.4%) to $65.43 per barrel.
Economic Data Releases and Final Thoughts
Looking at the economic calendar, a busy week lies ahead. Monday and Tuesday are abit bare when it comes to high impact data releases but Wednesday onward the calendar is extremely busy.
We have Central Bank meetings, US and UK earnings as well as a few other data releases and potential trade deal announcements.
Both the Fed and the Bank of Japan are expected to hold rates steady at policy meetings this week, but traders will watch subsequent comments to gauge the timing of the next moves.
Earnings season in the US will see 4 of the magnificent 7 stocks reporting.Apple is due on Thursday with Meta due out on Wednesday.
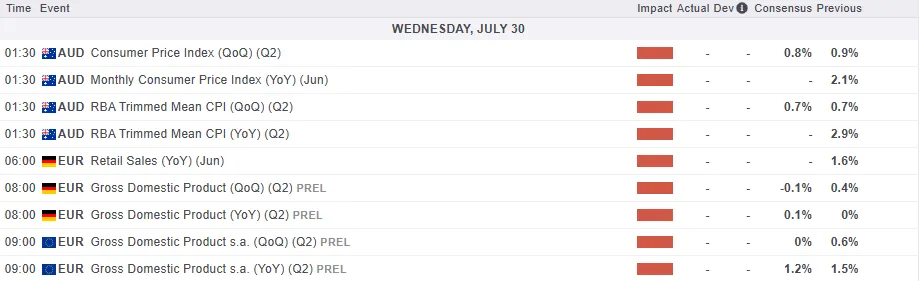
For all market-moving economic releases and events, see the MarketPulse Economic Calendar. (click to enlarge)
Chart of the Day - FTSE 100 Index
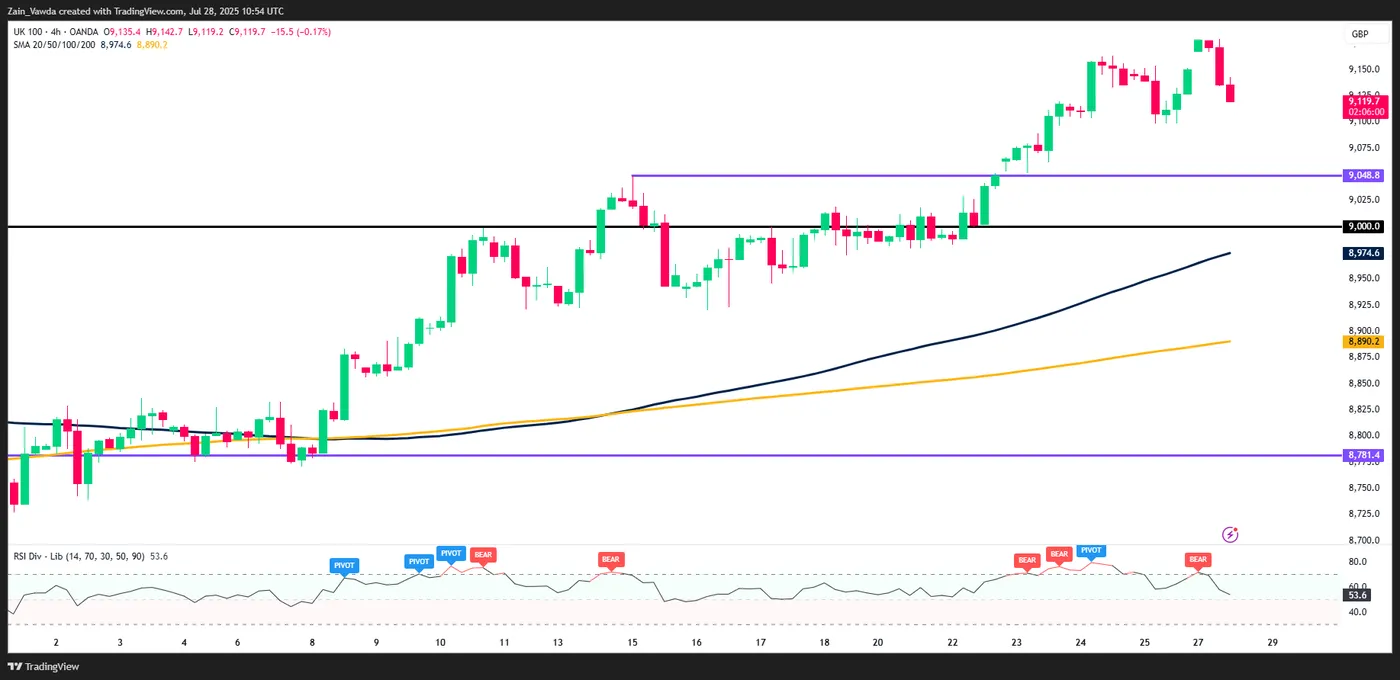
From a technical standpoint, the FTSE 100 index gapped higher following the US -EU trade deal over the weekend.
However, since the European open the index has retreated to trade lower than the Friday daily close price at 9151.
The upside does not have any historical data to focus on and thus I will look toward psychological numbers like 9250 and potentially 9500.
Immediate support rests at 9100 before the 9048 and 9000 handles come into focus.
FTSE 100 Daily Chart, July 28. 2025
Source: TradingView.com (click to enlarge)
EUR/USD Mid-Day Outlook
Daily Pivots: (S1) 1.1710; (P) 1.1735; (R1) 1.1768; More...
EUR/USD's break of 1.1677 minor support suggests that corrective pattern from 1.1829 is extending with the third leg. Intraday bias is back on the downside for 1.1555 support and possibly below. But downside should be contained by 55 D EMA (now at 1.1538) to bring rebound. On the upside, above 1.1788 will bring retest of 1.1829 high first.
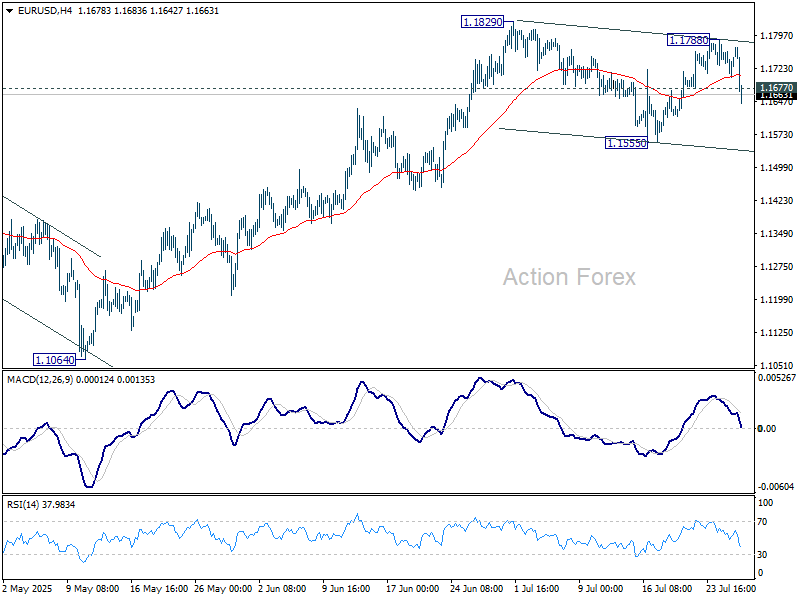
In the bigger picture, rise from 0.9534 long term bottom could be correcting the multi-decade downtrend or the start of a long term up trend. In either case, further rise should be seen to 100% projection of 0.9534 to 1.1274 from 1.0176 at 1.1916. This will remain the favored case as long as 1.1604 support holds.