

Sample Category Title
USD/JPY Mid-Day Outlook
Daily Pivots: (S1) 147.03; (P) 147.48; (R1) 148.13; More...
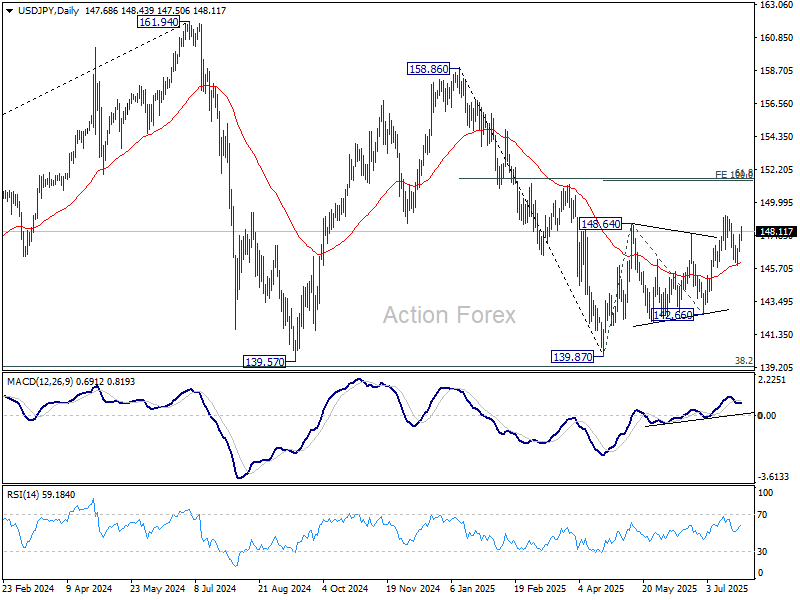
Intraday bias in USD/JPY remains on the upside for retesting 147.94 first. Firm break there will resume whole rise from 139.87. Next target is 100% projection of 139.87 to 148.64 from 142.66 at 151.43, which is close to 151.22 fibonacci level. On the downside, below 147.50 minor support will turn intraday bias neutral first. But risk will stay on the upside as long as 145.84 support holds, in case of retreat.
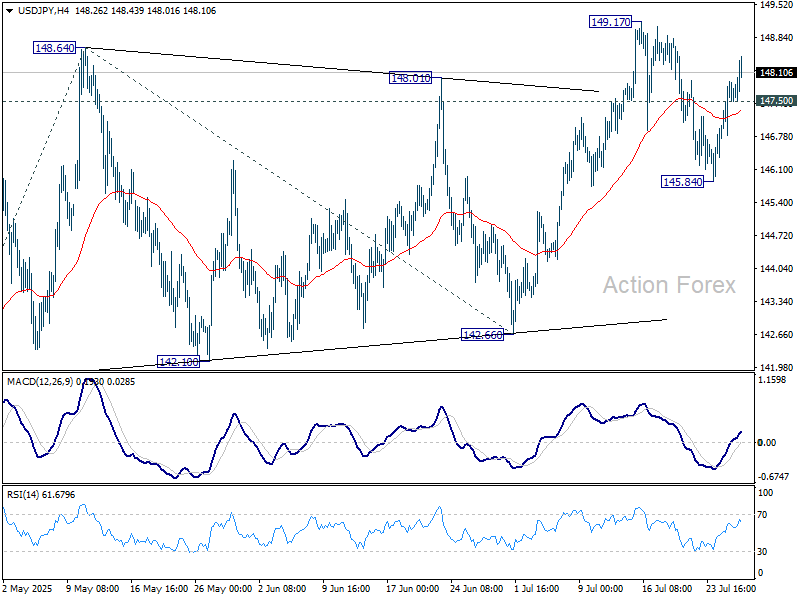
In the bigger picture, price actions from 161.94 (2024 high) are seen as a corrective pattern to rise from 102.58 (2021 low). Decisive break of 61.8% retracement of 158.86 to 139.87 at 151.22 will argue that it has already completed with three waves at 139.87. Larger up trend might then be ready to resume through 161.94 high. In case the corrective pattern extends with another fall, strong support is expected from 38.2% retracement of 102.58 to 161.94 at 139.26 to bring rebound.
GBP/USD Mid-Day Outlook
Daily Pivots: (S1) 1.3395; (P) 1.3458; (R1) 1.3500; More...
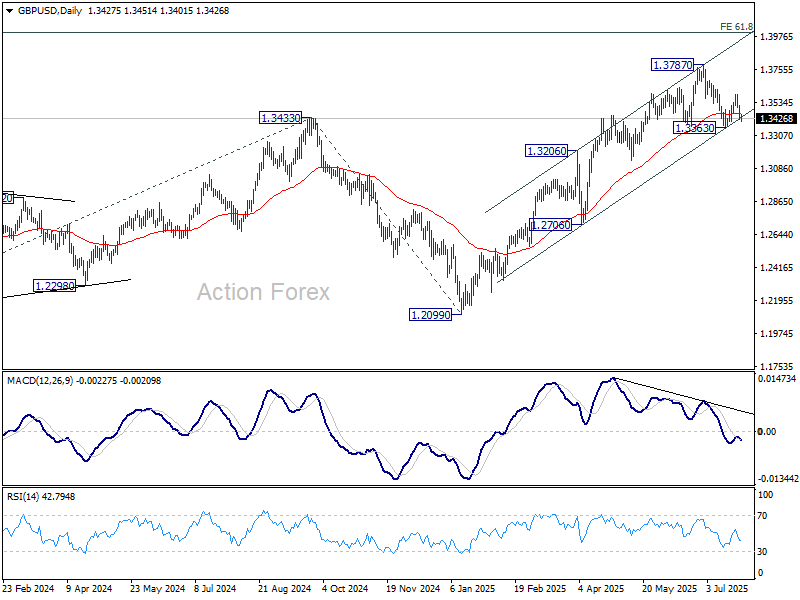
GBP/USD is holding above 1.3363 support and intraday bias stays neutral. On the upside, break of 1.3587 will target a retest on 1.3787 high. However, sustained break of 1.3363 support will argue that it's already correcting the whole rally from 1.2099, and target 1.3206 resistance turned support.
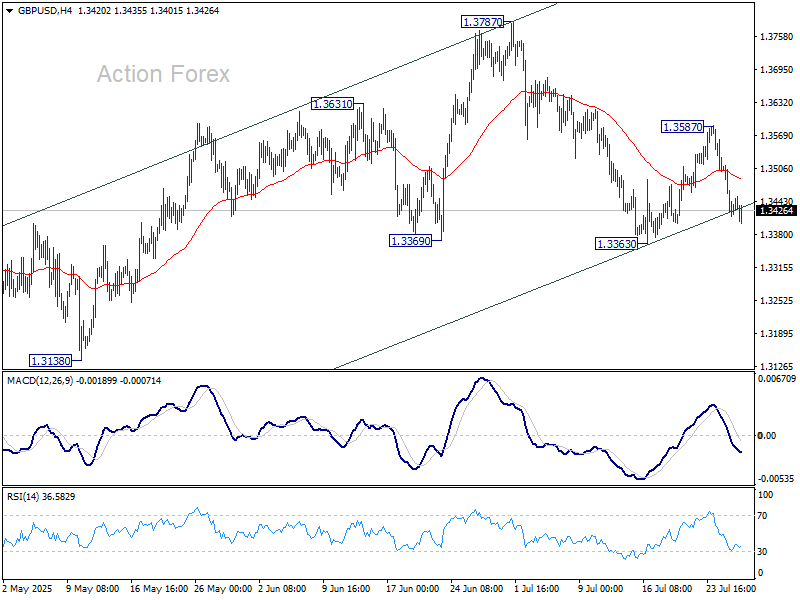
In the bigger picture, up trend from 1.3051 (2022 low) is in progress. Next medium term target is 61.8% projection of 1.0351 to 1.3433 from 1.2099 at 1.4004. Outlook will now stay bullish as long as 55 W EMA (now at 1.3045) holds, even in case of deep pullback.
USD/CHF Mid-Day Outlook
Daily Pivots: (S1) 0.7937; (P) 0.7959; (R1) 0.7972; More….
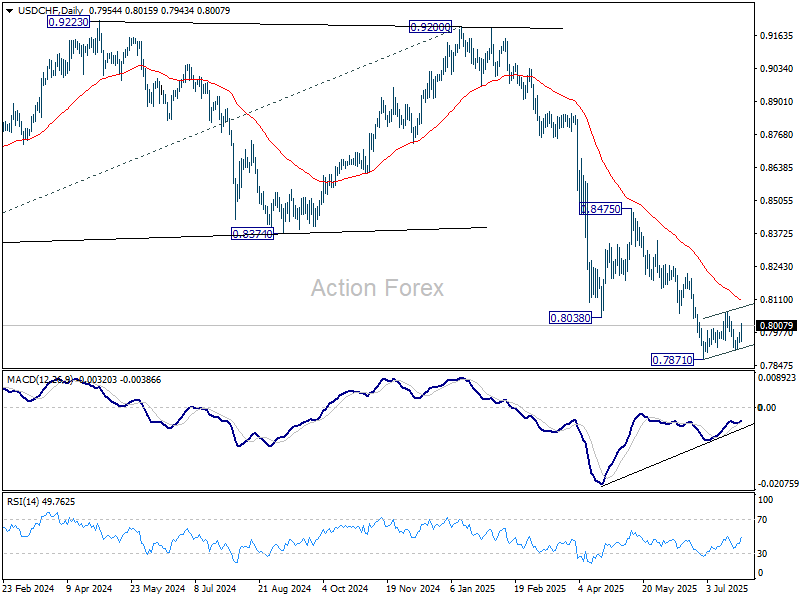
USD/CHF's extended rebound and break of 0.7990 minor resistance suggests that corrective pattern from 0.7871 is extending with the third leg. Intraday bias is back on the upside for 0.8063 resistance and possibly above. But upside should be limited by 55 D EMA (now at 0.8108). On the downside, below 0.7910 support will bring retest of 0.7871 low.
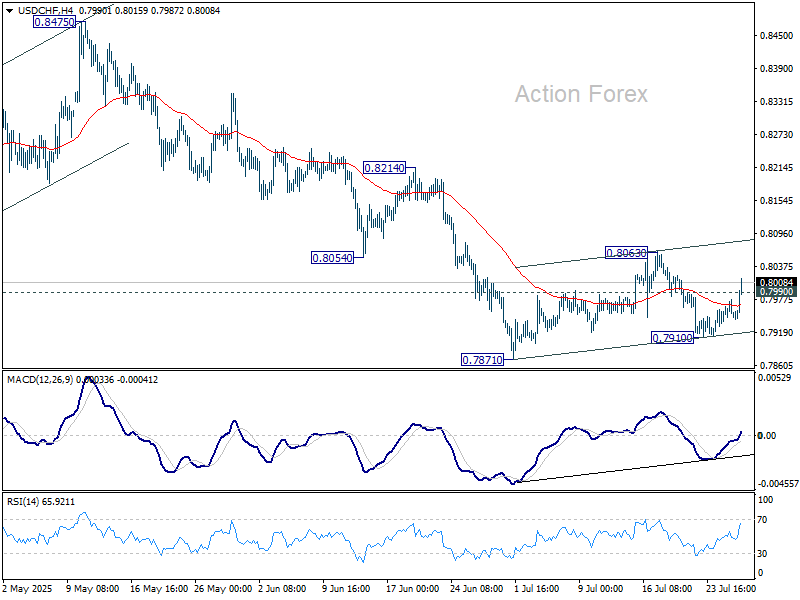
In the bigger picture, long term down trend from 1.0342 (2017 high) is still in progress. Next target is 100% projection of 1.0146 (2022 high) to 0.8332 from 0.9200 at 0.7382. In any case, outlook will stay bearish as long as 0.8475 resistance holds.
AUD/USD Mid-Day Report
Daily Pivots: (S1) 0.6544; (P) 0.6573; (R1) 0.6594; More...
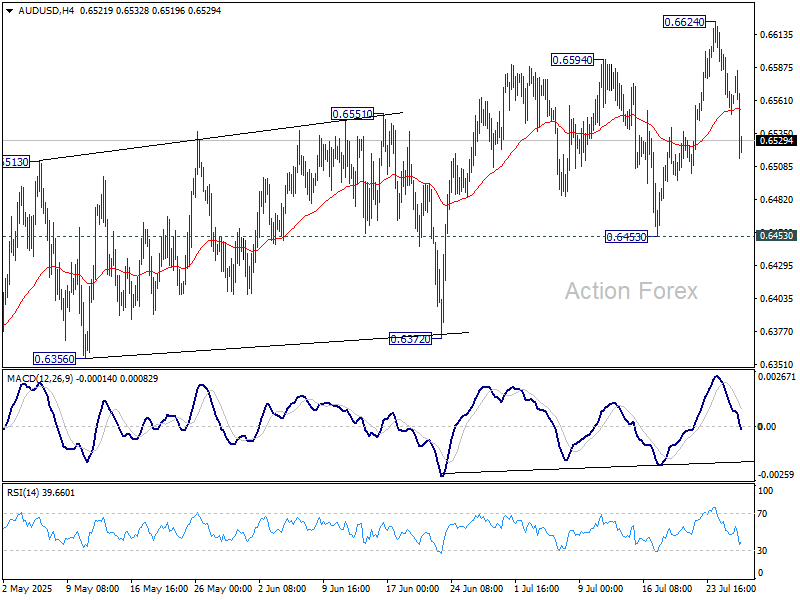
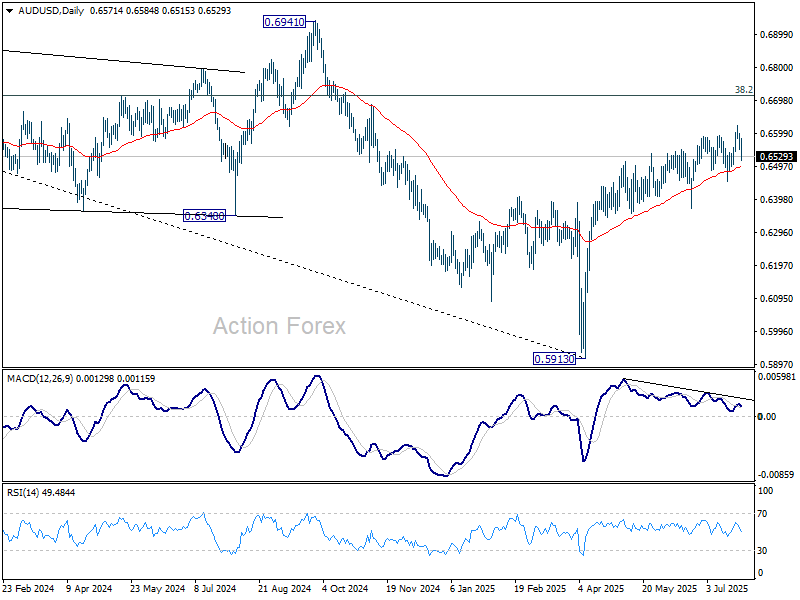
AUD/USD's pullback from 0.6624 accelerated lower today, but downside is contained well above 0.6453 support. Intraday bias remains neutral first. Rally from 0.5913 might still extend through 0.6624. However, considering bearish divergence condition in D MACD, upside should be limited by 0.6713 fibonacci level on next rise. Meanwhile, firm break of 0.6453 will turn bias back to the downside for deeper fall.
In the bigger picture, there is no clear sign that down trend from 0.8006 (2021 high) has completed. Rebound from 0.5913 is seen as a corrective move. While stronger rally cannot be ruled out, outlook will remain bearish as long as 38.2% retracement of 0.8006 to 0.5913 at 0.6713 holds. Nevertheless, considering bullish convergence condition in W MACD, even in case of another fall through 0.5913, downside should be contained above 0.5506 (2020 low).
Dollar Dominates as Euro Sinks Under Criticism of ‘Unequal’ Trade Pact
EUR/USD reversed sharply after an early bounce on Monday, as markets continued to digest the implications of the new US–EU trade framework. The pair’s drop was driven by a combination of Euro weakness and resurgent Dollar strength, reflecting an underwhelming investor response to the deal and shifting interest back toward US assets.
Euro’s softness wasn’t limited to the dollar. EUR/GBP and EUR/JPY also turned lower, confirming that selling pressure is broad-based. Meanwhile, the steep drop in AUD/USD and renewed surge in USD/CAD underline that Dollar bulls are firmly back in control, aided by widening rate differentials.
Criticism of the US–EU deal has intensified within the bloc. Many see the agreement as skewed in favor of the US, which extracted sweeping energy and investment pledges from the EU while locking in a 15% tariff on most goods—a sharp climb from the pre-Trump status quo. The deal is viewed less as a breakthrough and more as damage control.
French Prime Minister Francois Bayrou labeled the agreement “a dark day for Europe,” arguing that the EU had capitulated to Washington. Such sentiment reflects deeper discontent within the bloc, particularly among industries hardest hit by the tariff hike. While German and French equities initially opened higher, gains quickly faded as market participants reassessed the trade-off.
On the US side, the trade deal is being hailed as a strategic win. Investors see renewed clarity in transatlantic relations, and the large tariff buffer may give US inflation a further boost. That, in turn, could reinforce the Fed’s cautious approach. While a September cut remains likely, the pace of easing may stay slow and deliberate.
In the currency markets, Dollar is now the day’s top performer so far, followed by Loonie and Sterling. Euro and Swiss Franc are the worst performers, while Aussie, Kiwi, and Yen mixed.
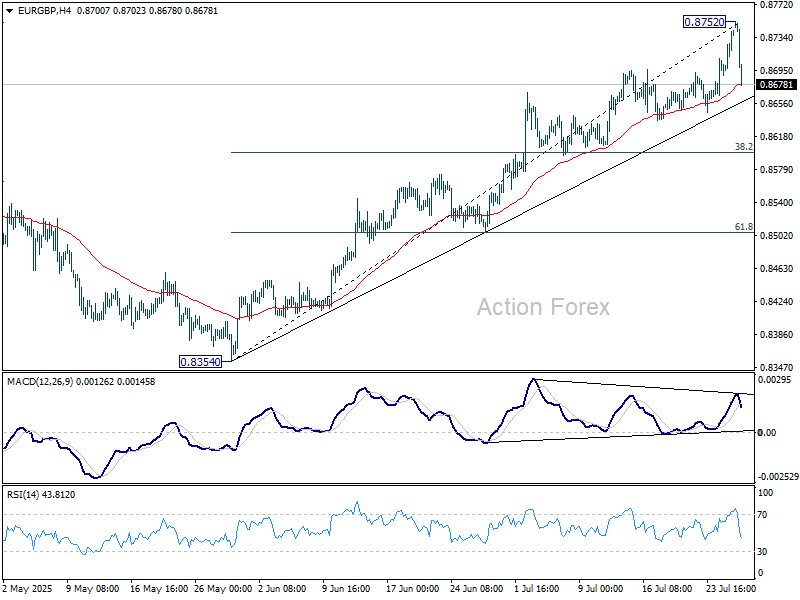
Technically, intraday bias in EUR/GBP is turned neutral first with current steep retreat. Considering bearish divergence condition in 4H MACD, sustained trading below 55 4H EMA (now at 0.8679) should indicate short term topping at 0.8752. Deeper fall should then be seen to 38.2% retracement of 0.8354 to 0.8752 at 0.8600.
In Europe, at the time of writing, FTSE is down -0.14%. DAX is flat. CAC is up 0.28%. UK 10-year yield is up 0.01 at 4.641. Germany 10-year yield is down -0.017 at 2.705. Earlier in Asia, Nikkei fell -1.10%. Hong Kong HSI rose 0.68%. China Shanghai SSE rose 0.12%. Singapore Strait Times fell -0.47%. Japan 10-year JGB yield fell -0.036 to 1.569.
ECB’s Kazimir cites no urgency to cut rates again
Slovak ECB Governing Council member Peter Kazimir pushed back against expectations of a September rate cut, stating he doesn’t foresee any data “significant enough” to warrant action in the near term. Writing in a blog post, Kazimir, one of the more hawkish voices on the Council, emphasized that only clear signs like "unravelling in the labour market” would prompt him to support another cut.
Kazimir acknowledged that the US–EU trade deal brings a degree of stability, noting it “can help to ease concerns and regain confidence,” but cautioned that it’s too soon to judge its inflationary implications. He added that while inflation may dip below target in the coming year, he sees “no looming spectre of a sustained undershooting,” reinforcing his preference to wait and assess.
AUD/USD Mid-Day Report
Daily Pivots: (S1) 0.6544; (P) 0.6573; (R1) 0.6594; More...
AUD/USD's pullback from 0.6624 accelerated lower today, but downside is contained well above 0.6453 support. Intraday bias remains neutral first. Rally from 0.5913 might still extend through 0.6624. However, considering bearish divergence condition in D MACD, upside should be limited by 0.6713 fibonacci level on next rise. Meanwhile, firm break of 0.6453 will turn bias back to the downside for deeper fall.
In the bigger picture, there is no clear sign that down trend from 0.8006 (2021 high) has completed. Rebound from 0.5913 is seen as a corrective move. While stronger rally cannot be ruled out, outlook will remain bearish as long as 38.2% retracement of 0.8006 to 0.5913 at 0.6713 holds. Nevertheless, considering bullish convergence condition in W MACD, even in case of another fall through 0.5913, downside should be contained above 0.5506 (2020 low).
ECB’s Kazimir cites no urgency to cut rates again
Slovak ECB Governing Council member Peter Kazimir pushed back against expectations of a September rate cut, stating he doesn’t foresee any data “significant enough” to warrant action in the near term. Writing in a blog post, Kazimir, one of the more hawkish voices on the Council, emphasized that only clear signs like "unravelling in the labour market” would prompt him to support another cut.
Kazimir acknowledged that the US–EU trade deal brings a degree of stability, noting it “can help to ease concerns and regain confidence,” but cautioned that it’s too soon to judge its inflationary implications. He added that while inflation may dip below target in the coming year, he sees “no looming spectre of a sustained undershooting,” reinforcing his preference to wait and assess.
EU and US Reach a Deal, Euro Slips
The euro is busy on Monday morning. EUR/USD started the week in positive territory and rose as much as 0.30%, but has reversed directions in the European session and is trading at 1.1677, down 0.54% on the day.
EU and the US reach a trade deal
US President Trump can add another feather to his MAGA cap, with news that the European Union and the United States reached a trade agreement over the weekend. President Trump had threatened to hit the EU with 30% tariffs if a deal wasn't reached by Aug. 1 and the specter of a nasty trade war between the largest two economies in the world has been averted.
A deal is of course good news but it's important to keep in mind that the sides have agreed to a framework agreement, which is thin on details. Some contentious issues remain, such as the US tariff of 50% on steel and aluminum.
The deal mirrors the US-Japan agreement which was announced last week. The US will eliminate some tariffs, such as on aircraft parts and generic drugs, but most European products will face a tariff of 15%, which will make European imports more expensive for US consumers. The EU has also agreed to increase investment in the US by $600 billion and purchase $750 billion in US energy products.
The German auto industry is one of the deal's big winners, as the 15% tariff will be easier to swallow than the current rate of 27.5%. The US-Japan deal puts a 15% tariff on Japanese motor vehicles, which would have put European automakers at a major disadvantage without a EU-US deal.
Trump is moving ahead and reaching deals with major trade partners, which is removing uncertainty and raising risk appetite. Investors are hoping that other key nations, such as Canada and South Korea, will follow soon with trade agreements with the US.
EUR/USD Technical
- EUR/USD has pushed below support at 1.1735 and 1.1710 and is testing 1.1677. Below, there is support at 1.1652
- There is resistance at 1.1768 and 1.1793
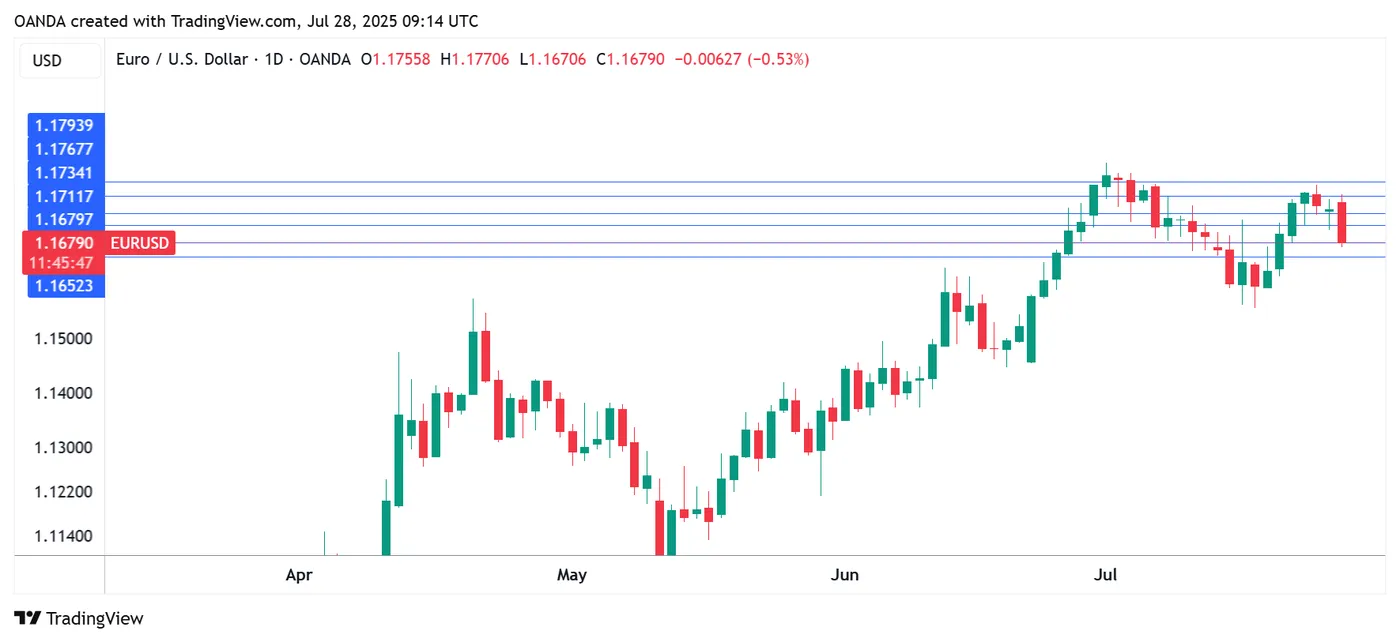
EURUSD 1-Day Chart, July 28, 2025
EUR/USD: Tests Strong Support Zone After a Sharp Drop
EURUSD lost ground on Monday after a gap-higher opening and short-lived gains, losing nearly 0.7% in late-Asian / early European trading.
Positive impact from US-EU trade deal was so far very limited, probably that markets have already positively reacted on anticipation that agreement will be reached before the deadline and after digesting the news about the whole package, signed in Scotland, which may not be in favor of the EU bloc.
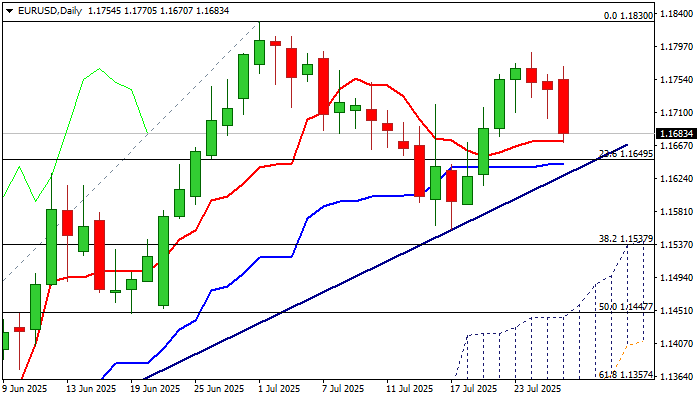
Technical picture on daily chart weakened as 14-d momentum crossed in the negative territory, after bears cracked initial support at 1.1672 (daily Tenkan-sen) and eye more significant supports at 1.1650/30 zone (Fibo 23.6% of 1.1065/1.1830 uptrend / daily Kijun-sen / trendline support.
Violation of these levels would further weaken near-term structure and unmask key supports at 1.1556/37 (July 17 higher low / Fibo 38.2%), loss of which to complete bearish failure swing pattern and generate reversal signal.
Conversely, ability to hold above the trendline (ideally) would generate initial signal about a healthy correction before larger bulls return to play.
Res: 1.1703; 1.1770; 1.1789; 1.1830.
Sup: 1.1650; 1.1630; 1.1589; 1.1556.
Gold Declines as EU Strikes Trade Deal
Gold held steady at $3,330 per troy ounce on Monday following three consecutive days of declines. The metal faced downward pressure after news emerged of a trade agreement between the US and the EU, dampening investor interest in safe-haven assets.
On Sunday, the US and EU reached a broad trade deal, which includes a 15% tariff on most European goods, alongside commitments to invest hundreds of billions of dollars in American industry. This agreement mirrors last week’s US–Japan trade pact in structure.
Traders are now bracing for a busy week of economic events, with the Federal Reserve meeting at the centre of attention. While interest rates are expected to remain unchanged, markets will scrutinise any signals about a potential rate cut in September.
Key US labour market data will also be in focus, including JOLTS reports, ADP employment figures, and the crucial nonfarm payrolls release. Equally significant will be the PCE price index – the Fed’s preferred inflation gauge – which will indicate whether price pressures are intensifying amid new tariffs.
Technical Analysis: XAU/USD
H4 Chart:
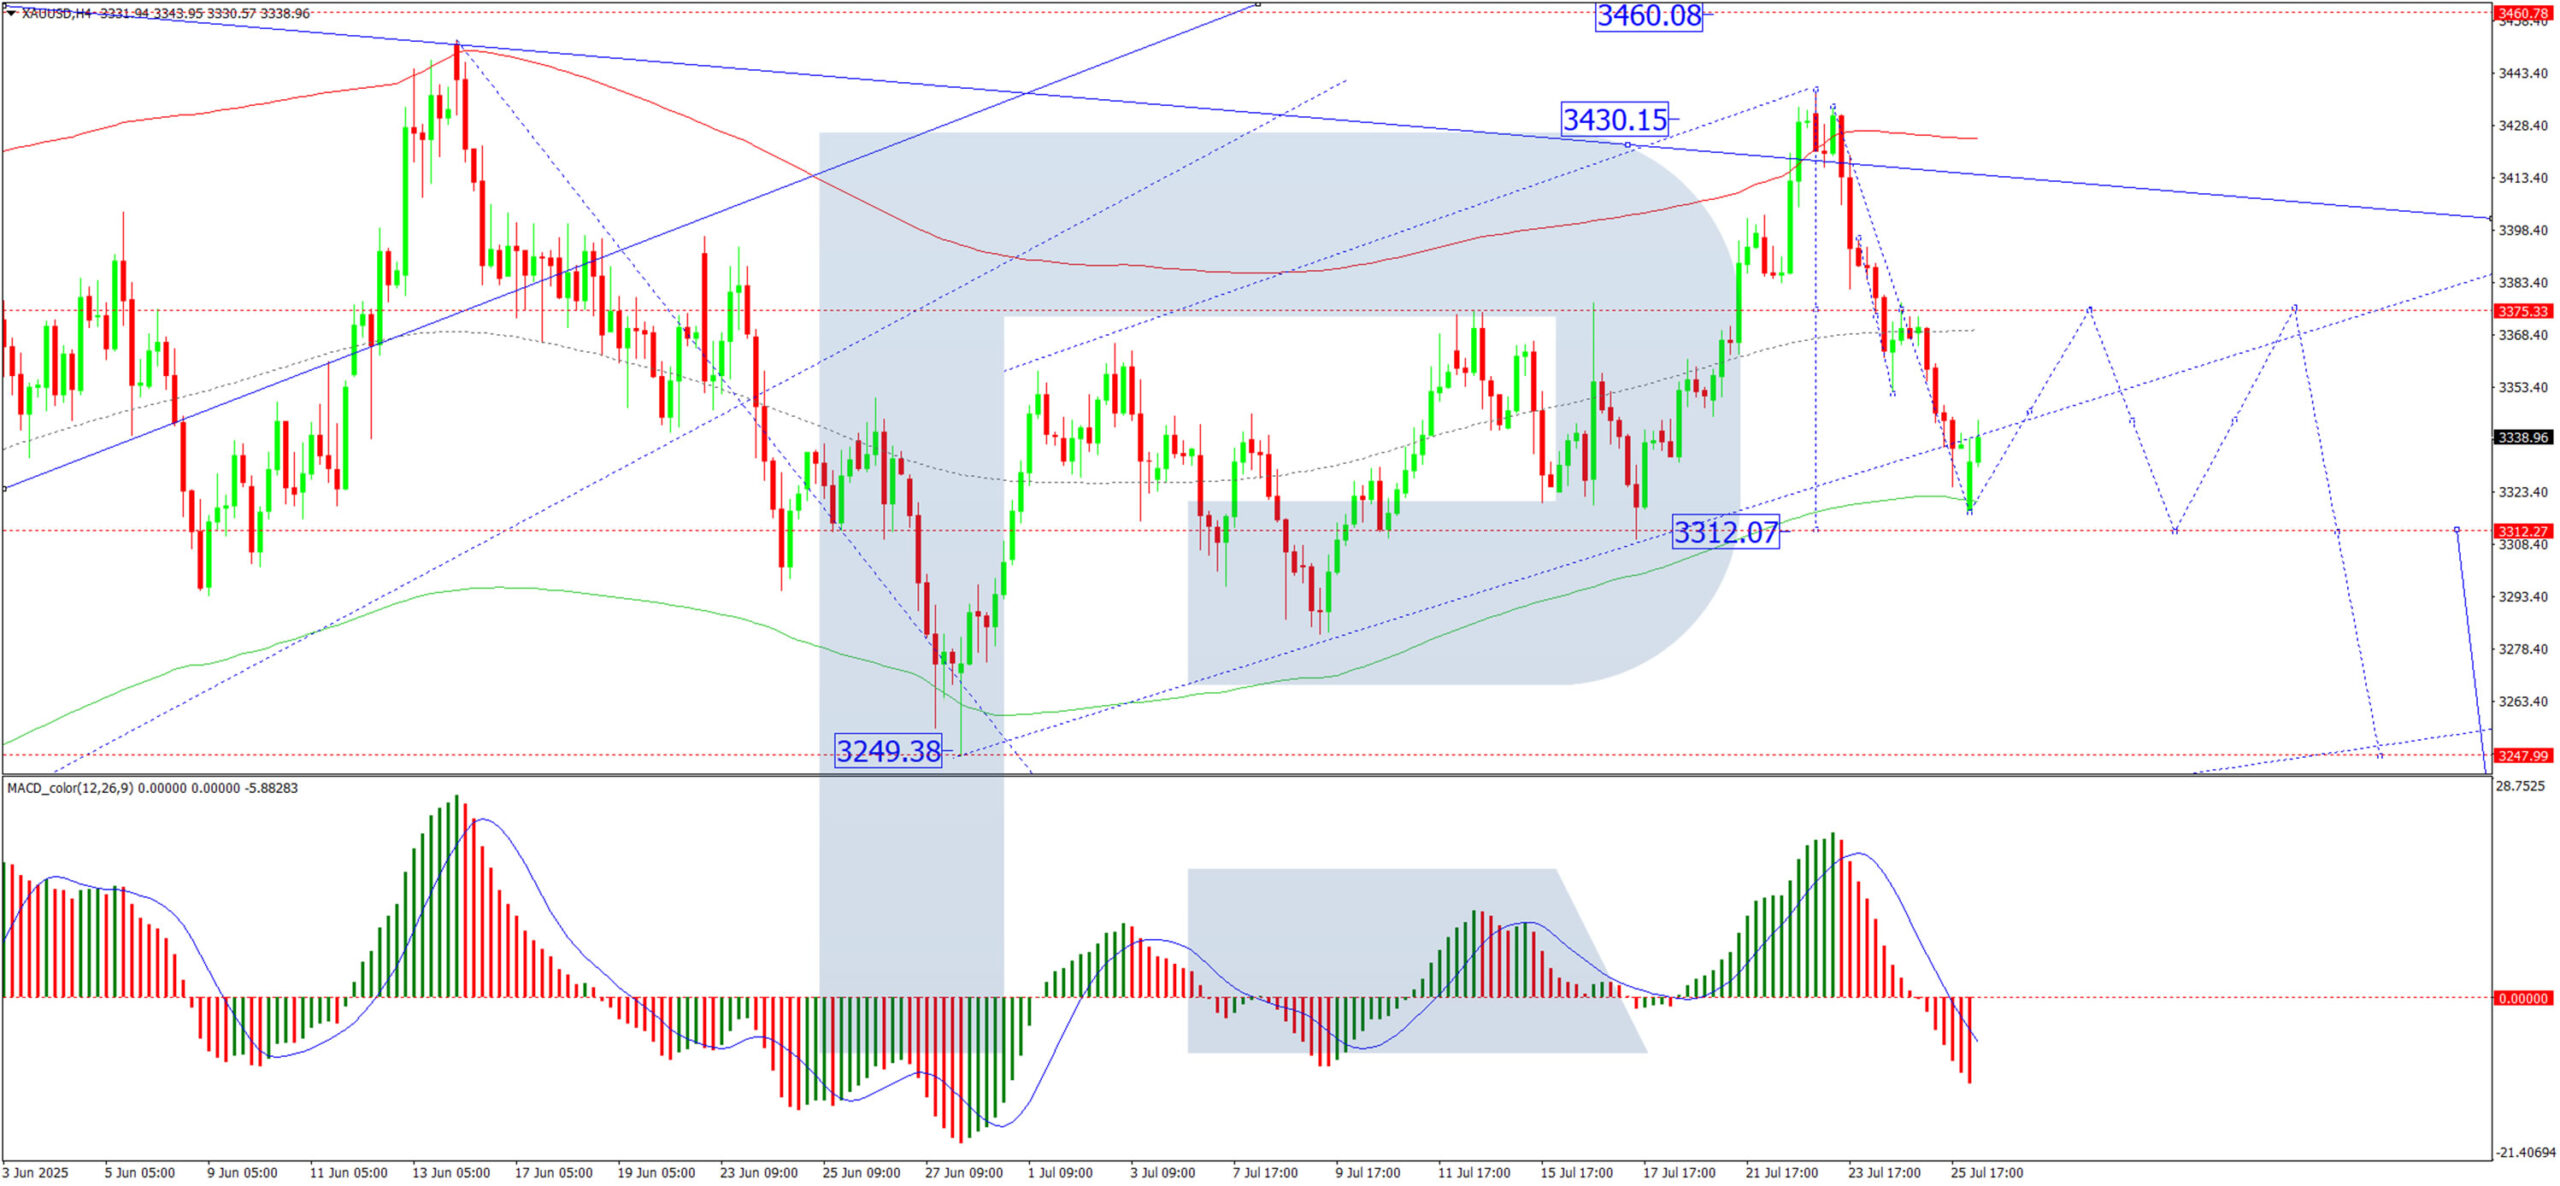
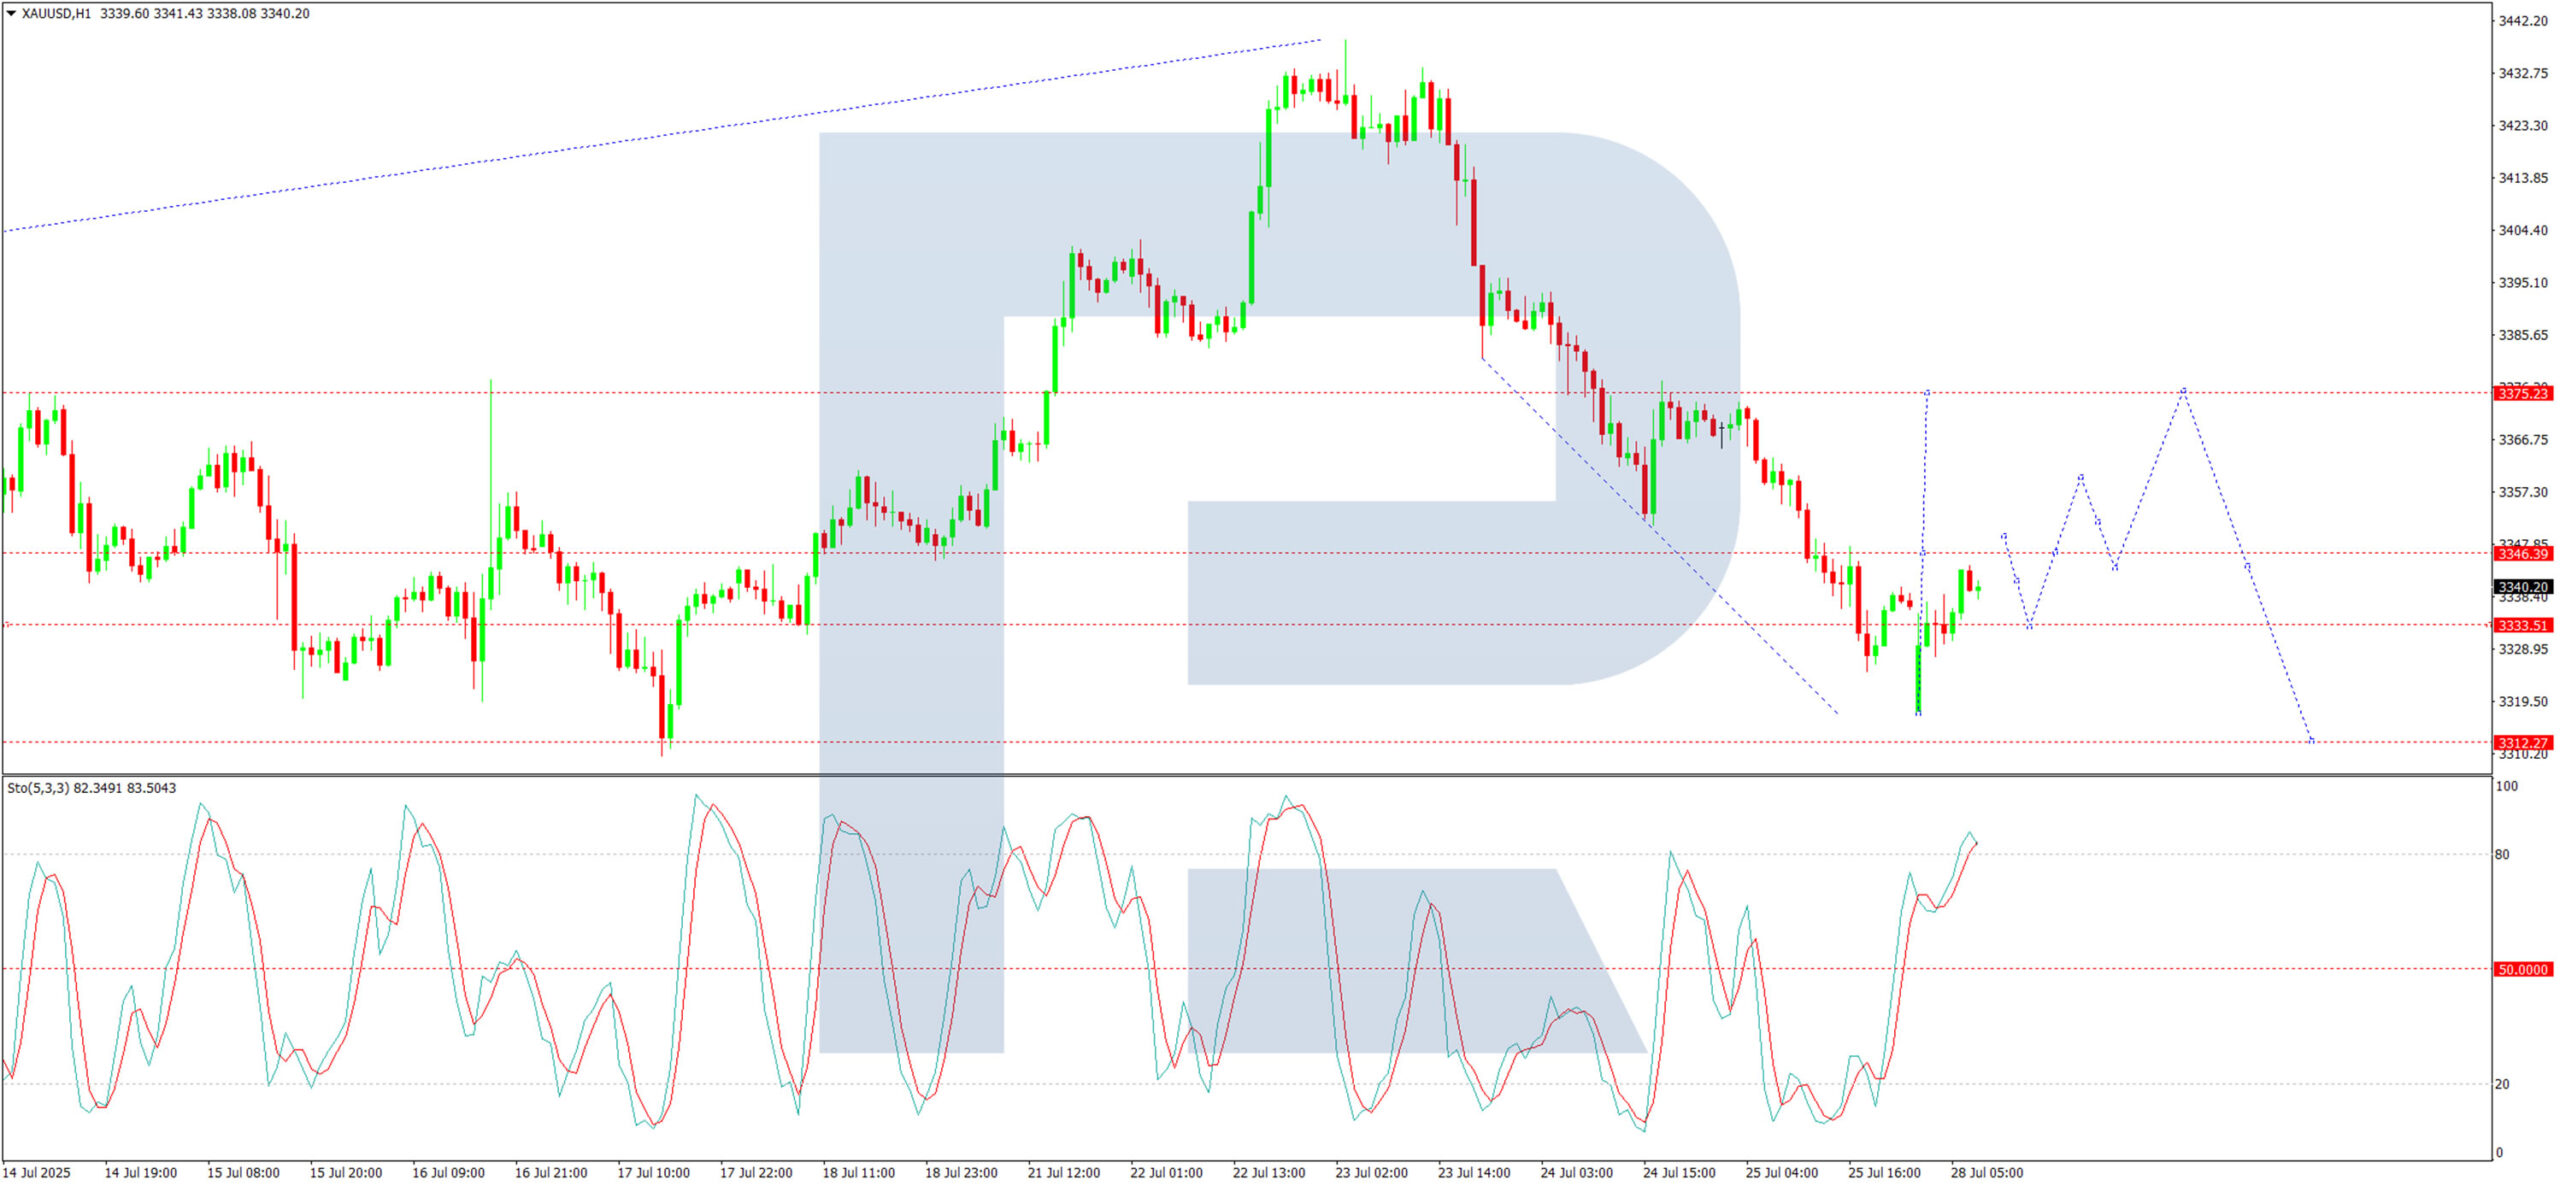
The H4 chart shows XAU/USD forming a broad consolidation range around 3,375. After breaking downward today, the market reached its local downside target at 3,318. Following this, we anticipate a possible upward correction towards 3,375 (testing from below), before a renewed decline towards 3,312. This scenario is supported by the MACD indicator, with its signal line below zero and pointing sharply downward.
H1 Chart:
On the H1 chart, the market has achieved its local decline target at 3,318. Currently, an upward impulse is forming towards 3,349. A consolidation range near 3,346 may develop, with an upside breakout potentially extending gains to 3,375. Thereafter, a new downward wave towards 3,312 could emerge. The Stochastic oscillator aligns with this outlook, as its signal line is above 50 and rising sharply towards 80.
Conclusion
Gold remains under pressure amid shifting global trade dynamics, with technical indicators suggesting further volatility ahead. Traders should monitor key US data releases and signals from the Fed for directional cues.
Global Markets Mixed as US-EU Trade Deal Lifts Wall Street, JPY Slides Further, CHF/JPY (Chart of the Day)
In today’s Asia session, the S&P 500 and Nasdaq 100 E-mini futures recorded intraday rallies of 0.5% and 0.6%, respectively, extending gains from Friday, 25 July’s record-high closes. The rally was driven by optimism following reports of a US-EU trade agreement that has eased global market tensions.
US-EU avoid trade war with new tariff agreement
Late Sunday, media reports confirmed that the European Union and the United States have reached a breakthrough trade agreement after months of strained negotiations. The deal, announced by President Trump and European Commission President Ursula von der Leyen, sets a 15% tariff on EU exports to the US that includes automobiles, down from the previously threatened 30%. Full details are still pending release.
Nikkei slides amid political uncertainty in Japan
Asia-Pacific markets showed mixed performances. Japan’s Nikkei 225 dropped 0.9% intraday for a second consecutive loss, weighed down by domestic political instability. Local reports suggest the Liberal Democratic Party is moving to initiate a parliamentary vote to replace Prime Minister Ishiba.
US-China trade talks resume in Stockholm
The third round of US-China trade negotiations begins today in Stockholm. According to the South China Morning Post, both nations are expected to agree on extending the current tariff pause by 90 days, pushing the deadline beyond 12 August and signaling ongoing diplomatic engagement.
Hang Seng rebounds while Singapore market consolidates
Hong Kong’s Hang Seng Index gained 0.5%, recovering from Friday’s losses. Meanwhile, Singapore’s Straits Times Index declined 0.3% for a second straight session as investors paused after an 11% rally since 23 June.
Dollar recovers as euro reverses gains
The US dollar regained earlier intraday losses triggered by the US-EU trade news. The euro erased a 0.2% gain and now trades flat, while the Japanese yen and Swiss franc declined 0.2% and 0.3% respectively, with yen weakness tied to local political developments.
Gold rebounds slightly ahead of FOMC
Gold (XAU/USD) edged up 0.1% intraday after a three-day slide. Traders remain cautious as they weigh trade deal optimism against anticipation of the upcoming FOMC meeting on 30 July. Market participants are watching for signs that Fed Chair Powell may pivot toward a more dovish stance, potentially setting up a rate cut at the September meeting.
Economic data releases
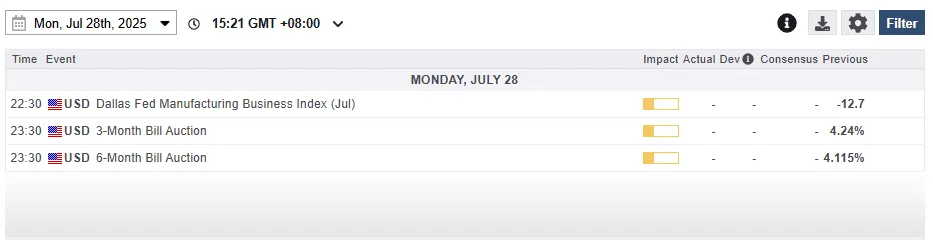
Fig 1: Key data for today’s Asia mid-session (Source: MarketPulse)
Chart of the day – Bullish flag breakout for CHF/JPY
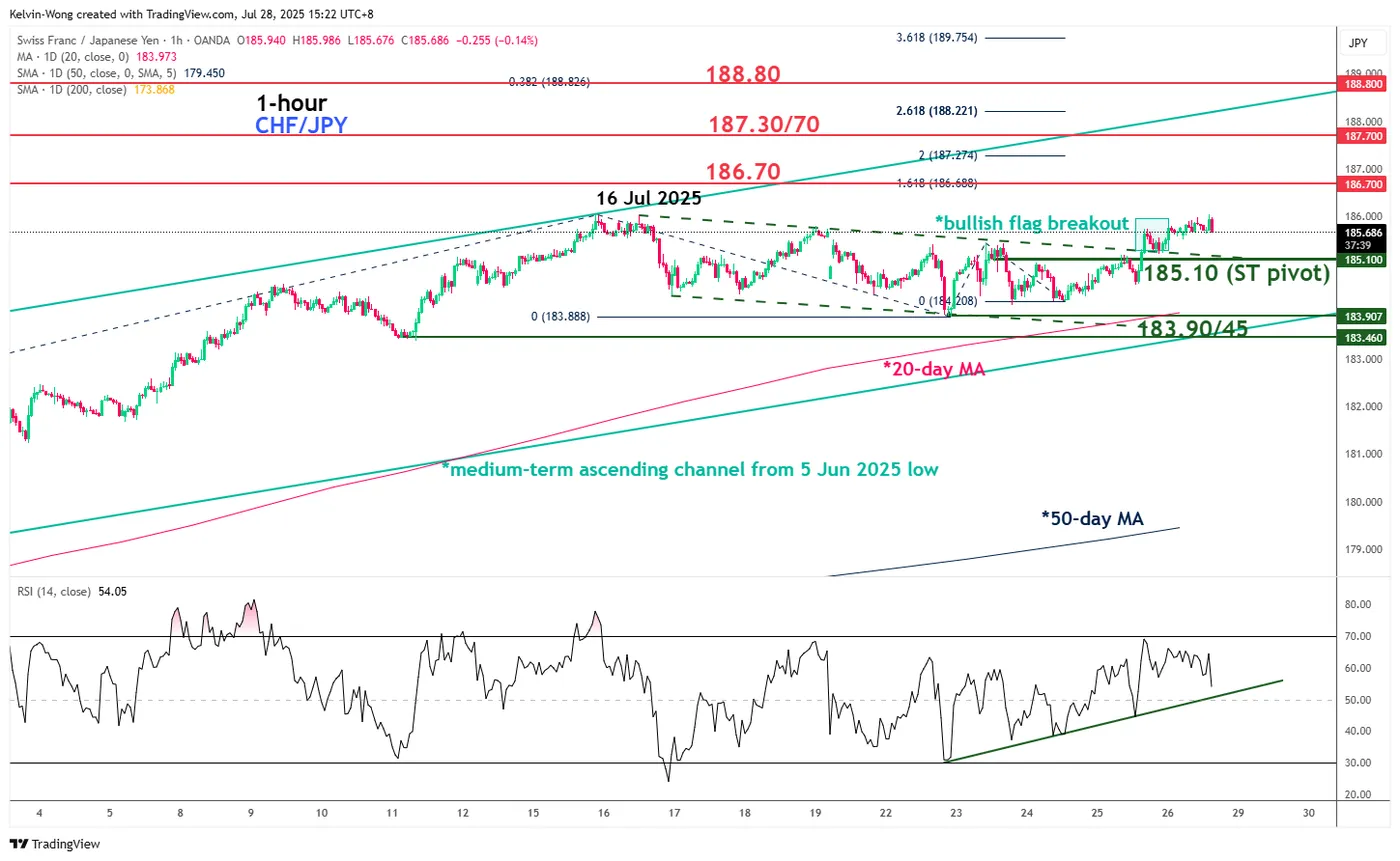
Fig 2: CHF/JPY minor & medium-term trends as of 28 July 2025 (Source: TradingView)
The CHF/JPY cross pair staged a minor bullish flag breakout last Friday, 25 July, with a positive follow-through in today’s Asia session.
In addition, the hourly RSI momentum indicator has continued to hover above its 50 level and parallel ascending trendline support without hitting its overbought region (above 70) at this juncture.
These observations suggest that minor corrective consolidation in place since 16 July is likely to have ended, and the CHF/JPY may be in the process of staging a potential fresh bullish impulsive up move sequence within its medium-term uptrend phase (see Fig 2).
Watch the 185.10 short-term pivotal support for the next intermediate resistances to come in at 186.70, 187.30/187.70, and 188.80.
On the flip side, a break below 185.10 negates the bullish tone for a slide to expose the next intermediate support at 183.90/183.45 (also the 20-day moving average).