Sample Category Title
USDCAD Wave Analysis
USDCAD: ⬆️ Buy
- USDCAD rising inside sideways price range inside
- Likely to reach resistance level 1.3800
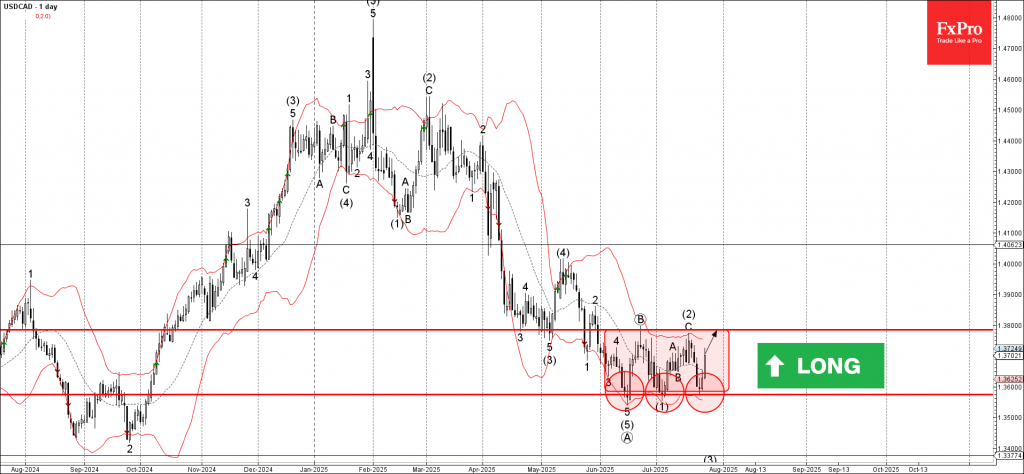
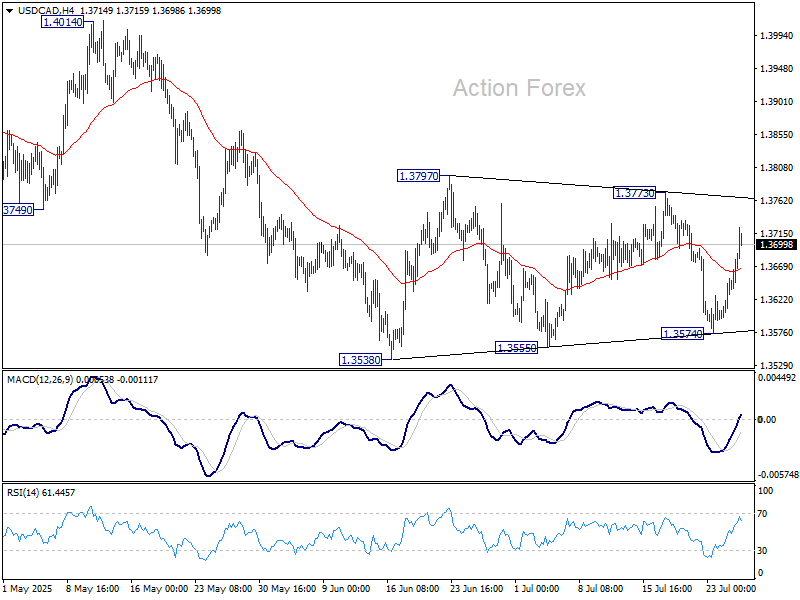
USDCAD currency pair recently reversed down from the key support level 1.3575 (which is the lower boundary of the sideways price range inside which the price has been trading from June).
The upward reversal from the support level 1.3575 created the daily Japanese candlesticks reversal pattern Morning Star.
USDCAD currency pair can be expected to rise to the next resistance level 1.3800 (upper border of this sideways price range, top of wave (2)).
Risk Appetite Builds After US-Japan Deal, DAX and Euro Awaits Transatlantic Breakthrough
Investor sentiment turned decisively upbeat last week, with global equities rallying on the back of a landmark trade agreement between the US and Japan. The deal was welcomed by markets as a major breakthrough just days ahead of the August 1 tariff deadline.
Japan’s Nikkei surged past 42k mark, with momentum now suggesting a breakout to new record may be imminent. US stocks also extended gains, with the S&P 500 and NASDAQ closing at fresh all-time highs.
In Europe, however, DAX underperformed amid investor caution ahead of pivotal US-EU trade talks. Focus now shifts to Sunday’s high-stakes meeting between US President Donald Trump and European Commission President Ursula von der Leyen in Scotland.
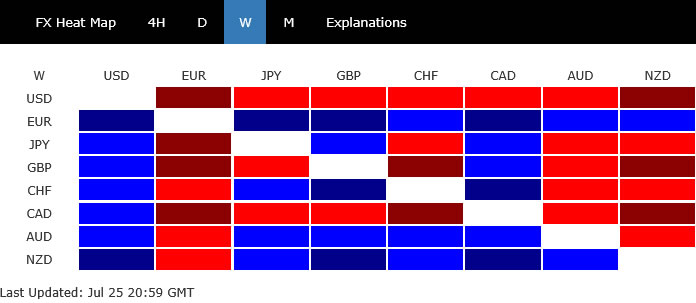
In the currency markets, Euro led weekly gains, supported by fading expectations of a near-term ECB rate cut. The Kiwi and Aussie followed closely, buoyed by strong risk-on flows.
Dollar ended the week as the worst-performing major, despite a late-week rebound. Loonie and Sterling were the next weakest, while the Yen and Swiss Franc held in the middle of the pack.
Nikkei Surges Toward Record High on US-Japan Deal
Investor sentiment got a powerful boost last week by the breakthrough in US-Japan trade negotiations, with the two sides agreeing a sweeping deal that includes a 15% blanket tariff on Japanese imports, down from a proposed 25%, and significant Japanese market access for US autos, agriculture, and rice. The agreement also includes private-sector-led projects, with Japan’s top negotiator confirming profit-sharing arrangements will reflect actual capital contributions. Overall, the announcement being made just days ahead of the August 1 global tariff escalation deadline, was seen as a stabilizing force amid rising global trade tensions.
Nikkei surged through 42k for the first time since early 2024, reflecting optimism that the deal will tremendously ease tariff-related uncertainty. Traders booked some profits ahead of the weekend, but market momentum remains strong. With the cloud of trade disruption easing and investors rotating back into Japan, Nikkei should be ready to challenge its 2024 record of 42426.77 in the very near term.
Yet, domestic uncertainties are clouding the outlook. Prime Minister Shigeru Ishiba, whose Liberal Democratic Party suffered a stinging defeat, has yet to confirm a resignation date. Political paralysis could derail fiscal coordination at a time when expansionary policies are being discussed to support the economy.
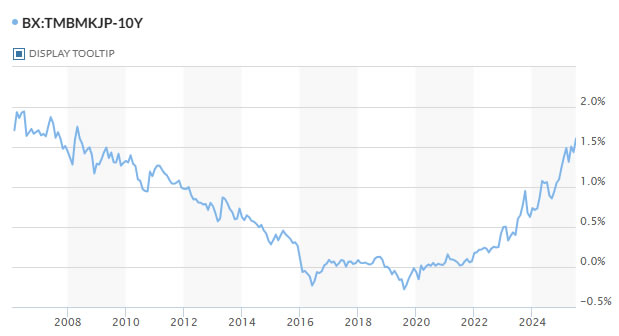
Besides, the election results raised the risk of deteriorating fiscal discipline. Markets took notice—10-year JGB yields breached 1.6%, a level not seen in over 15 years. A weak 40-year bond auction midweek further signaled investor caution, with the bid-to-cover ratio falling to its lowest since 2011.
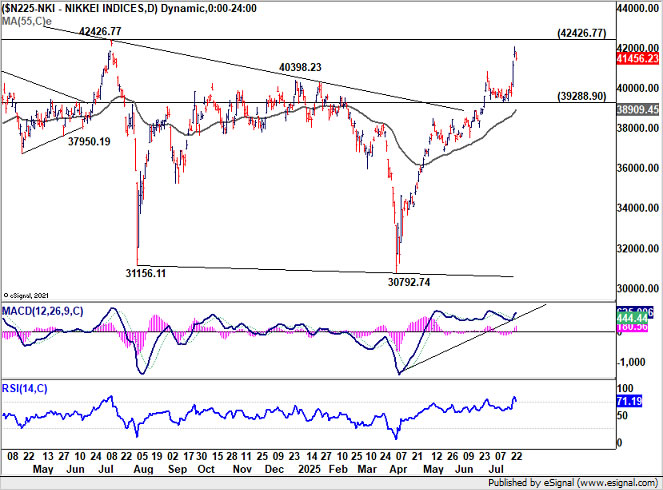
Technically, while initial resistance could be seen from 42426.77 record high to limit upside, near term outlook in Nikkei will stay bullish as long as 39288.90 support holds. Firm break of 42426.77 is expected eventually to resume the long term up trend.
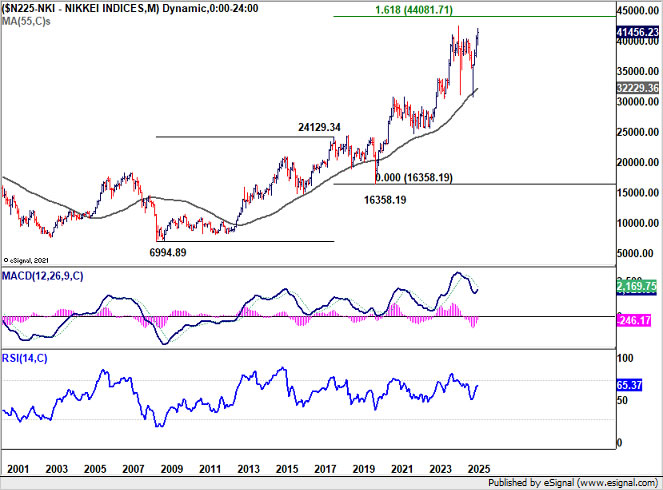
The main hurdle for Nikkei, however, will be on 161.8% projection of 6994.89 to 24129.34 from 16358.19 at 44081.71. Reaction from there will reveal how sustainable Nikkei's up trend would be.
Yen, meanwhile, softened after a brief recovery. The removal of trade risk is arguably a hawkish development for the BoJ, possibly nudging it toward another rate hike later this year. However, that expectation has been eclipsed by resurgent global risk appetite and Japanese equity strength, both weighing on the safe-haven currency.
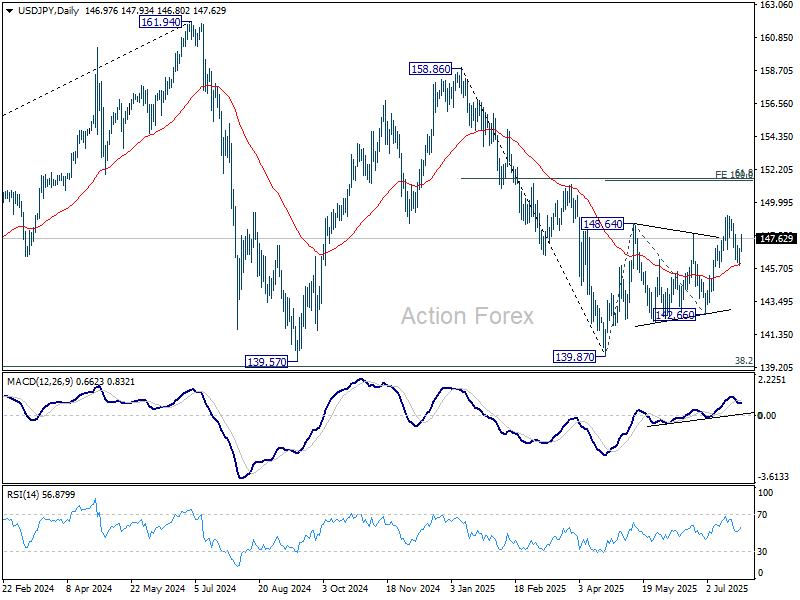
Technically, the strong support from 55 D EMA in USD/JPY is a clear near term bullish sign. The rebound from 139.87 should be ready to resume soon, to 100% projection of 139.87 to 148.64 from 142.66 at 151.43.
Decisive break of 151.43 will raise the chance that whole medium term corrective pattern from 161.94 (2024 July high) has completed with three waves to 139.87. That would also align with Nikkei's outlook, where medium term consolidation pattern from 42426.77 (2024 July high) has completed with three waves to 30792.44.
S&P 500 Logs Fifth Record Close, Dollar Still Vulnerable
US equities also closed out the week with strong gains, driven by trade optimism and an impressive earnings season. S&P 500 hit its fifth consecutive record, while the NASDAQ notched four record closes during the week.
The rally was supported by improved risk sentiment following breakthroughs in trade talks and by better-than-expected results from major companies, including Alphabet. The markets were further boosted by signs that companies have weathered tariff-related uncertainty more effectively than expected, with over 82% of S&P 500 firms beating earnings forecasts so far.
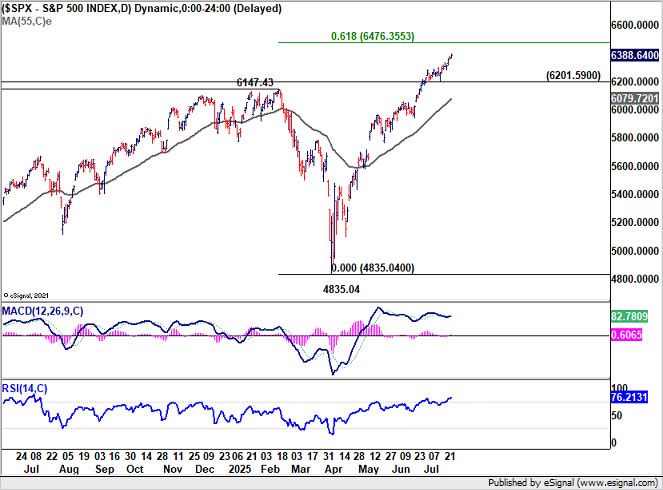
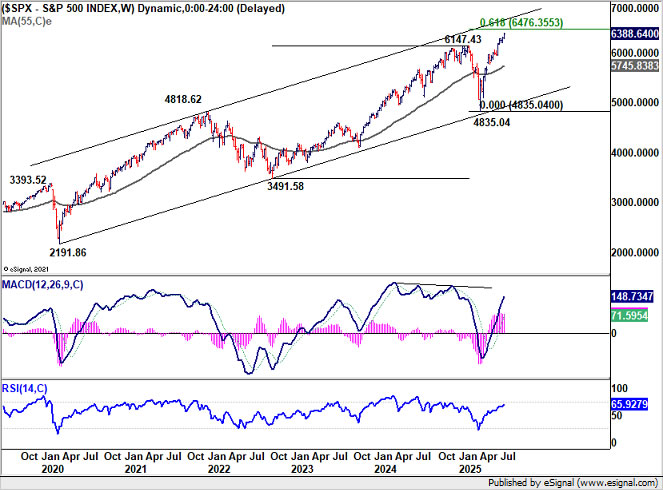
Technically, S&P 500 remains on track to 61.8% projection of 3491.58 to 6147.43 from 4835.04 at 6476.35. There might be some resistance between this projection level and long term channel resistance to limit upside on the first attempt. But still, near term outlook will stay bullish as long as 6201.59 support holds, in case of retreat.
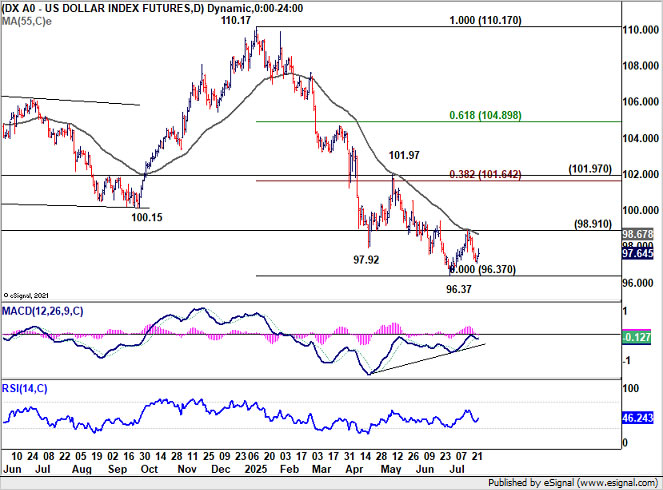
Dollar Index dipped to 97.10 midweek before recovering Friday after signs emerged that US President Donald Trump is unlikely to fire Fed Chair Jerome Powell.
Technically, though, prior rejection by falling 55 D EMA (now at 98.67) is a near term bearish sign. Price actions from 96.37 are currently seen as a consolidation pattern only. Further decline is expected as long as 98.91 resistance holds. Break of 96.37 will resume larger fall from 110.17.
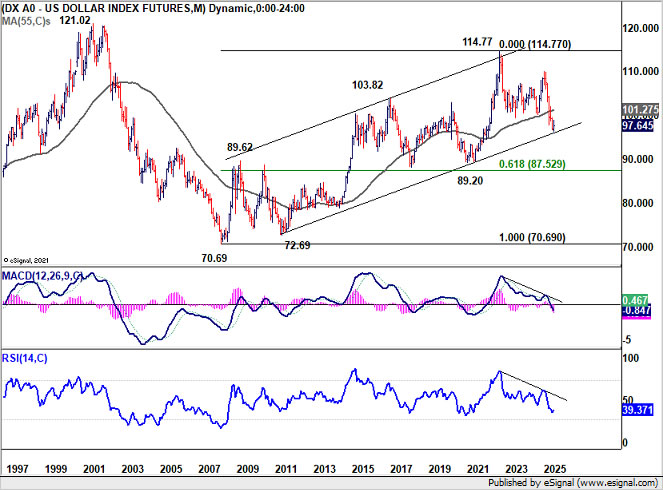
However, it should be pointed out again that Dollar Index is close to decade long channel support (now at around 96). With bullish convergence conditio in D MACD too, firm break of 98.91 support will be a strong sign of bottoming. Further rise should then be seen to 101.97 resistance, which is slightly above 38.2% retracement of 110.17 to 96.27 at 101.64, even still as a corrective move.
DAX Awaits Trade Breakthrough, Trump–Von der Leyen Talks Loom
European markets, on the other hand, wrapped the week with mixed sentiment. FTSE 100 notched a fresh record high, benefiting from global risk-on mood. In contrast, Germany’s DAX remained stuck within a near-term range, reflecting broader investor caution as key US-EU trade negotiations approach a potential climax.
Much of the hesitation is tied to uncertainty around the outcome of talks between Washington and Brussels. While reports suggest meaningful progress has been made in discussions, traders are holding back from decisive positioning until there is clear confirmation of a deal—or a breakdown.
Focus now turns to Sunday, when European Commission President Ursula von der Leyen is set to meet US President Donald Trump in Scotland. The high-stakes summit could determine whether a new US-EU trade pact is secured ahead of the August 1 tariff deadline, or if the transatlantic relationship shifts back toward confrontation.
Trump confirmed the meeting on Friday, telling reporters in Glasgow, “Ursula will be here — a highly respected woman. So we look forward to that.” He added that the chances of a deal were “50-50,” with sticking points remaining on “maybe 20 different things.”
Von der Leyen’s spokesperson noted “intensive negotiations” have been taking place across technical and political levels. Her office emphasized that leaders are now weighing a “balanced outcome” that protects cross-border trade and consumer stability.
European diplomats have hinted that the deal on the table could mirror the recent US-Japan pact, featuring a 15% base tariff and possible carve-outs for sensitive sectors like autos and agriculture.
Sunday’s meeting marks the final window for a diplomatic resolution before the US triggers its tariff package. Failure to strike a deal could spark broad retaliation and weigh heavily on sentiment heading into August.
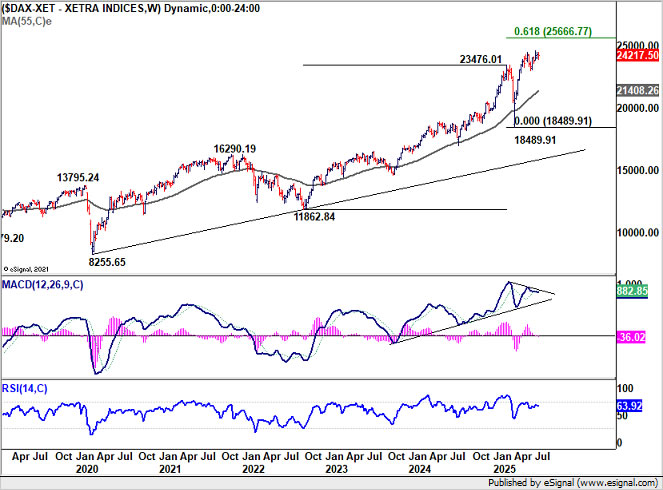
Technically, near term outlook in DAX remains bullish with 23051.55 intact. Breakthrough in US-EU trade negotiations could easily push it through 24639.10 record high.

However, considering bearish divergence condition in W MACD, the real test for DAX would be at 61.8% projection of 11862.84 to 23476.01 from 18489.91 at 25666.77. Strong resistance might emerge there on first attempt to bring deeper correction.
Euro Leads Weekly Gains as Markets Scale Back ECB Cut Bets
Despite lackluster performance in DAX and CAC, Euro stood out as the best-performing major currency, posting solid gains across the board. The reassessment of the ECB’s policy outlook played a key role in driving renewed buying interest.
Markets no longer see a September rate cut as a done deal. While one more move is still possible before the current easing cycle concludes, the odds have shifted toward a later date. October is gaining attention, but December—when the ECB will release updated economic projections—might be even more plausible.
The ECB's decision to keep the deposit rate steady at 2.00% came as no surprise. However, the tone of President Christine Lagarde’s post-meeting remarks reinforced the idea that the ECB is in no rush. Inflation is at target, and growth conditions have turned “relatively favorable,” as she described, dampening the case for immediate action.
Importantly, Lagarde addressed recent strength of Euro, which some fear could undermine inflation. She dismissed those concerns, noting that the ECB’s June forecasts had already factored in slight undershoots in the coming months. For now, she emphasized, it’s the medium-term path that matters most for policy.
Technically, EUR/CAD's up trend is probably resume to resume through 1.6105 short term top. Firm break there will target 61.8% projection of 1.4483 to 1.5959 from 1.5598 at 1.6510.
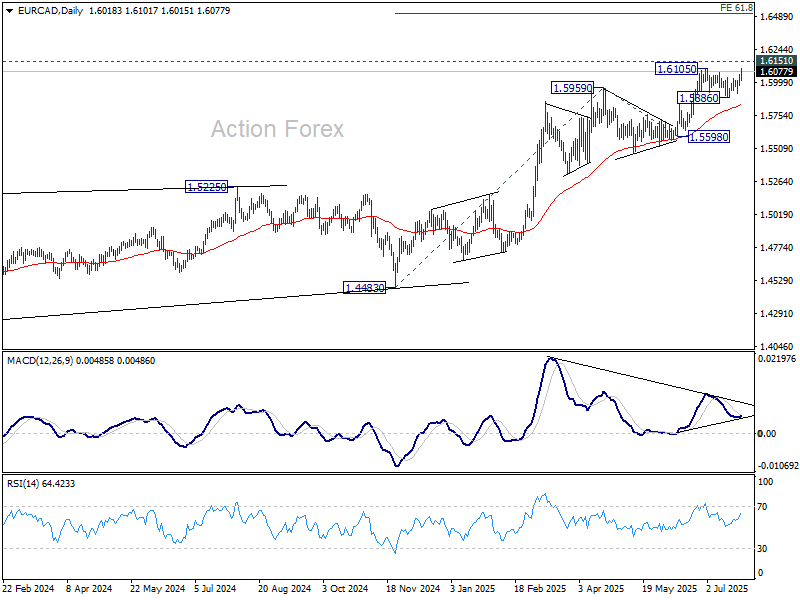
More importantly, sustained trading above 1.6151 key resistance (2018 high) will confirm resumption of the whole up trend from01.2127 (2012 low). That would pave the way to 100% projection of 1.2127 to 1.6151 from 1.2867 at 1.6891 in the medium term.

EUR/JPY Weekly Outlook
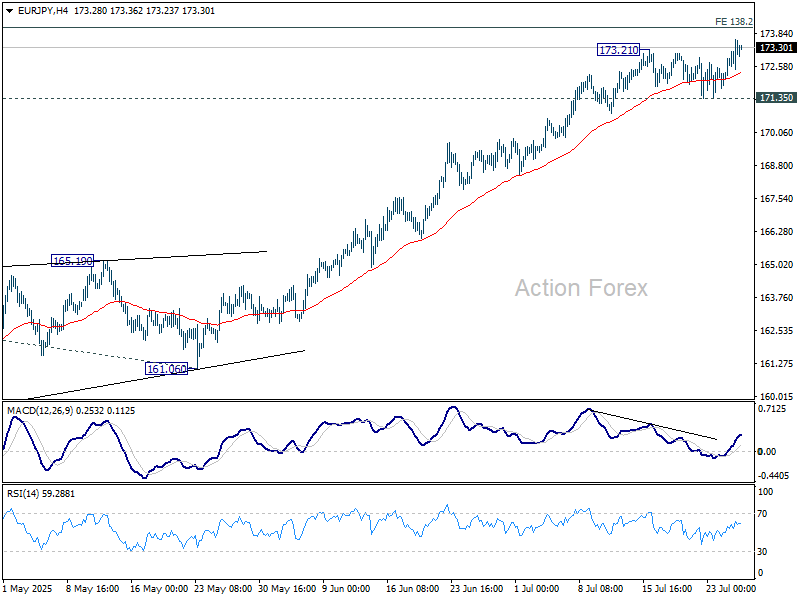
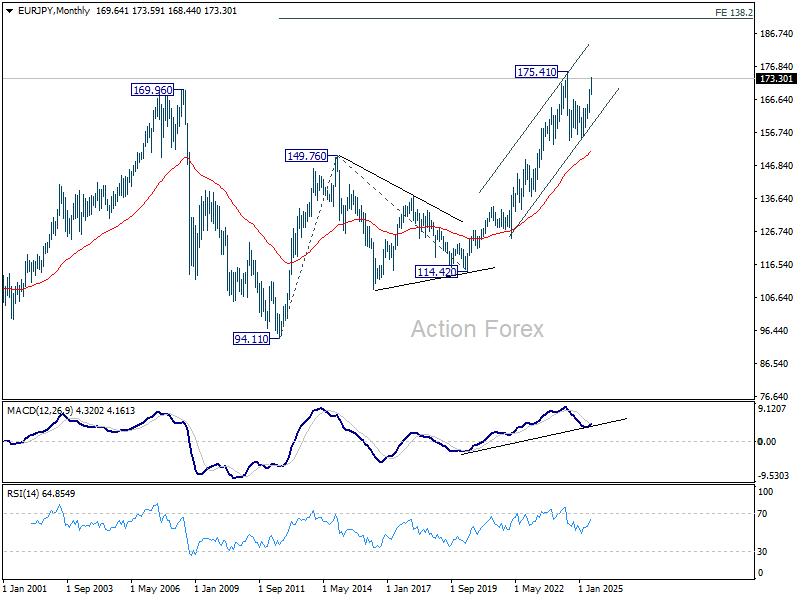
EUR/JPY's consolidations from 173.21 completed late last week with upside breakout. Initial bias is back on the upside this week for 138.2% projection of 154.77 to 164.16 from 161.06 at 174.03. Break there will bring retest of 175.41 high. For now, near term outlook will remain bullish as long as 171.35 support holds, in case of retreat.
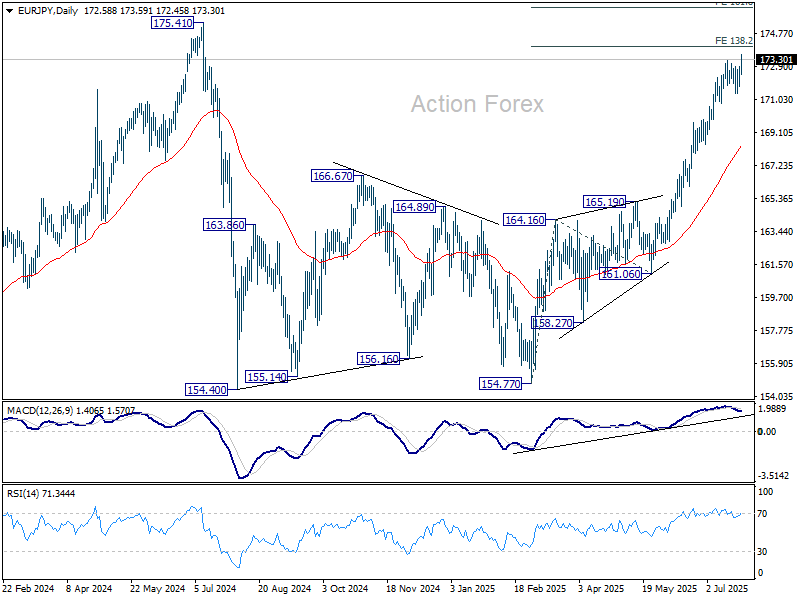
In the bigger picture, considering current strong momentum as seen in the rally from 154.77, corrective pattern from 175.41 could have already completed. Decisive break there will confirm long term up trend resumption. Next target is 61.8% projection of 124.37 to 175.41 from 154.77 at 186.31. However, rejection by 175.41, followed by firm break of 55 D EMA (now at 168.37) will delay this bullish case.
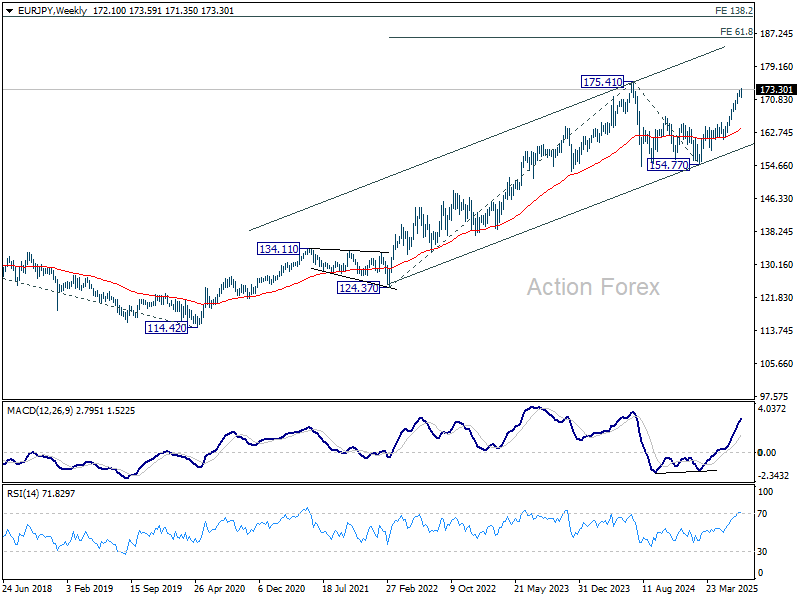
In the long term picture, up trend fro 94.11 (2021 low) is still in progress. On resumption, next target is 138.2% projection of 94.11 to 149.76 (2014 high) from 114.42 (2020 low) at 191.32.
EUR/USD Weekly Outlook
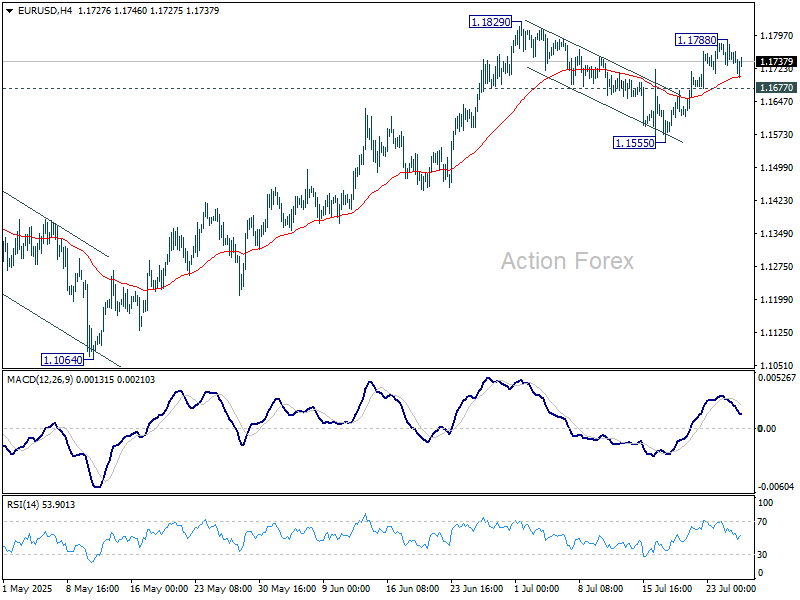
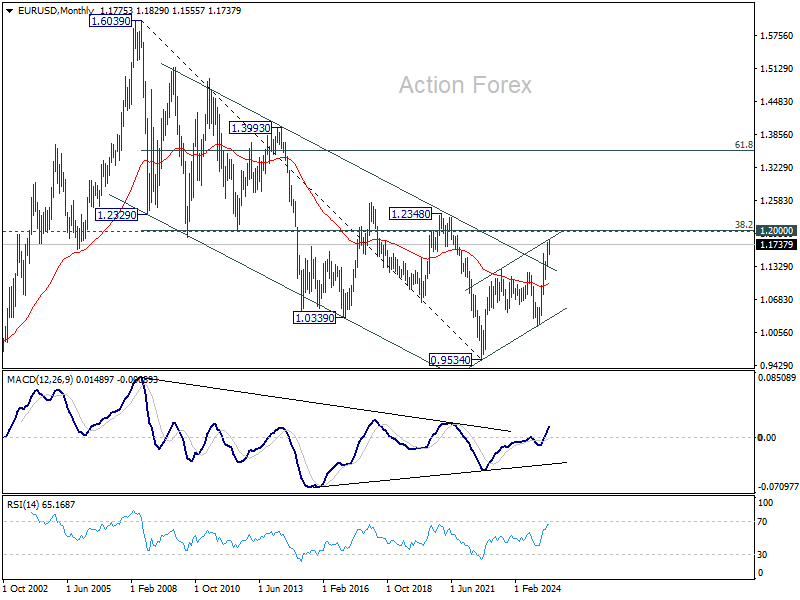
EUR/USD rebounded last week but lost momentum after hitting 1.1788. Initial bias stays neutral this week first. On the upside, above 1.1788 will bring retest of 1.1829. Firm break there will will resume whole rally from 1.0176, and target 1.1916 projection level. However, break of 1.1677 will turn bias to the downside, and extend the corrective pattern from 1.1829 with another falling leg.
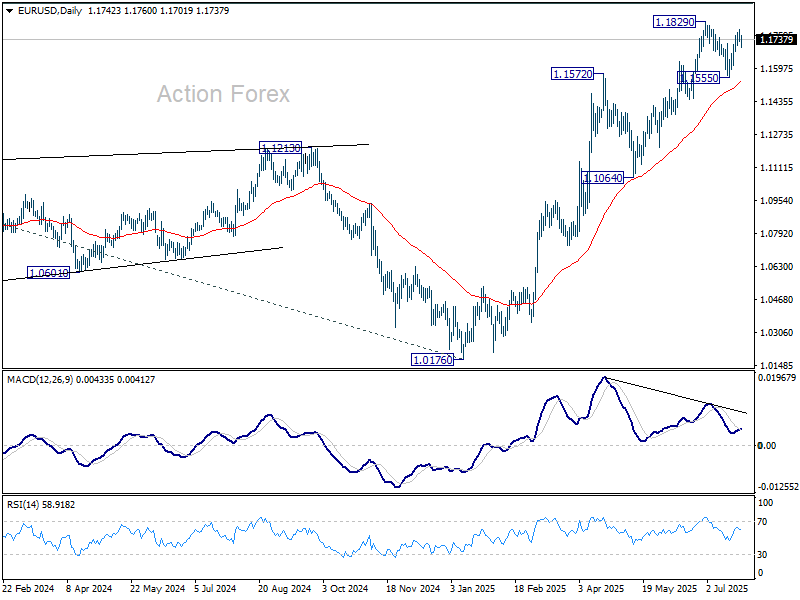
In the bigger picture, rise from 0.9534 long term bottom could be correcting the multi-decade downtrend or the start of a long term up trend. In either case, further rise should be seen to 100% projection of 0.9534 to 1.1274 from 1.0176 at 1.1916. This will remain the favored case as long as 1.1604 support holds.
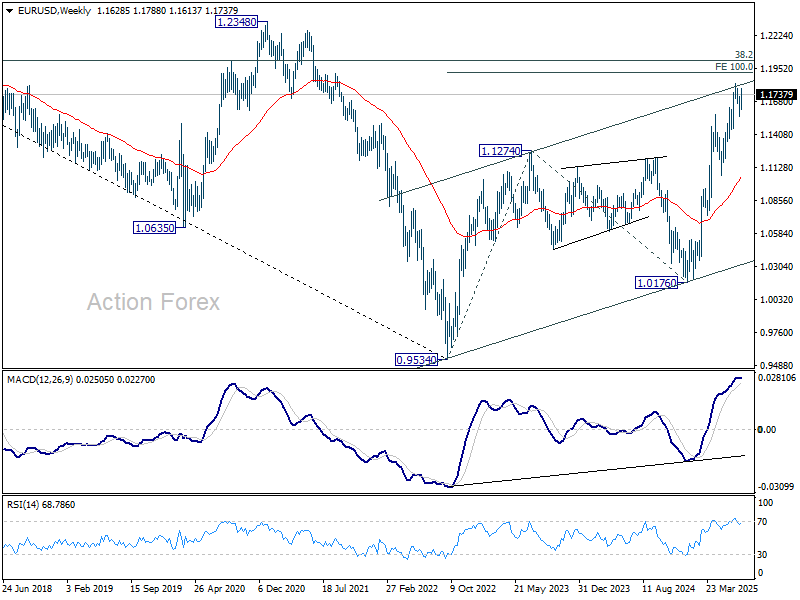
In the long term picture, a long term bottom was in place already at 0.9534, on bullish convergence condition in M MACD. Further rise should be seen to 38.2% retracement of 1.6039 to 0.9534 at 1.2019. Rejection by 1.2019 will keep the price actions from 0.9534 as a corrective pattern. But sustained break of 1.2019 will suggest long term bullish trend reversal, and target 61.8% retracement at 1.3554.
USD/JPY Weekly Outlook
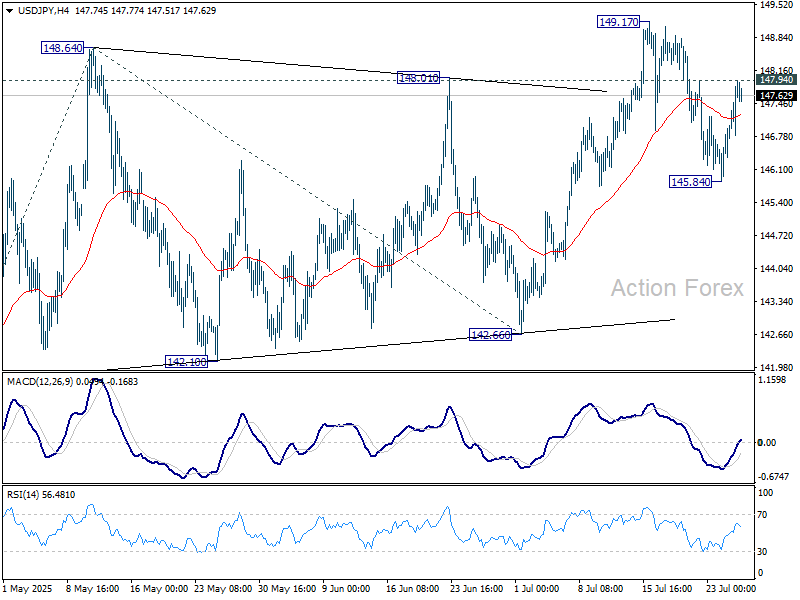
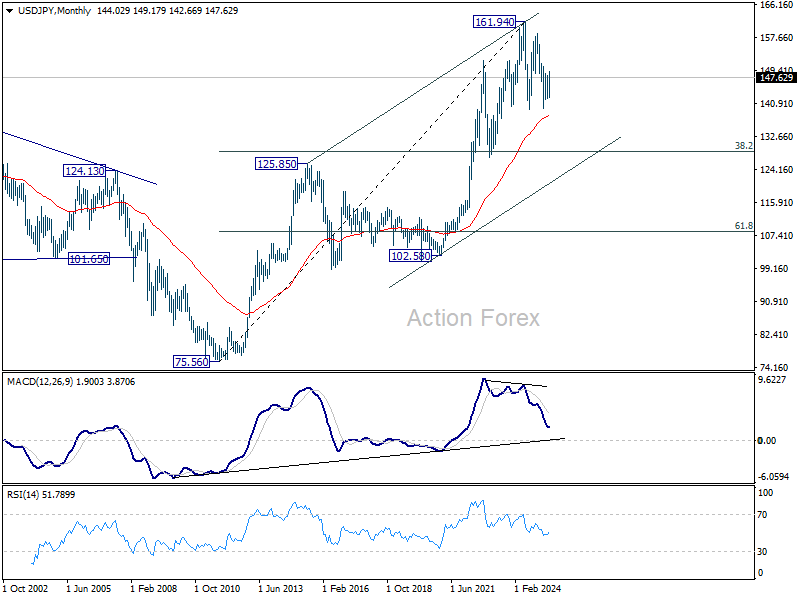
USD/JPY's pullback from 149.17 extended lower last week but recovered after drawing support from 55 D EMA (now at 145.99) and rebounded. Initial bias remains neutral this week and further rise is expected. Above 147.94 minor resistance will bring retest of 149.17 first. Firm break there will target 100% projection of 139.87 to 148.64 from 142.66 at 151.43, which is close to 151.22 fibonacci level.
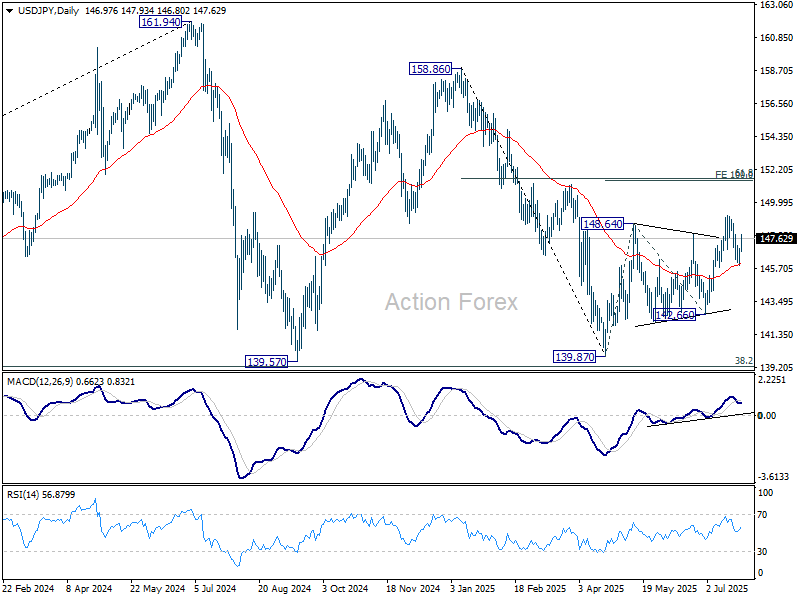
In the bigger picture, price actions from 161.94 (2024 high) are seen as a corrective pattern to rise from 102.58 (2021 low). Decisive break of 61.8% retracement of 158.86 to 139.87 at 151.22 will argue that it has already completed with three waves at 139.87. Larger up trend might then be ready to resume through 161.94 high. In case the corrective pattern extends with another fall, strong support is expected from 38.2% retracement of 102.58 to 161.94 at 139.26 to bring rebound.
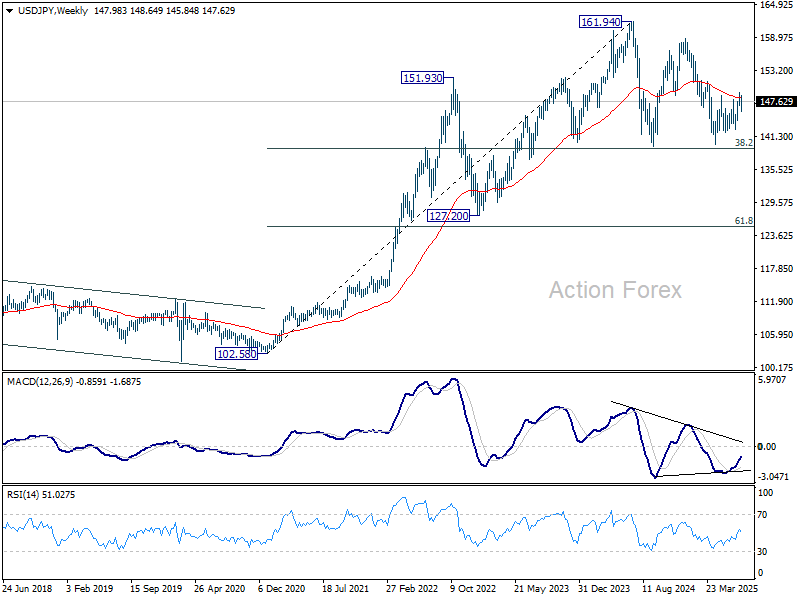
In the long term picture, there is no sign that up trend from 75.56 (2011 low) has completed. But then, firm break of 161.94 is needed to confirm resumption. Otherwise, more medium term range trading could still be seen.
GBP/USD Weekly Outlook
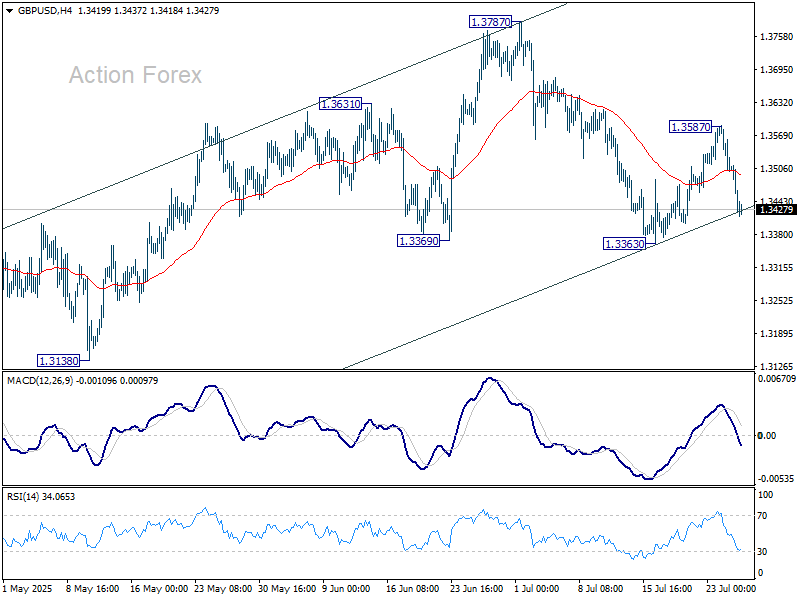
GBP/USD rebounded to 1.3587 last week but reversed from there. Downside is held above 1.3363 support so far. Initial bias stays neutral this week first. On the upside, break of 1.3587 will target a retest on 1.3787 high. However, sustained break of 1.3363 will argue that it's already correcting the whole rally from 1.2099, and target 1.3206 resistance turned support.
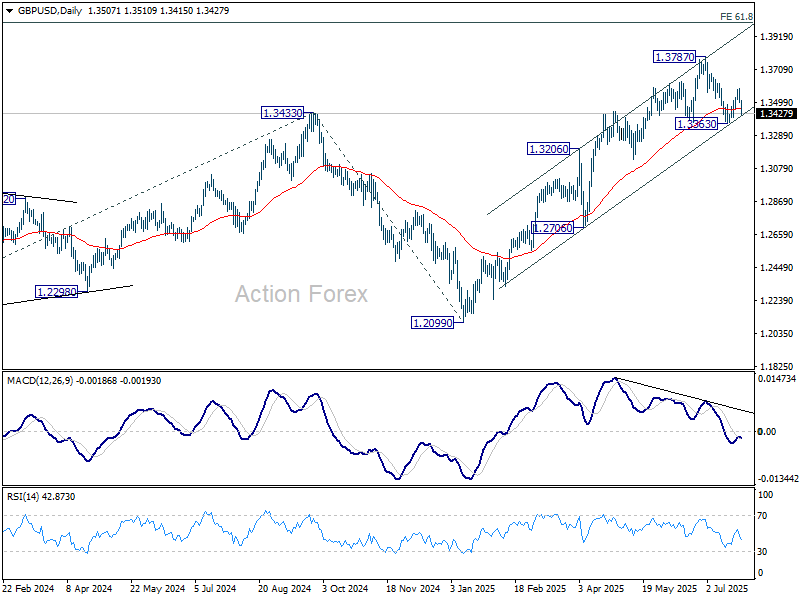
In the bigger picture, up trend from 1.3051 (2022 low) is in progress. Next medium term target is 61.8% projection of 1.0351 to 1.3433 from 1.2099 at 1.4004. Outlook will now stay bullish as long as 55 W EMA (now at 1.3032) holds, even in case of deep pullback.
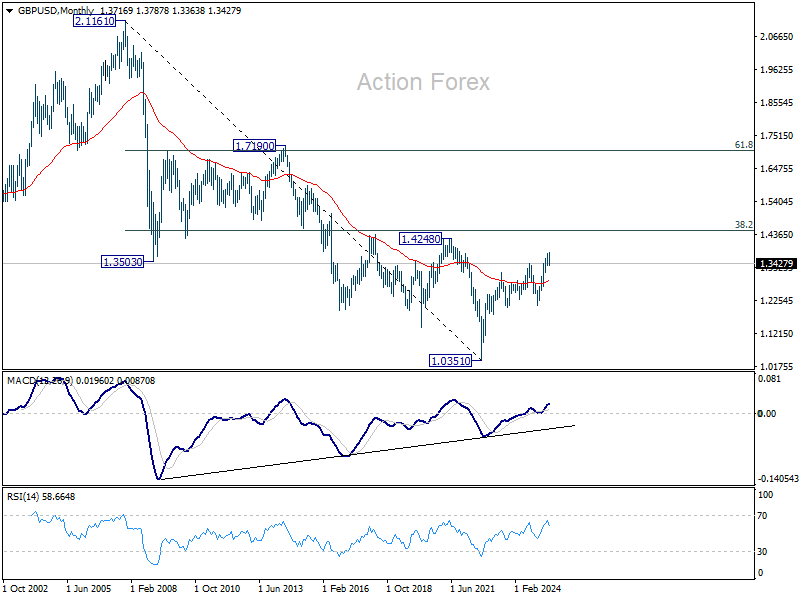
In the long term picture, for now, price actions from 1.0351 (2022 low) are still seen as a corrective pattern to the long term down trend from 2.1161 (2007 high) only. However, firm break of 1.4248 resistance (38.2% retracement of 2.1161 to 1.0351 at 1.4480) will be a strong sign of long term bullish reversal.

USD/CHF Weekly Outlook
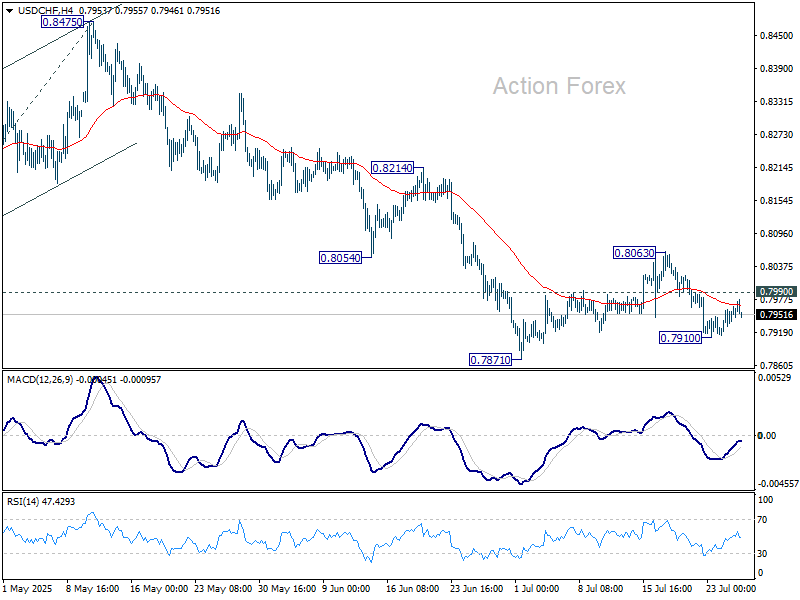
USD/CHF fell to 0.7910 last week but recovered since then. Initial bias remains neutral this week first. On the downside, below 0.7910 will bring retest of 0.7871 low. Firm break there will resume larger down trend and target 61.8% projection of 0.9200 to 0.8038 from 0.8475 at 0.7757. On the upside, break of 0.7990 minor resistance will bring stronger rebound to extend the corrective pattern from 0.7871.
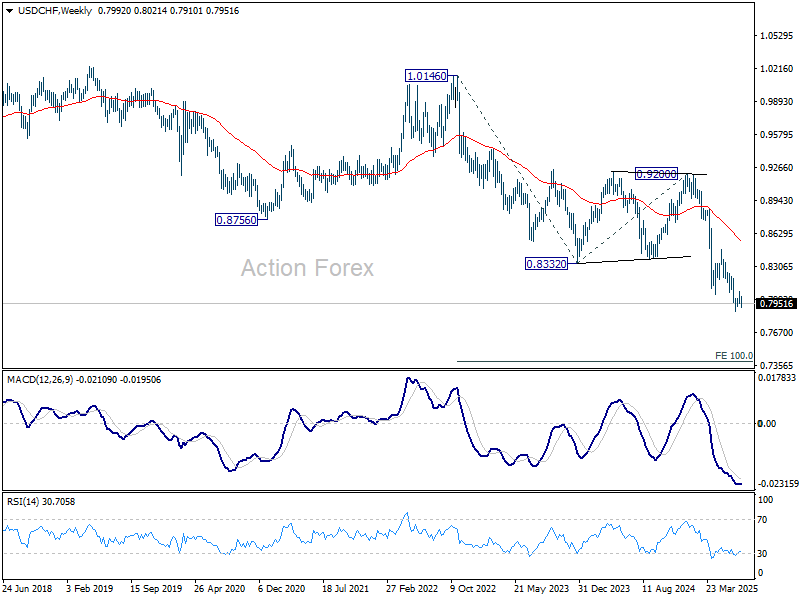
In the bigger picture, long term down trend from 1.0342 (2017 high) is still in progress. Next target is 100% projection of 1.0146 (2022 high) to 0.8332 from 0.9200 at 0.7382. In any case, outlook will stay bearish as long as 0.8475 resistance holds.

In the long term picture, price action from 0.7065 (2011 low) are seen as a corrective pattern to the multi-decade down trend from 1.8305 (2000 high). It's uncertain if the fall from 1.0342 is the second leg of the pattern, or resumption of the down trend. But in either case, outlook will stay bearish as long as 0.9200 resistance holds. Retest of 0.7065 should be seen next.

AUD/USD Weekly Report
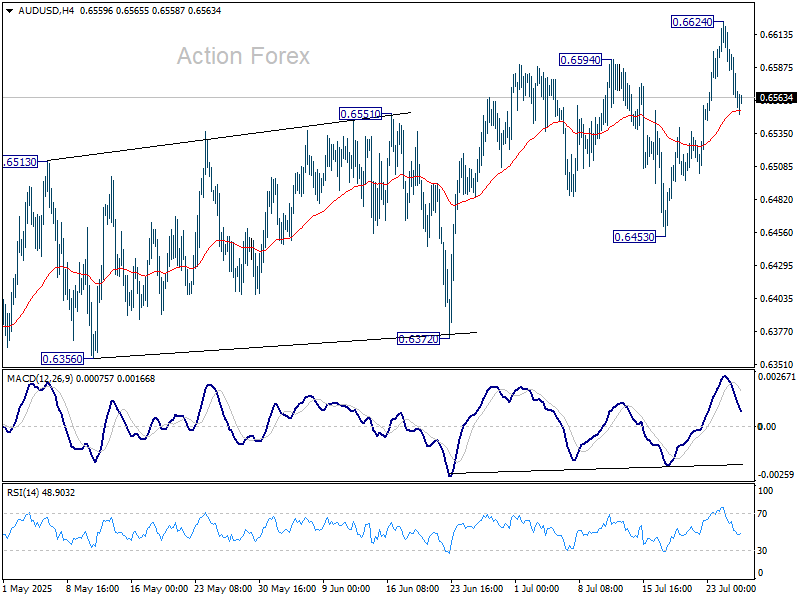
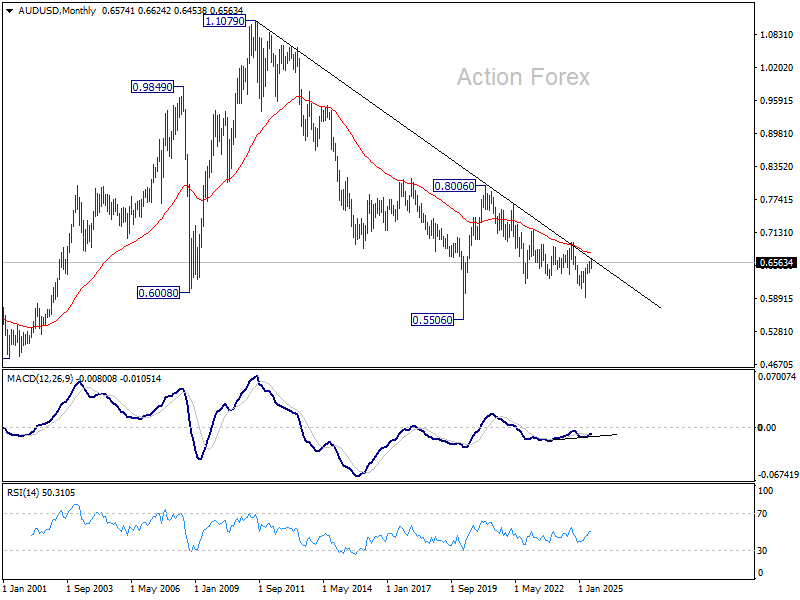
AUD/USD's rise from 0.5913 resumed to 0.6624 last week but retreated once again. Initial bias stays neutral this week first and some more consolidations could be seen. Further rise is expected as long as 0.6453 support holds. Above 0.6624 will turn bias back to the upside. However, considering bearish divergence condition in D MACD, upside should be limited by 0.6713 fibonacci level on next rise.
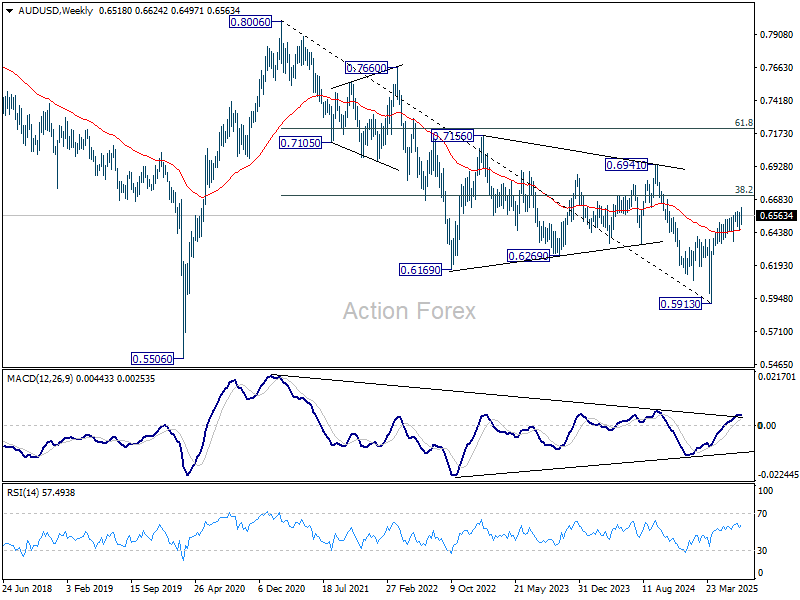
In the bigger picture, there is no clear sign that down trend from 0.8006 (2021 high) has completed. Rebound from 0.5913 is seen as a corrective move. While stronger rally cannot be ruled out, outlook will remain bearish as long as 38.2% retracement of 0.8006 to 0.5913 at 0.6713 holds. Nevertheless, considering bullish convergence condition in W MACD, even in case of another fall through 0.5913, downside should be contained above 0.5506 (2020 low).

In the long term picture, fall from 0.8006 is seen as the second leg of the corrective pattern from 0.5506 long term bottom (2020 low). Hence, in case of deeper decline, strong support should emerge above 0.5506 to contain downside to bring reversal. On the upside, firm break of 0.6941 will argue that the third leg has already started back to 0.8006.
USD/CAD Weekly Outlook
USD/CAD dived to 1.3574 last week but rebounded strongly from there. Initial bias remains neutral this week first. Outlook will stay bearish as long as 1.3773 resistance holds. Break of 1.3574 will argue that consolidation pattern from 1.3538 has completed. And larger fall from 1.4791 is ready to resume through 1.3538. However, firm break of 1.3773 will argue that it's now correcting the whole fall from 1.4791 and target 1.4014 resistance instead.
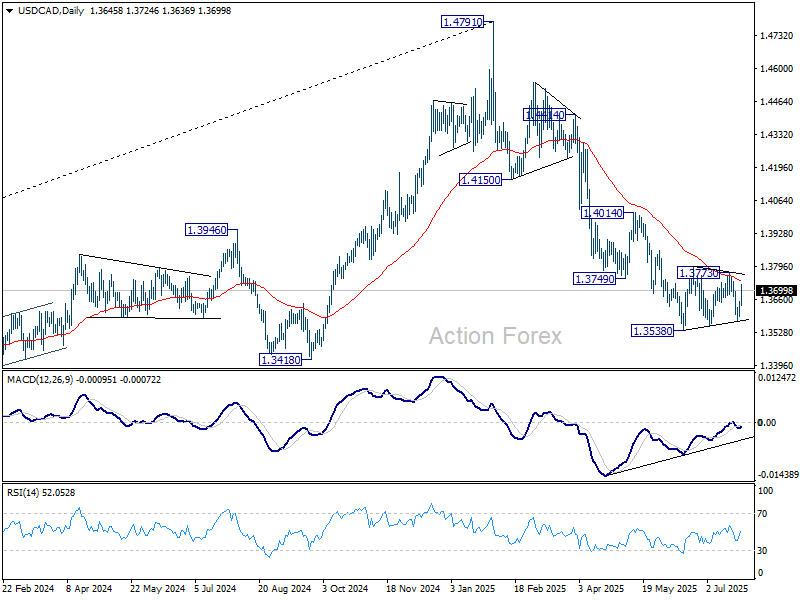
In the bigger picture, price actions from 1.4791 medium term top could either be a correction to rise from 1.2005 (2021 low), or trend reversal. In either case, further decline is expected as long as 1.4014 resistance holds. Next target is 61.8% retracement of 1.2005 (2021 low) to 1.4791 at 1.3069.
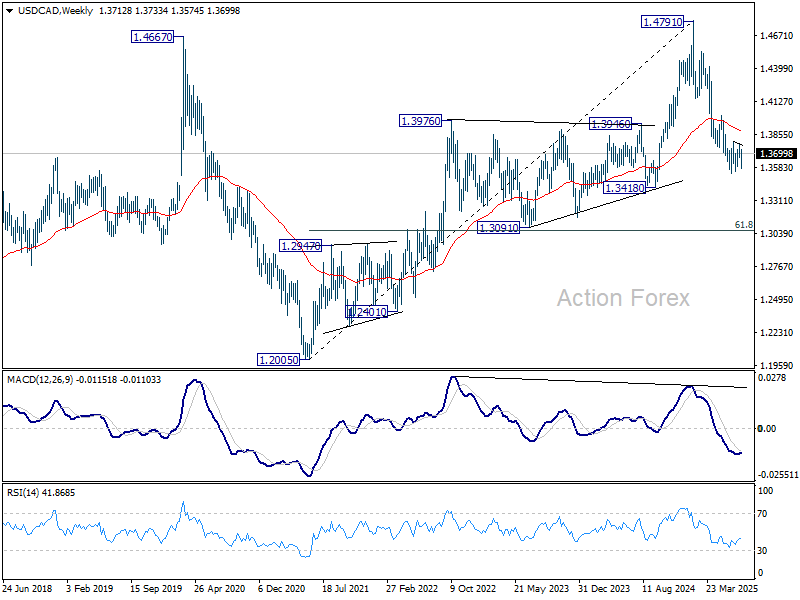
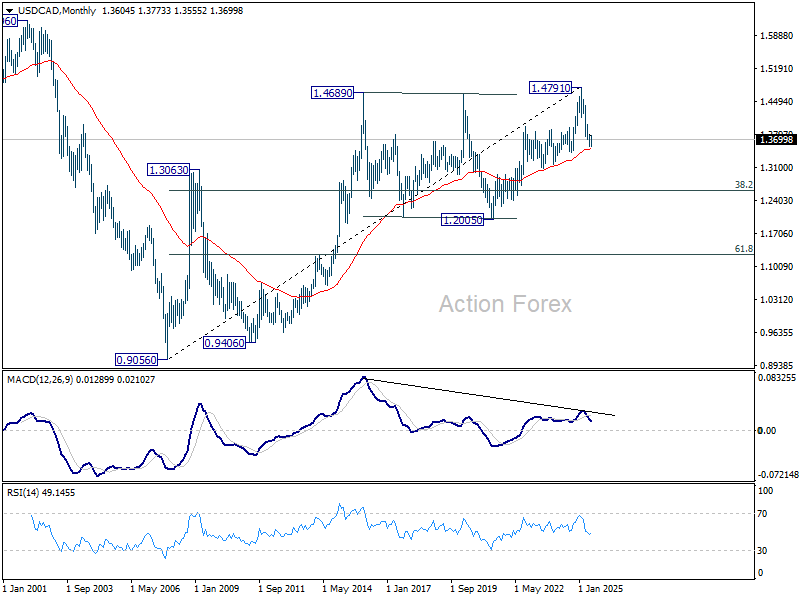
In the long term picture, as long as 55 M EMA (now at 1.3498) holds, up trend from 0.9056 (2007 low) should still resume through 1.4791 at a later stage. However, sustained trading below 55 M EMA will argue that the up trend has already completed, with rise from 1.2005 to 1.4791 as the fifth wave. 1.4791 would then be seen as a long term top and deeper medium term down trend should then follow.
GBP/JPY Weekly Outlook
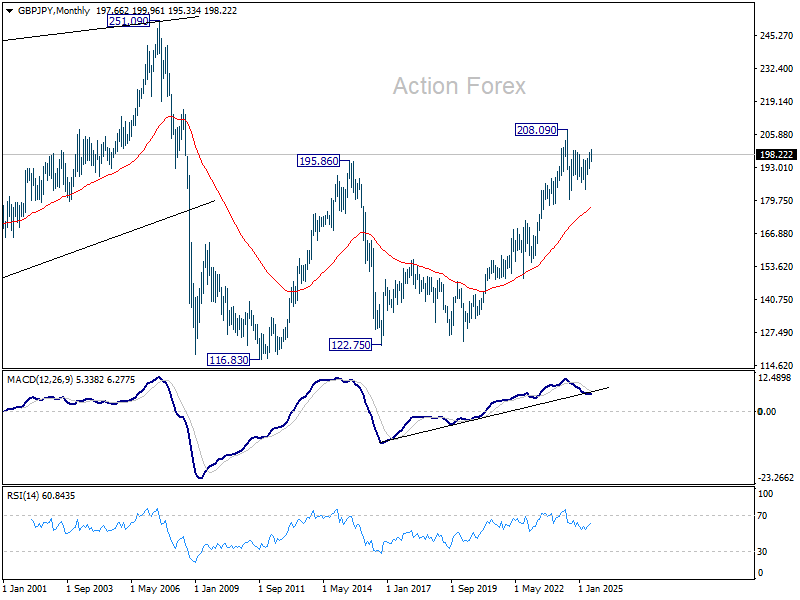
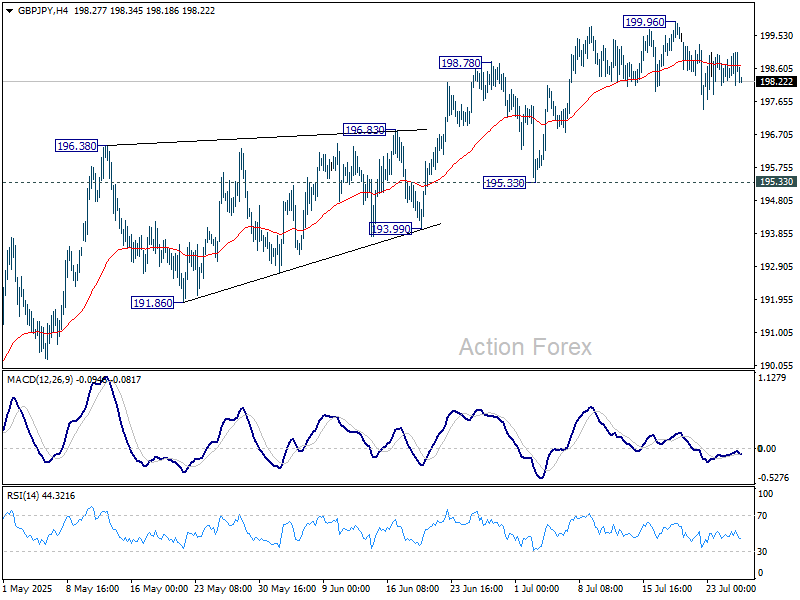
GBP/JPY stayed in range below 199.96 last week and outlook is unchanged. Initial bias remains neutral this week for more consolidations. While deeper pullback might be seen, outlook will stay bullish as long as 195.33 support holds. Break of 199.96 will resume the rise from 184.35 to 100% projection of 180.00 to 199.79 from 184.35 at 204.14.
In the bigger picture, price actions from 208.09 (2024 high) are seen as a correction to rally from 123.94 (2020 low). The pattern might still extend with another falling leg. But in that case, strong support should be seen from 38.2% retracement of 123.94 to 208.09 at 175.94 to contain downside. Meanwhile, decisive break of 208.09 will confirm long term up trend resumption.
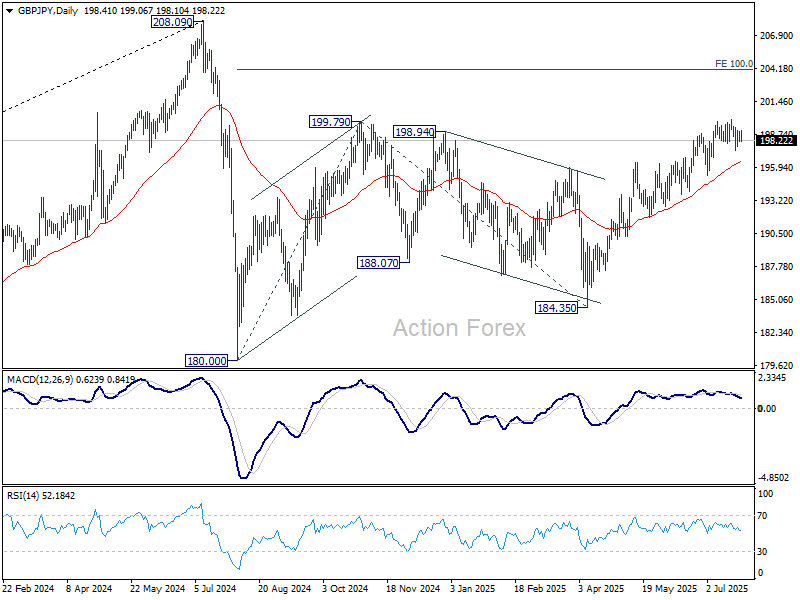
In the long term picture, there is no sign that the long term up trend from 122.75 (2016 low) has concluded. But firm break of 208.09 is needed to confirm resumption. Otherwise, more medium term range trading could still be seen.