Sample Category Title
EUR/AUD Daily Outlook
Daily Pivots: (S1) 1.7811; (P) 1.7856; (R1) 1.7926; More...
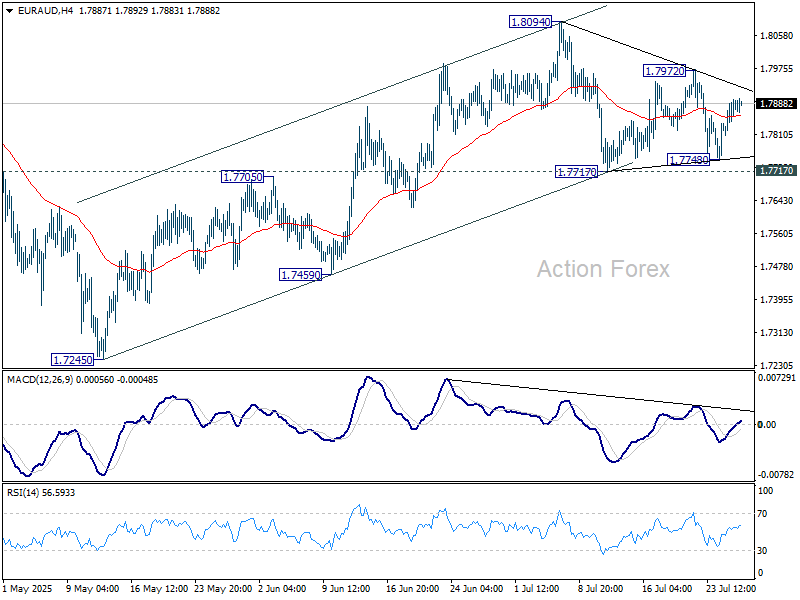
Intraday bias in EUR/AUD remains neutral at this point. With 1.7717 support intact, further rally is expected. On the upside, above 1.7972 will bring retest of 1.8094. Firm break there will resume the rise from 1.7245 to towards 1.8554 high. However, break of 1.7717 support will revive the case that rise from 1.7245 has completed. Corrective pattern from 1.8554 should have then started the third leg.
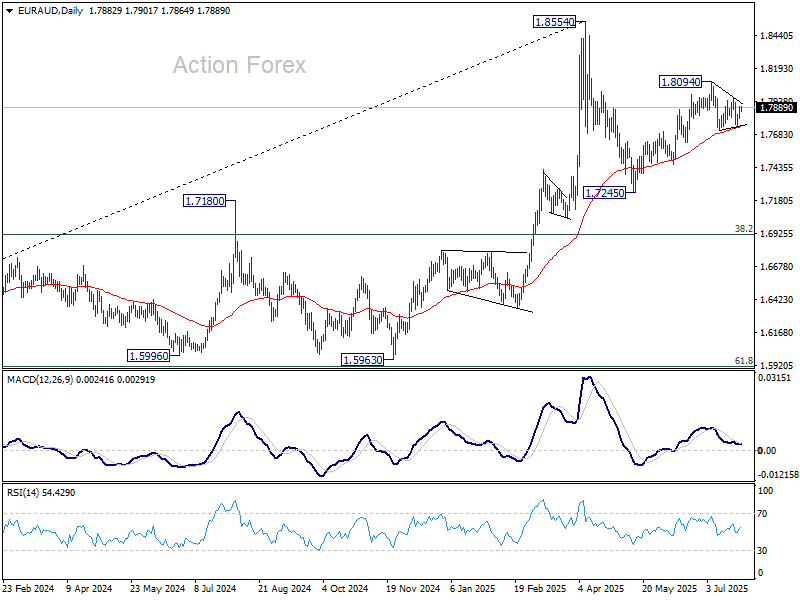
In the bigger picture, price actions from 1.8554 medium term top are seen as a corrective pattern. While deeper pullback might be seen, downside should be contained by 38.2% retracement of 1.4281 (2022 low) to 1.8554 at 1.6922 to bring rebound. Up trend from 1.4281 is expected to resume at a later stage.
EUR/CHF Daily Outlook
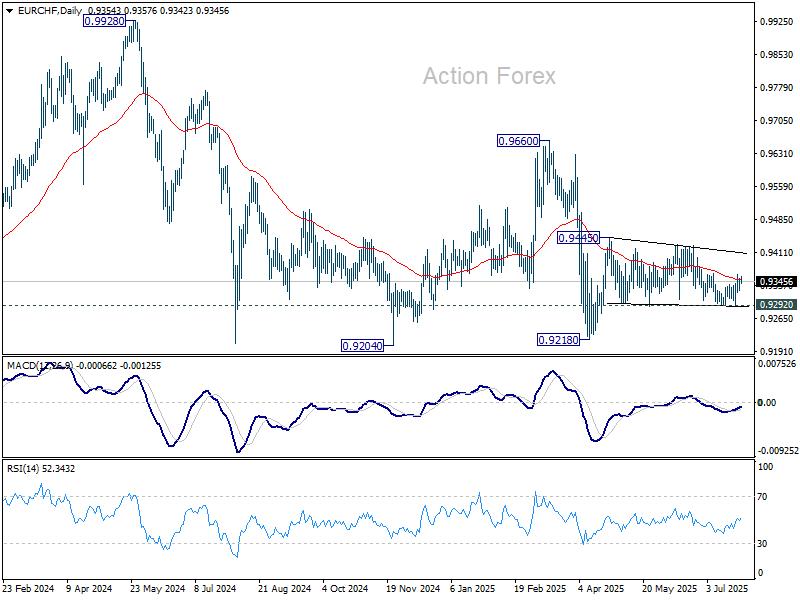
Daily Pivots: (S1) 0.9323; (P) 0.9339; (R1) 0.9349; More....
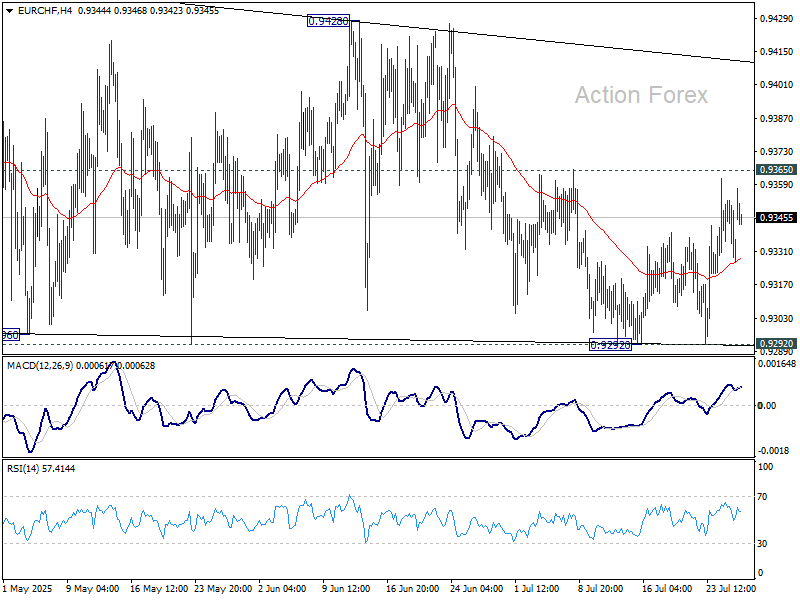
Intraday bias in EUR/CHF remains neutral for the moment. On the upside, firm break of 0.9365 will be the first sign that corrective pattern from 0.9445 has already completed. Further rise should then be seen to 0.9428/45 resistance zone. Firm break there will resume the rebound from 0.9218 low. However, firm break of 0.9292 will bring retest of 0.9218 instead.
In the bigger picture, while downside momentum has been diminishing as seen in W MACD, there is no sign of bottoming yet. EUR/CHF is still staying below 55 W EMA (now at 0.9424) and well inside long term falling channel. Outlook will stay bearish as long as 0.9660 resistance holds. Break of 0.9204 (2024 low) will confirm resumption of down trend from 1.2004 (2018 high).
GBP/JPY Daily Outlook
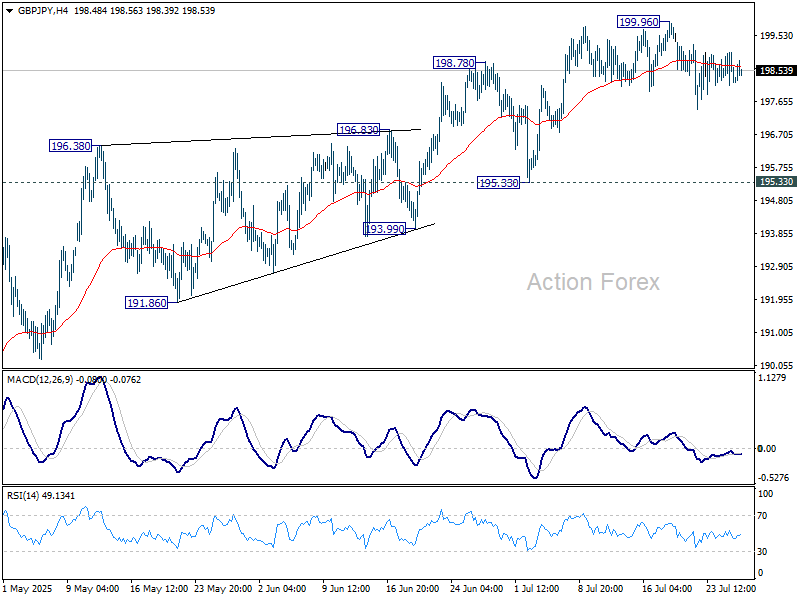
Daily Pivots: (S1) 198.00; (P) 198.55; (R1) 198.95; More...
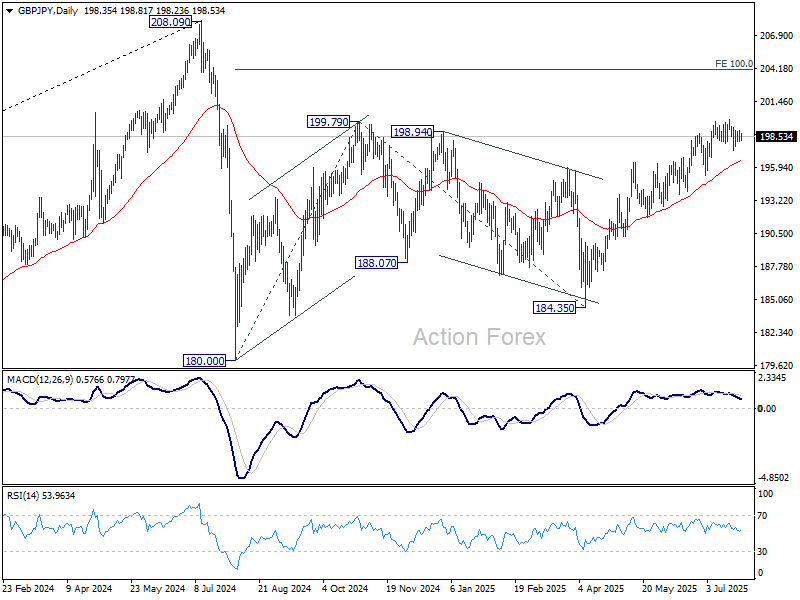
Intraday bias in GBP/JPY remains neutral and more consolidations could be seen below 199.96. While deeper pullback might be seen, outlook will stay bullish as long as 195.33 support holds. On the upside, break of 199.96 will resume the rise from 184.35 to 100% projection of 180.00 to 199.79 from 184.35 at 204.14.
In the bigger picture, price actions from 208.09 (2024 high) are seen as a correction to rally from 123.94 (2020 low). The pattern might still extend with another falling leg. But in that case, strong support should be seen from 38.2% retracement of 123.94 to 208.09 at 175.94 to contain downside. Meanwhile, decisive break of 208.09 will confirm long term up trend resumption.
EUR/JPY Daily Outlook
Daily Pivots: (S1) 172.67; (P) 173.14; (R1) 173.81; More...
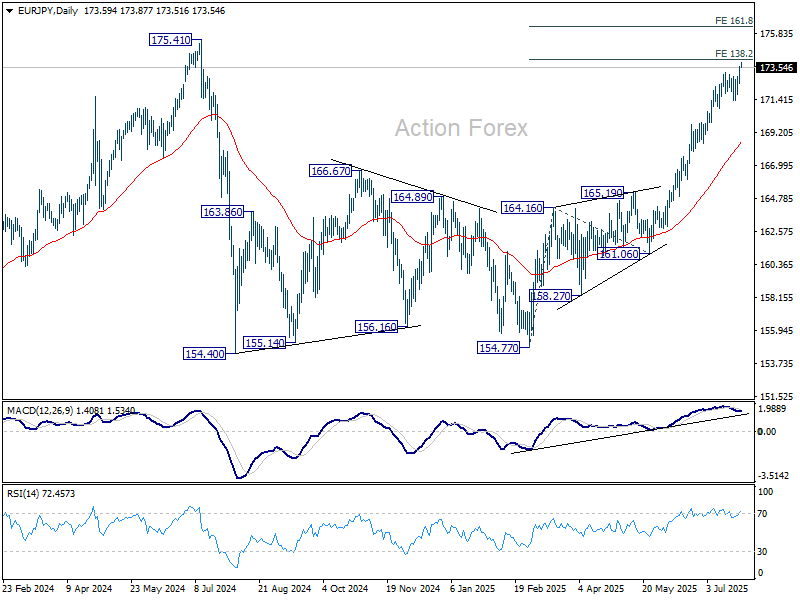
EUR/JPY's rally continues today and intraday bias remains on the upside. Immediate focus is on 138.2% projection of 154.77 to 164.16 from 161.06 at 174.03. Break there will bring retest of 175.41 high. For now, near term outlook will remain bullish as long as 171.35 support holds, in case of retreat.
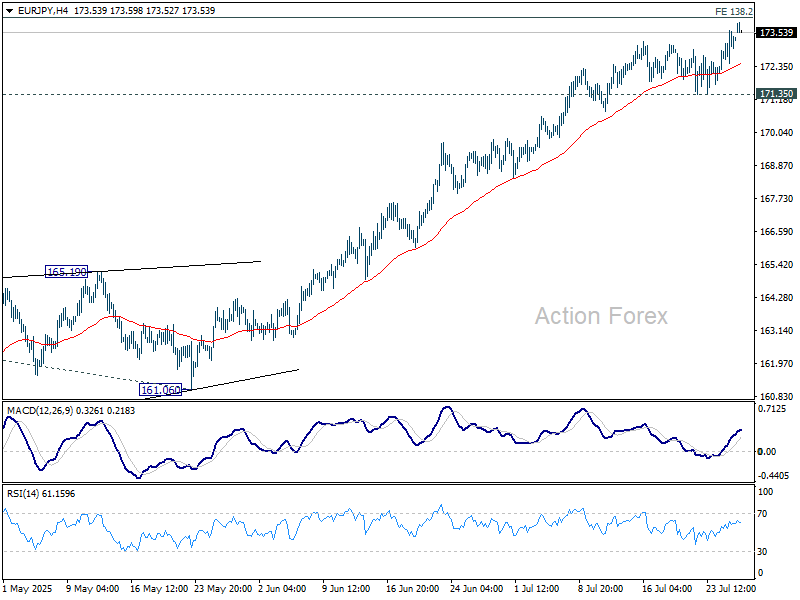
In the bigger picture, considering current strong momentum as seen in the rally from 154.77, corrective pattern from 175.41 could have already completed. Decisive break there will confirm long term up trend resumption. Next target is 61.8% projection of 124.37 to 175.41 from 154.77 at 186.31. However, rejection by 175.41, followed by firm break of 55 D EMA (now at 168.56) will delay this bullish case.
Euro Supported by Trade Deal, Eyes Turn to US-China Talks
Markets opened the week in a risk-on mood as trade developments filled the void left by a barren economic calendar. Euro gained broadly following the announcement of the US–EU framework agreement over the weekend, although upside momentum remained modest. The deal eased tariff threats and highlighted strategic cooperation, including major European energy purchases from the US.
Aussie and Kiwi also posted gains, supported by improving sentiment. In contrast, Dollar, Yen, and Swiss Franc were weaker across the board—a clear sign of waning demand for defensive assets. Loonie and Sterling were little changed, trading in the middle.
The broader market awaits a heavy slate of events later in the week, including monetary policy decisions from Fed, BoC, and BoJ. On the data front, traders will monitor GDP and inflation figures out of the US, Eurozone, Australia, and China for macro signals heading into August.
Nevertheless, immediate focus will shift to Stockholm first, where US and Chinese negotiators meet today into determine whether their fragile tariff truce can be extended beyond the looming August 12 deadline. Treasury Secretary Scott Bessent and Vice Premier He Lifeng lead the talks, which could set the tone for a possible Trump–Xi summit later this year.
Bessent has already suggested that the US is willing to delay tariff reimposition if talks progress. However, Beijing is expected to press for deeper cuts to the layered US tariffs, now totaling 55% on most Chinese goods, and for relaxation of technology export restrictions.
Parallel to the Stockholm dialogue, South Korea is reported to be pursuing an ambitious “Make American Shipbuilding Great Again” proposal to avoid the 25% US tariff. Officials from Seoul are in talks with the US this week, seeking to finalize a deal before Trump’s August 1 deadline. A cooperative framework on shipbuilding is being discussed as the centerpiece.
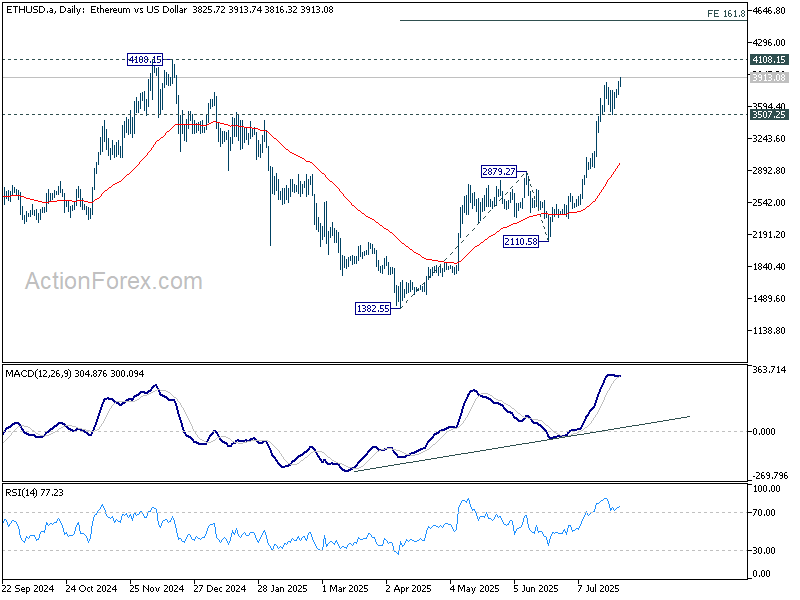
Technically, Ethereum's up trend resumed today and breaks above 3900 mark. Near term outlook will now stay bullish as long as 3507.25 support holds. Next target is 4108.15 high. Firm break there will target 161.8% projection of 1382.55 to 28179.27 from 2110.58 at 4532.27.
In Asia, at the time of writing, Nikkei is down -1.06%. Hong Kong HSI is up 0.53%. China Shanghai SSE is flat. Singapore Strait Times is down -0.24%. Japan 10-year JGB yield is down -0.04 at 1.565.
US-EU trade deal delivers Relief, Euro gains but lacks breakout momentum
In a significant breakthrough, the US and EU reached a framework trade agreement on Sunday, averting the imposition of 30% tariffs on European imports. Instead, a reduced 15% rate will apply to most goods. The two sides also agreed to exempt key strategic sectors—such as aircraft, chemicals, and some pharmaceuticals—from any tariffs entirely.
The deal also includes sweeping commitments from the EU, including USD 750B in US energy purchases and USD 600 billion in fresh US-bound investment over current levels.
EU Commission President Ursula von der Leyen called the agreement a win for “stability and predictability,” while acknowledging that the 15% tariff still presents challenges for European automakers. Meanwhile, the EU’s pivot toward US nuclear fuel and LNG also marks a decisive shift away from Russian energy dependency.
US President Donald Trump declared the deal as larger than last week's USD 550B Japan agreement and reiterated that it would significantly deepen US-EU ties across energy, defense, and trade. He claimed “hundreds of billions” in arms sales could follow.
Euro advanced broadly on the announcement, but momentum is restrained. EUR/CHF is still capped below 0.9365 resistance despite today's bounce. Firm break of this level is needed to be the first sign that consolidation pattern from 0.9445 has completed, and the rally from 0.9218 is ready to resume. Otherwise, more sideway trading would likely follow first.

Fed, BoC and BoJ to hold, as data wave hits global markets
A busy week lies ahead, packed with three central bank decisions and critical macro data. Fed, BoC and BoJ are all due to announce policy decisions, while top-tier reports on growth and inflation from the US, Eurozone, Australia, and China will shape investor expectations heading into August.
Fed is widely expected to leave interest rates unchanged at 4.25–4.50%. The key intrigue lies in whether dovish-leaning governors Christopher Waller and Michelle Bowman will formalize their views by voting for a cut, and if others on the FOMC might join them.
Futures markets are pricing in around a 65% chance of a September cut. However, Chair Powell is unlikely to pre-commit or even give any concrete guidance. Instead, traders' focus will turn to Q2 GDP advance and June PCE inflation report. July’s non-farm payrolls and ISM manufacturing data will soon follow, giving markets ample fodder to reassess the Fed outlook.
BoC is similarly expected to hold rates at 2.75%, pausing for a third time in this cycle. Earlier fears of deep recession from US tariff escalation have eased, as CUSMA exemptions ensure most Canadian exports remain duty-free.
On the other hand, Canadian inflation has surprised to the upside, challenging assumptions that weak demand would lead to faster disinflation. The BoC’s cautious stance reflects the need to see clearer signs of core inflation cooling before taking further steps.
Market consensus still leans dovish. A Reuters poll found that nearly two-thirds of economists expect a BoC cut in September, with most seeing at least two total reductions in 2025.
BoJ is also set to hold steady at 0.50%, but its outlook is evolving. Deputy Governor Uchida sounded notably upbeat last week, pointing to diminished uncertainty and stronger prospects for achieving sustained 2% inflation following the US–Japan trade pact.
BoJ will factor the trade deal into its quarterly projections this week, potentially teeing up policy tightening later in the year.
Beyond central banks, attention will also turn to Eurozone GDP and CPI, Australia's CPI and retail sales, and China’s PMIs for additional global growth signals.
Here are some highlights for the week:
- Tuesday: US goods trade balance, house price index, consumer confidence.
- Wednesday: New Zealand ANZ business confidence; Australia CPI; Eurozone GDP; Swiss KOF; US ADP employment, GDP advance, FOMC rate decision; BoC rate decision.
- Thursday: Japan industrial production, retail sales, BoJ rate decision; Australia retail sales; China NBS PMIs; Germany CPI flash, unemployment; Eurozone unemployment rate; Canada GDP; US personal income and spending, PCE inflation, Chicago PMI.
- Friday: Japan unemployment rate, PMI manufacturing final; Australia PPI; China Caixin PMI manufacturing; Eurozone PMI manufacturing final, CPI flash; UK PMI manufacturing final; US non-farm payrolls, ISM manufacturing.
EUR/JPY Daily Outlook
Daily Pivots: (S1) 172.67; (P) 173.14; (R1) 173.81; More...
EUR/JPY's rally continues today and intraday bias remains on the upside. Immediate focus is on 138.2% projection of 154.77 to 164.16 from 161.06 at 174.03. Break there will bring retest of 175.41 high. For now, near term outlook will remain bullish as long as 171.35 support holds, in case of retreat.
In the bigger picture, considering current strong momentum as seen in the rally from 154.77, corrective pattern from 175.41 could have already completed. Decisive break there will confirm long term up trend resumption. Next target is 61.8% projection of 124.37 to 175.41 from 154.77 at 186.31. However, rejection by 175.41, followed by firm break of 55 D EMA (now at 168.56) will delay this bullish case.
EUR/USD Regains Momentum But Can It Continue Higher?
Key Highlights
- EUR/USD started a fresh increase above the 1.1680 resistance zone.
- It cleared a key bearish trend line with resistance at 1.1660 on the 4-hour chart.
- GBP/USD is struggling to clear the 1.3520 and 1.3550 resistance levels.
- USD/JPY started a fresh increase above the 147.50 level.
EUR/USD Technical Analysis
The Euro formed a base above the 1.1550 level against the US Dollar. EUR/USD started a fresh increase above the 1.1660 and 1.1700 resistance levels.
Looking at the 4-hour chart, the pair settled above the 1.1700 level, the 100 simple moving average (red, 4-hour), and the 200 simple moving average (green, 4-hour). There was a clear move above the 50% Fib retracement level of the downward move from the 1.1829 swing high to the 1.1565 low.
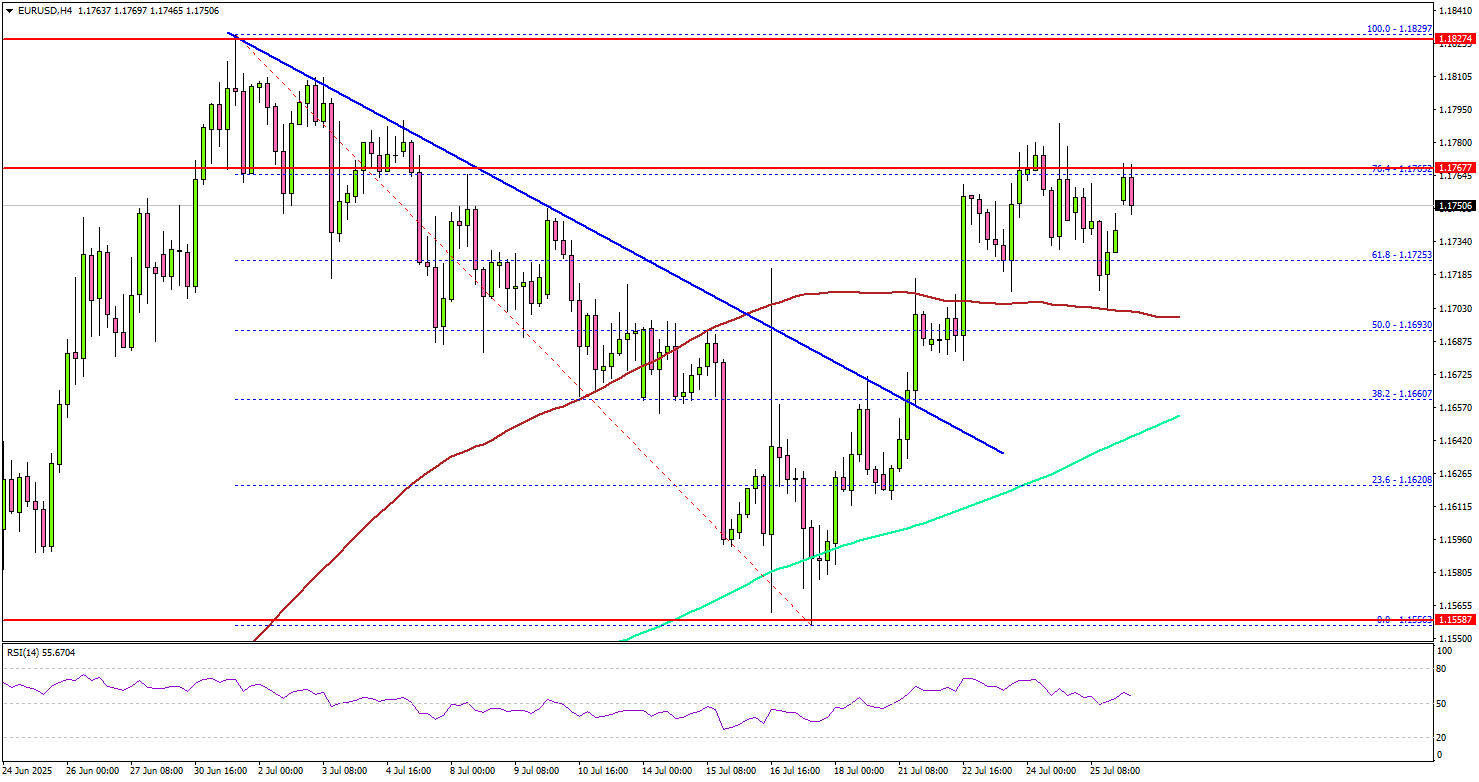
On the upside, the pair now faces resistance near the 1.1765 level. It is close to the 76.4% Fib retracement level of the downward move from the 1.1829 swing high to the 1.1565 low.
The next key resistance sits near the 1.1800 level. A close above the 1.1800 level could set the pace for another increase. In the stated case, the pair could rise toward the 1.1840 resistance. The next major stop for the bulls could be near the 1.1880 resistance.
On the downside, immediate support is near the 1.1700 level and the 100 simple moving average (red, 4-hour). The next key support sits near 1.1660. Any more losses could send the pair toward the 1.1620 support zone.
Looking at GBP/USD, the pair is showing bearish signs and might decline below the 1.3420 support zone.
Upcoming Economic Events:
- Dallas Fed Manufacturing Business Index for July 2025 – Forecast -12.0, versus -12.7 previous.
Japan Deal Fuels Rally Before Fed and BoJ Policy Updates
The big news last week was a surprise trade deal between the U.S. and Japan. The agreement will lower proposed tariffs on Japanese imports from 25% to 15%. This helped boost Japanese stocks, especially car companies, and pushed U.S. stock markets to record highs. Strong earnings from U.S. companies also supported the rally.
Investor mood was positive overall, with hopes that the U.S. might make similar deals with other countries. Economic data was mixed—U.S. services PMI was better than expected, but manufacturing was weaker as companies adjust to higher import costs. In Japan, inflation slowed slightly to 2.9%, down from 3.1% in June.
The U.S. dollar fell early in the week but recovered as traders now think rate cuts may be delayed. Gold rose at first due to trade worries, but dropped after the Japan deal was announced. Bitcoin stayed mostly flat, holding on to gains from earlier weeks.
Markets This Week
U.S. Stocks
The Dow Jones rose slightly last week to reach new record highs, helped by the U.S.–Japan trade deal and hopes for more agreements before the August 1 deadline. Calmer relations between President Trump and Fed Chair Powell also supported market sentiment. However, the Dow’s uptrend is weaker than the S&P 500 and Nasdaq, suggesting short-term range trading is likely. With many key events ahead this week, reacting to news will be important. The medium-term outlook remains positive, and buying on dips continues to be a good strategy. Key support levels are at 44,000, 43,000, and 42,000, while resistance is seen at 45,000, 45,100, and 45,500.
Japanese Stocks
Japanese equities came under pressure early last week after the ruling party performed poorly in the national election, raising expectations that the Prime Minister might step down. However, markets quickly reversed after a surprise U.S.–Japan trade deal was announced. While details were limited, the news was seen as very positive and helped the Nikkei 225 surge above 40,000円, nearing record highs. In the short term, the index appears overbought and may face a pullback in the coming week. However, the trade deal supports a positive medium-term outlook, and buying on weakness near the 40,000円 support level could be a favorable strategy. Resistance is now seen at 42,000円, 42,500円, and 43,000円, while support is at 40,000円, 39,000円, and 38,000円.
USD/JPY
USD/JPY started the week weaker as selling pressure emerged near the May highs, a key resistance area. However, the surprise U.S.–Japan trade deal boosted overall market sentiment and pushed U.S. long-term interest rates higher, helping USD/JPY recover to finish the week nearly unchanged. Looking ahead, this week is critical with both the U.S. Federal Reserve and the Bank of Japan holding policy meetings. While the Bank of Japan has signaled possible rate hikes later this year—which is typically negative for USD/JPY—the pair remains stuck in a range in both the short and medium term. Resistance is now seen at 148 and 149, with support at 146 and 145.
Gold
Gold moved higher at the start of last week, testing key resistance levels from May and June as markets grew concerned the U.S. might finalize major trade deals ahead of the August 1 deadline. However, the surprise announcement of the U.S.–Japan trade agreement eased those concerns, leading to a quick pullback and leaving gold prices nearly unchanged by the end of the week. Despite the short-term dip, gold remains well supported in the medium term, and buying on weakness continues to be the preferred strategy. In the short term, range trading is likely to continue, with resistance at $3,400 and $3,450, and support at $3,300 and $3,250.
Crude Oil
Crude oil traded slightly lower in a narrow range last week, as traders looked for fresh signals to guide the next big move. Prices initially rose on the back of the U.S.–Japan trade deal, but the rally faded, and crude ended the week near its lows. Price action is turning increasingly bearish, with the 10-day moving average now pointing down. In the short term, focusing on selling opportunities appears to be the better strategy. Key levels remain unchanged, with resistance at $70, $75, and $80, and support holding at $65 and $60.
Bitcoin
Bitcoin traded lower last week as profit-taking set in following its recent strong rally. However, support at $115,000 held firmly, with continued backing from the U.S. government helping to keep sentiment positive. In the short term, range trading looks like the best approach, as the 10-day moving average is now moving sideways. Medium-term, the outlook remains bullish, with higher levels still likely. Resistance is seen at $125,000 and $150,000, while support lies at $115,000, $110,000, and $105,000.
This Week’s Focus
- Tuesday: U.S. CB Consumer Confidence, U.S. JOLTS Job Openings
- Wednesday: Australia CPI, E.U. GDP, U.S. GDP, U.S. FOMC
- Thursday: China Manufacturing PMI, Japan Bank of Japan Monetary Policy Statement, E.U, Unemployment Rate, U.S. Core PCE Price Index, U.S. Chicago PMI
- Friday: Australia PPI, E.U. CPI, U.S. Nonfarm Payrolls, U.S. ISM Manufacturing PMI, U.S. Michigan Consumer Sentiment
This week could bring big moves in the markets, with several important events happening. The U.S. Federal Reserve and the Bank of Japan will both meet to decide on interest rates. They are expected to keep rates the same, so traders will focus on what the central banks say about future plans—especially when the U.S. might cut rates and when Japan might raise them.
The most important data comes on Friday with the U.S. jobs report. Before that, markets will also watch for any news about trade talks, especially between the U.S. and Japan, ahead of the August 1 tariff deadline. These events could cause sharp price changes across global markets.
US-EU trade deal delivers Relief, Euro gains but lacks breakout momentum
In a significant breakthrough, the US and EU reached a framework trade agreement on Sunday, averting the imposition of 30% tariffs on European imports. Instead, a reduced 15% rate will apply to most goods. The two sides also agreed to exempt key strategic sectors—such as aircraft, chemicals, and some pharmaceuticals—from any tariffs entirely.
The deal also includes sweeping commitments from the EU, including USD 750B in US energy purchases and USD 600 billion in fresh US-bound investment over current levels.
EU Commission President Ursula von der Leyen called the agreement a win for “stability and predictability,” while acknowledging that the 15% tariff still presents challenges for European automakers. Meanwhile, the EU’s pivot toward US nuclear fuel and LNG also marks a decisive shift away from Russian energy dependency.
US President Donald Trump declared the deal as larger than last week's USD 550B Japan agreement and reiterated that it would significantly deepen US-EU ties across energy, defense, and trade. He claimed “hundreds of billions” in arms sales could follow.
Euro advanced broadly on the announcement, but momentum is restrained. EUR/CHF is still capped below 0.9365 resistance despite today's bounce. Firm break of this level is needed to be the first sign that consolidation pattern from 0.9445 has completed, and the rally from 0.9218 is ready to resume. Otherwise, more sideway trading would likely follow first.
Why RBA’s Job is Only Going to Get Harder
The RBA’s focus is now, rightly, on preserving recent success by ensuring at-target inflation is sustained and the gains in the labour market are retained. However, this may prove difficult.
- The huge expansion in Australia’s public demand has supported the labour market more than it has added to inflation, allowing the RBA to focus on taming inflation without having to look over its shoulder at a deteriorating labour market.
- The non-market sector (healthcare, education and public administration) has accounted for 95% of the growth in hours worked in the economy over the past two-years. If non-market job creation over this period had instead run at its pre-pandemic pace, the unemployment rate could be up to 1 percentage point higher today.
- However, public demand is forecast to slow and there is a risk the labour market underperforms as a slowdown in non-market job creation packs a bigger punch. Importantly, the slowing in public demand is unlikely to translate into further downward pressure on inflation dynamics, at least not straight away.
- This could materially worsen the short-run trade-off between the RBA’s inflation and full-employment objectives. Instead of a world where the RBA has headroom to attend to one side of its mandate, it could be faced with a scenario where they increasingly clash.
- Meanwhile, the expansion in public demand has altered the economy’s relative sensitivity to fiscal and monetary policy in favour of fiscal policy decisions, leaving the aggregate economy less sensitive to monetary policy.
- The RBA may find itself navigating a more challenging trade-off between its objectives with a less-effective policy tool. This will see the RBA retain policy flexibility and keep policy guidance to a minimum. Given this, expect less consensus in short-term meeting outcomes and a less predictable RBA – as was on display earlier this month.
In the words of RBA Governor Michele Bullock, “Australia has done remarkably well. Who would have said two years ago we would be sitting here now with inflation at 2 something and unemployment at 4.1%. Not many people”. And we would agree with this, Australia has fared better than many comparable countries, even when including the surprise jump in the unemployment rate to 4.3%.
During her Annika Foundation speech, Bullock recognised that much of this success has come from a reversal of earlier supply disruptions. However, this has not been the only factor behind the normalisation of inflation and the resilient labour market . The huge expansion in public sector demand has supported the labour market more than it has added to inflation, allowing the RBA to focus on taming inflation without having to look over its shoulder at a deteriorating labour market.
The RBA’s focus is now, rightly, on preserving this success by ensuring at-target inflation is sustained and the gains in the labour market are retained. However, this may prove difficult.
The RBA will be navigating an unwind in public demand which could materially worsen the short-run trade-off between its inflation and full-employment objectives. Meanwhile, the economy may have become less sensitive to monetary policy, compounding the challenge facing the RBA.
Labour market decoupled from activity
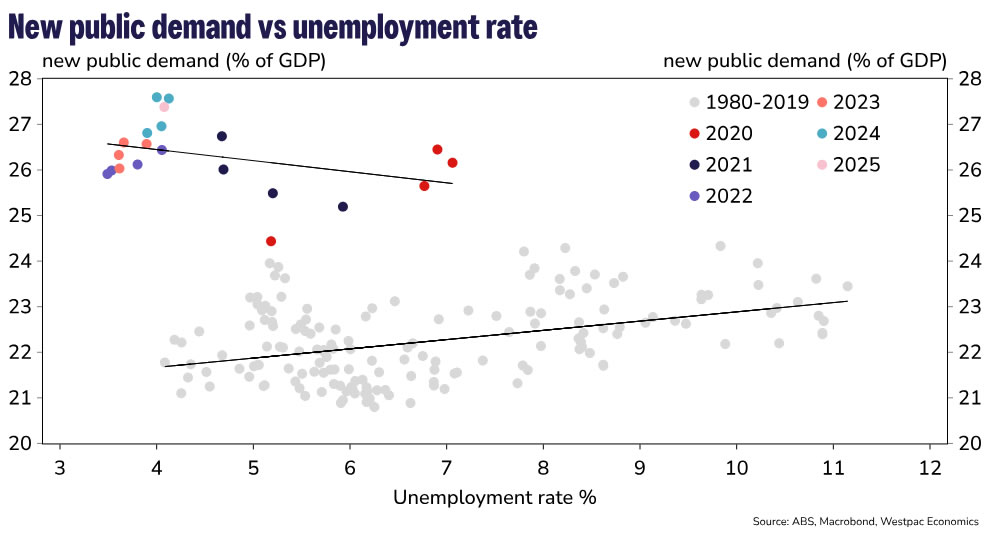
The stronger growth of public demand compared to private demand has been a persistent theme of Australia’s economic activity over recent years. Since the end of 2022 the public sector has expanded at an annualised rate of 4.0%, compared to just 1.5% for the private sector. This has contributed to a rapid surge in public demand as a share of the economy to a record high, a point we have highlighted on several occasions (most recently, here).
The strength of public sector activity has been underpinned by the massive expansion in the care economy and large-scale cost of living support for households and businesses; the latter converted some private-sector consumption, such as on electricity, into public consumption. Meanwhile, soft private sector activity has been centred on weak household consumption more broadly as high inflation, a rising tax take and elevated interest rates weighed on real household incomes. More recently, this weakness has spilled over to business investment outcomes as the boost from surging population growth has gradually faded.
It’s historically very unusual for public demand to be so strong when labour markets are tight. Public demand tends to be counter-cyclical, increasing when the labour market is weak and slowing in the face of capacity constraints. Instead, the strength in public demand, and labour-intensive nature of the care economy, has provided significant support to the labour market as private demand (and hiring) has slowed.
Non-market sector job creation, propelled by the expansion in public demand (particularly in the care economy), has prevented a material increase in unemployment, as would normally be expected given recent weak GDP growth outcomes. In fact, the non-market sector (healthcare, education and public administration), has accounted for 95% of the growth in hours worked in the economy over the past two-years. If non-market job creation over this period had instead run at its pre-pandemic pace, the unemployment rate could be up to 1 percentage point higher today, at 5.25% – back to its pre pandemic level. This scenario assumes an unchanged participation rate and stronger employment growth in the market sector, accounting for around half of the lower non-market employment.
Inflation Impact Has Been Muted
It’s at this stage the economist in the room is quick to point out that strong growth in public demand should put undue upward pressure on inflation and make the RBA’s job more difficult. However, for the most part this has not been the case.
There’s a couple of reasons for this. First, much of the increase in public demand has been an increase and broadening of services provided on behalf of households, such as disability care, childcare, healthcare and aged care. Given these services are largely funded by the government themselves rather than households, they are not measured in the Consumer Price Index (CPI). Marginal increases in demand for these services will add to inflation the government is facing but has less direct impact on consumers.
The impact of rising public demand on measured inflation has also been mitigated by the use of subsidies, which have mechanically reduced headline inflation outcomes in a similar way. The Government temporarily bore part of the burden of higher prices, reducing that faced by the consumer. These subsidies also had second round effects, reducing price gains of those items indexed to headline inflation.
There are some caveats to this. There is little argument that the non-market sector has drawn on resources from the market sector to meet the huge increase in labour demand. This is part of the reason businesses, particularly in sectors where labour is easily substitutable, continue to struggle with labour availability.
Other areas of public demand, such as the massive amount of infrastructure investment across the country are also drawing heavily on capacity in the market sector. Strong employment in the non-market sector has also supported aggregate household income growth, preventing a more significant slowdown in private consumption. These forces have added to inflation outcomes at the margin but are largely second order.
A Purple-Patch for the RBA
Overall, strong public demand has supported the labour market more than it has boosted inflation. This has been a perfect combination for the RBA as it has softened the short-run trade-off between inflation and unemployment (the ‘sacrifice ratio’) and given the Board scope to focus on its inflation objective, without being constrained by the opposite side of its mandate as the economy slowed.
However, the economy is currently in the midst of a transition. Growth in public demand is expected to slow (but remain elevated), and private demand is staging a fragile recovery. Governments are scaling back cost of living support, the care economy expansion is maturing, and thus slowing, and for the states earlier fiscal largesse is meeting the political realities of higher debt servicing costs. Meanwhile, real household incomes are growing again as inflation has returned to target, stage 3 tax cuts have paid-back some recent bracket-creep and now interest rates are on the way down. This is driving a nascent recovery in household consumption and private demand.
From Boon to Burden
As public demand slows, it could flip the economic calculus presented to the RBA. It will be a significant drag on aggregate economic activity, potentially offsetting the fragile recovery in the private sector (most recently discussed here). For the RBA, there is a related risk the labour market underperforms relative to the real economy as a slowdown in non-market sector job creation packs a bigger punch given its (now) much larger concentration. Additionally, the market sector is less labour intensive so any pick-up in market sector activity will create fewer jobs per dollar of GDP.
Importantly, the slowing in public demand is unlikely to translate into further downward pressure on inflation dynamics, at least not straight away. The earlier point that most of the increase in public demand has been in areas that are not captured in the consumer price index, is one reason for this. Another is that private demand is expected to be in the midst of a gentle recovery and dynamics in the private (market) sector are more consequential for inflation. Finally, the roll-off of government subsidies will actually have the opposite impact, mechanically lifting headline inflation outcomes, though this is likely to be deemed transitory to the extent inflation expectations stay put.
The asymmetric impact of slowing public sector growth is a tricky combination for central bankers. Instead of a world where the RBA has headroom to attend to one side of its mandate, the RBA could be faced with a scenario where they increasingly clash. The magnitude of the slowdown in public demand will ultimately dictate how heavily these objectives jar. A more significant slowing in public demand will exacerbate the trade-off for the RBA.
Monetary Policy as a Tool Might be Even More ‘Blunt’
The challenge imposed on the RBA from a worse trade-off between inflation and labour market outcomes is likely to be compounded by the fact that monetary policy will be working on a smaller share of the economy. In other words, the aggregate economy may have become less sensitive to monetary policy.
Slow moving structural changes often play second fiddle to contemporaneous economic dynamics. Economic composition is a prime example and while ‘growing the pie’ is very important, the relative ‘size of the slices’ mustn’t be ignored.
Over the past decade, Australia’s economy has quietly undergone a monumental structural shift, rivalling that of the mining investment boom. After averaging around 22% of the economy from 1975 to 2015, public demand has since exploded to a record 27% of the economy. A five-percentage point shift may not sound like much, but it’s now worth about $33 billion a quarter in real activity and is equivalent to the increase in the mining sector share of the economy during the mining investment boom.
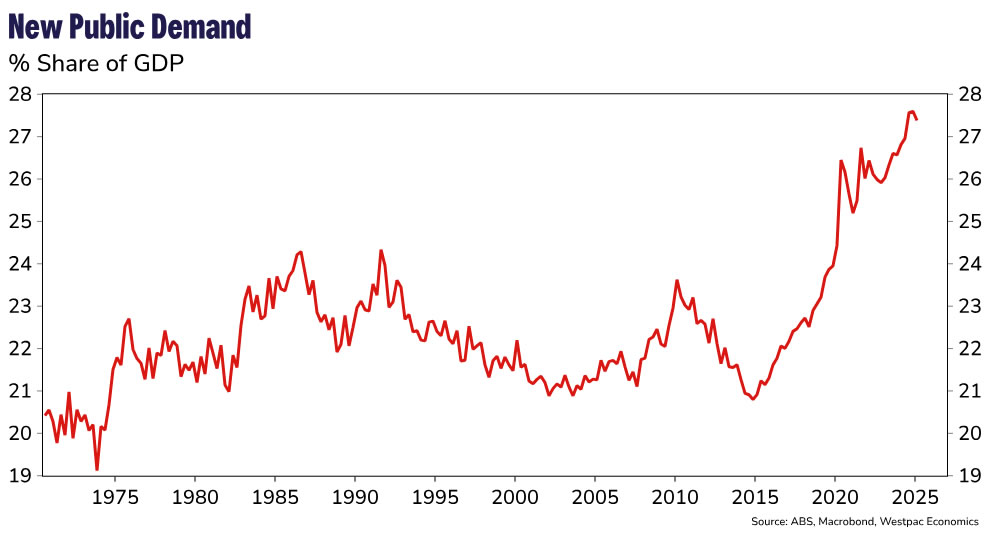
The pandemic certainly had a role to play in this structural change, but it was by no means the only catalyst. This is a trend that was well underway before the pandemic began and has since continued at pace during the aftermath. As flagged earlier, the forces behind this compositional shift are well known: the massive expansion of the care economy, and more recently, large scale cost of living support for households and businesses. Governments are increasingly delivering support to households by purchasing or subsidising goods and services provided to households, rather than using direct income transfers.
Relatively soggy growth in the private sector over the last decade has also played a role in the rising share of public demand. Household consumption and business investment were anaemic in the lead-up to the pandemic, and outside of lockdown induced volatility, have not impressed since.
The implications of this structural change on aggregate productivity outcomes have been an important topic pioneered by my colleague Pat Bustamante here. But there are broader implications outside of productivity that have so far garnered less attention, one prominent example is what it might mean for setting monetary policy.
The RBA has spilled a lot of ink discussing the different transmission channels through which monetary policy influences the economy. But even more fundamental, is the relative size of the parts of the economy that are sensitive to monetary policy. An increase in the relative size of a less interest rate sensitive component of the economy will, at the margin, reduce the sensitivity of the whole economy to monetary policy.
It would be misleading to suggest that public demand is immune to changes in interest rates in the long run. But it’s less sensitive to monetary policy than the private sector, particularly in the context of a once in a generation terms of trade shock that’s temporarily flattered the health of our fiscal position – as is currently the case. Hence, the huge expansion in public demand has altered the economy’s relative sensitivity to fiscal and monetary policy in favour of fiscal policy decisions. (And while the reduced share of income from transfers might have made households more interest-sensitive at the margin, the expansion in public demand has been large enough to more than offset such an effect.)
Conclusion
The RBA may therefore find itself in a position where it is navigating a more challenging trade-off between its objectives with a less-effective policy tool. A larger adjustment in the labour market from slowing public demand and weaker sensitivity of the aggregate economy to monetary policy supports our view that the RBA will ultimately need to provide the economy with more monetary support.
However, the narrower trade-off with inflation will likely see the RBA remain patient in delivering support, favouring its inflation mandate at least until it no longer sees the labour market as being tighter than full employment. This will see the RBA retain policy flexibility, keep policy guidance to a minimum and continue its non-committal tone. Given this, expect less consensus in short-term meeting outcomes and a less predictable RBA – as was on display earlier this month.
S&P 500 Index Wave Analysis
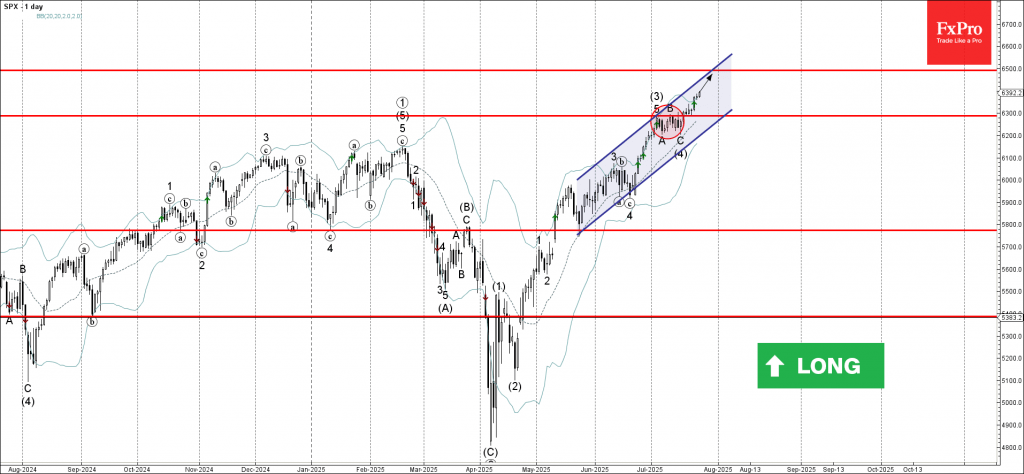
- S&P 500 Index broke key resistance level 6300.00
- Likely to rise to resistance level 6500.00
S&P 500 Index recently broke the key resistance level 6300.00 (which stopped the previous waves 5 and (B), as can be seen below).
The breakout of the resistance level 6300.00 continues the active intermediate impulse wave (5) from the middle of this month.
Given the strong daily uptrend, S&P 500 Index can be expected to rise to the next resistance level 6500.00 (coinciding with the daily up channel from May).