Sample Category Title
Europe and the US Sign Trade Agreement, EUR/USD Declines
The past weekend was marked by the official signing of a trade agreement between the United States and Europe, as announced by US President Donald Trump and President of the European Commission Ursula von der Leyen following their meeting in Scotland.
According to reports, the agreement is based on a 15% baseline tariff on goods exported from Europe to the United States, with certain exemptions. As previously reported, a trade agreement with a 15% baseline tariff had earlier been concluded between the US and Japan.
According to President Trump:
→ under no circumstances did he allow the baseline tariff for Europe to fall below 15%;
→ the European Union committed to investing in the US economy, purchasing weapons, and importing energy resources.
The financial markets’ reaction to this news is noteworthy:
→ European stock indices opened the week with a bullish gap, reflecting relief that previously feared tariffs of up to 30% did not materialise;
→ the EUR/USD pair is exhibiting bearish momentum this morning.
Technical Analysis of the EUR/USD Chart
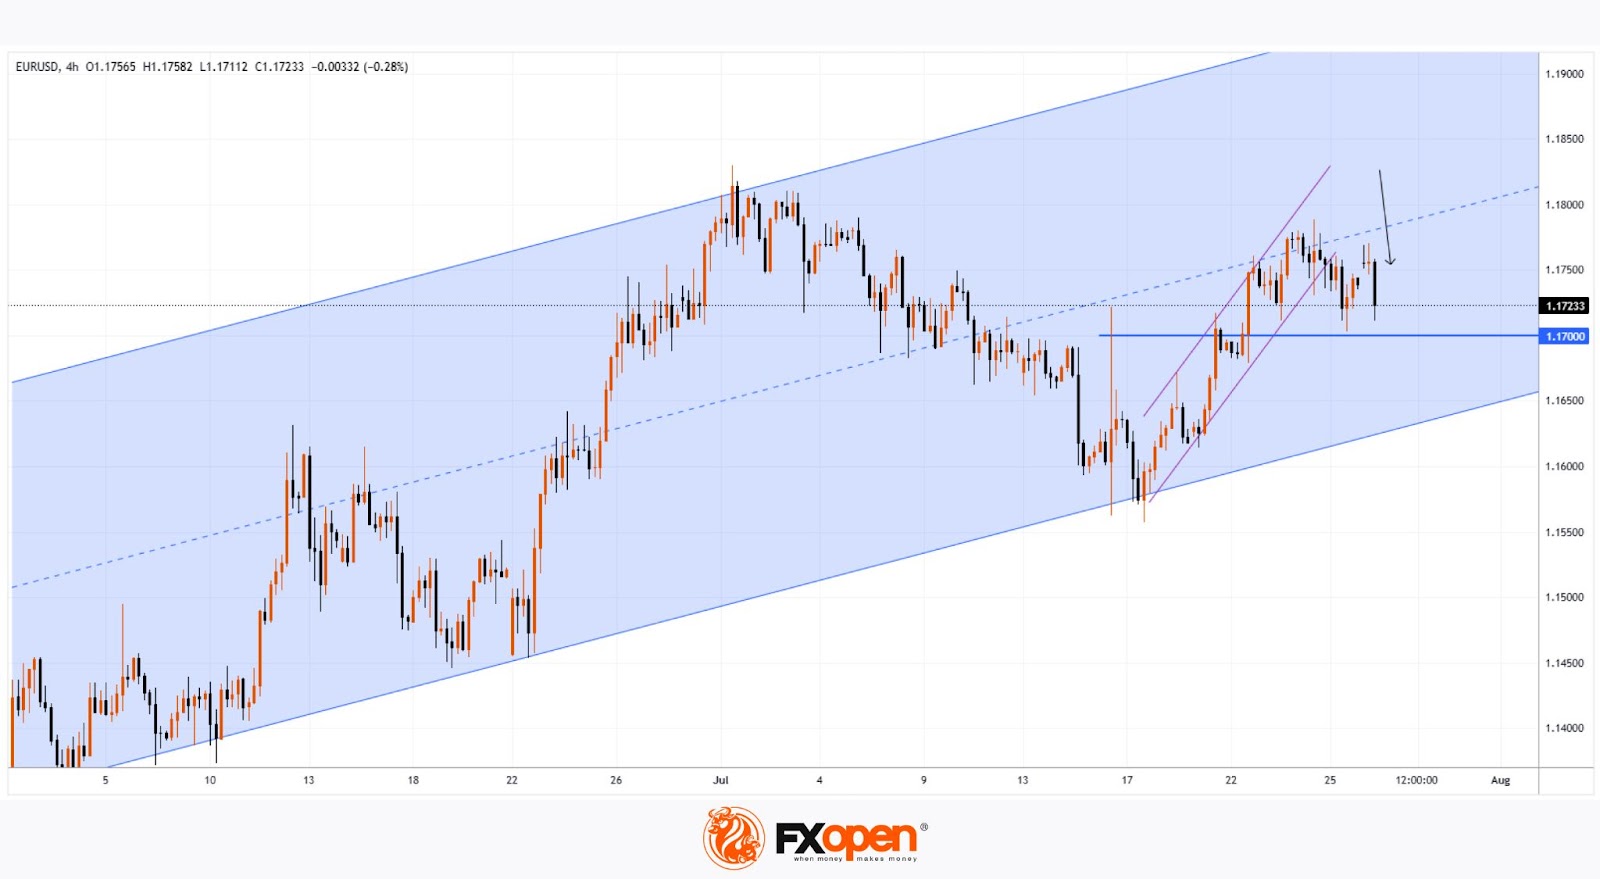
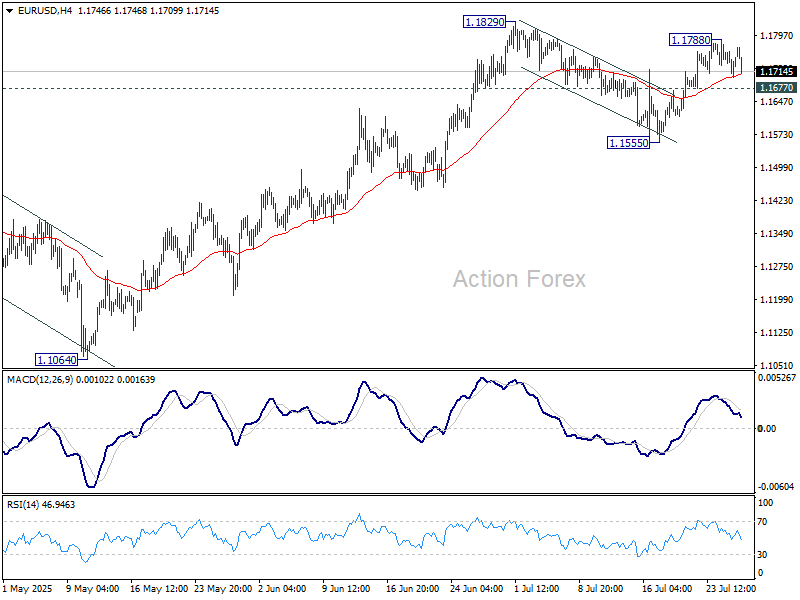
As indicated by the black arrow, bearish sentiment intensified on Monday morning, pushing the pair towards the 1.1700 level, which had previously acted as resistance in mid-July.
From the perspective of the ascending channel (shown in blue), its median line is currently acting as a resistance level – following contact with it, a short-term rally was broken (highlighted in purple). This reinforces the notion that bears are currently in control.
Given the above, we could suggest that, should bearish sentiment persist on the EUR/USD chart, we may soon witness an attempt to break through the 1.1700 support level. A successful breach could open the path for further downside movement of the euro against the dollar, towards the lower boundary of the channel.
Trade over 50 forex markets 24 hours a day with FXOpen. Take advantage of low commissions, deep liquidity, and spreads from 0.0 pips. Open your FXOpen account now or learn more about trading forex with FXOpen.
This article represents the opinion of the Companies operating under the FXOpen brand only. It is not to be construed as an offer, solicitation, or recommendation with respect to products and services provided by the Companies operating under the FXOpen brand, nor is it to be considered financial advice.
Gold and Oil Prices Ease – Market Awaits Fresh Catalysts
Gold price started a fresh decline below $3,380. WTI crude oil is also down and remains at risk of more losses below $64.60.
Important Takeaways for Gold and WTI Crude Oil Prices Analysis Today
- Gold price climbed higher toward the $3,430 zone before there was a sharp decline against the US Dollar.
- A key bearish trend line is forming with resistance near $3,350 on the hourly chart of gold at FXOpen.
- WTI crude oil price continued to decline below the $66.00 support zone.
- It traded below a connecting bullish trend line with support at $65.60 on the hourly chart of XTI/USD at FXOpen.
Gold Price Technical Analysis
On the hourly chart of gold at FXOpen, the price climbed above the $3,380 resistance. The price even spiked above $3,400 before the bears appeared.
A high was formed near $3,432 before there was a fresh decline. There was a move below the $3,380 support level. The bears even pushed the price below the $3,350 support and the 50-hour simple moving average.
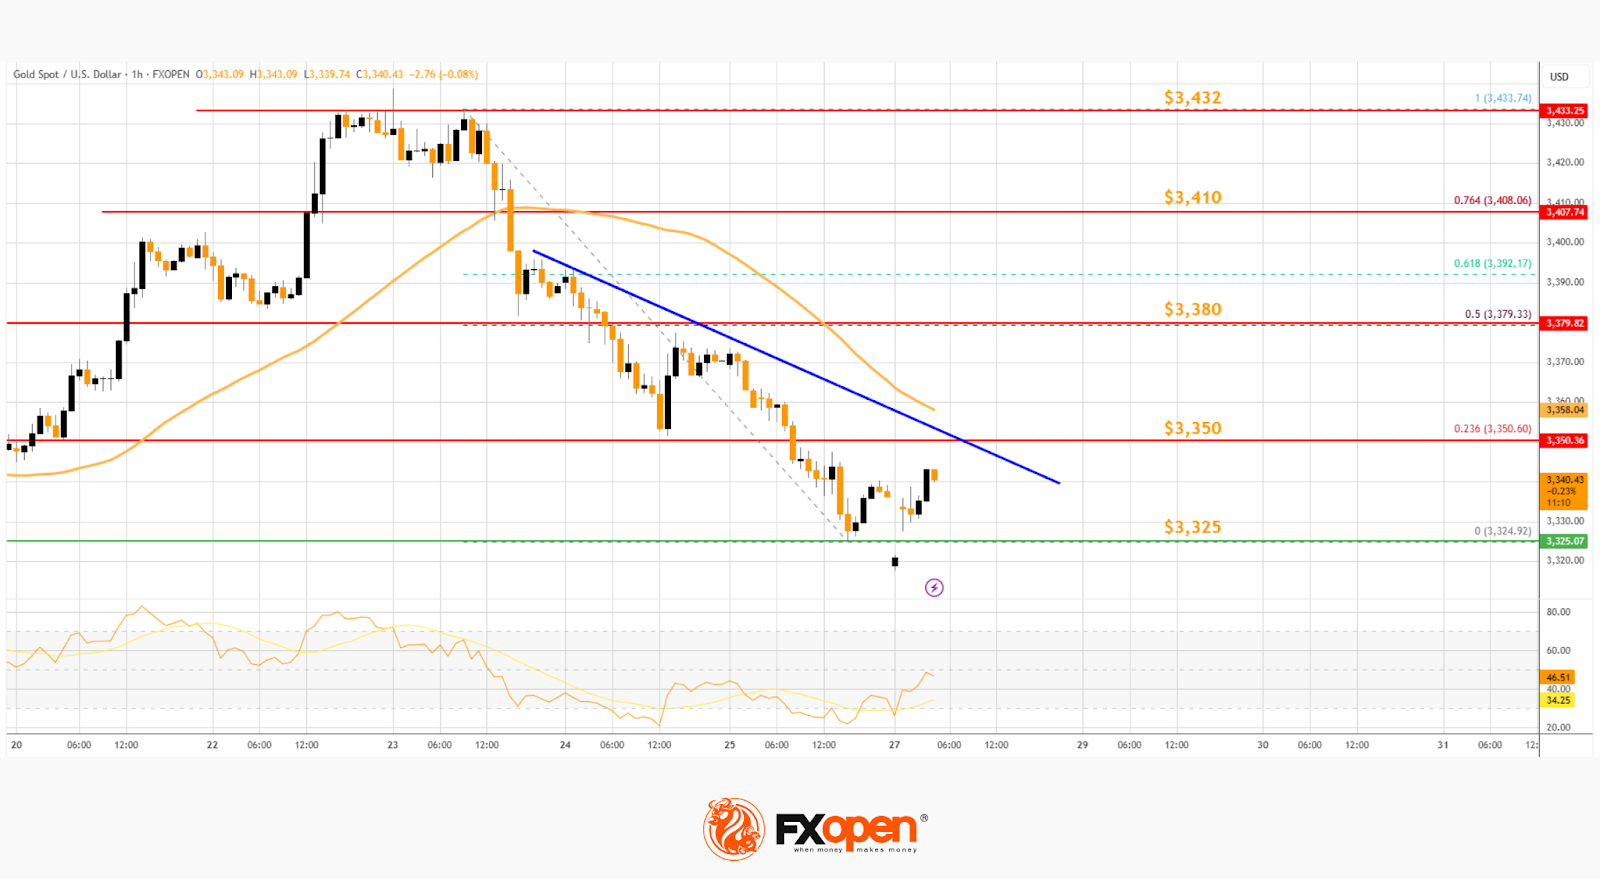
It tested the $3,325 zone. A low was formed near $3,325 and the price is now showing bearish signs. There was a minor recovery wave towards the 23.6% Fib retracement level of the downward move from the $3,433 swing high to the $3,325 low.
However, the bears are active below $3,342. Immediate resistance is near $3,350. There is also a key bearish trend line forming with resistance near $3,350.
The next major resistance is near the $3,380 zone. It is close to the 50% Fib retracement level of the downward move from the $3,433 swing high to the $3,325 low. The main resistance could be $3,410, above which the price could test $3,432. The next major resistance is $3,450.
An upside break above $3,450 could send the gold price towards $3,465. Any more gains may perhaps set the pace for an increase toward the $3,480 level.
Initial support on the downside is near the $3,325 level. The first major support is near the $3,310 level. If there is a downside break below it, the price might decline further. In the stated case, the price might drop towards the $3,265 support.
WTI Crude Oil Price Technical Analysis
On the hourly chart of WTI crude oil at FXOpen, the price struggled to continue higher above $67.50. The price formed a short-term top and started a fresh decline below $66.00.
There was a steady decline below the $65.80 pivot level. The bears even pushed the price below $65.00 and the 50-hour simple moving average. The price traded below a connecting bullish trend line with support at $65.60.
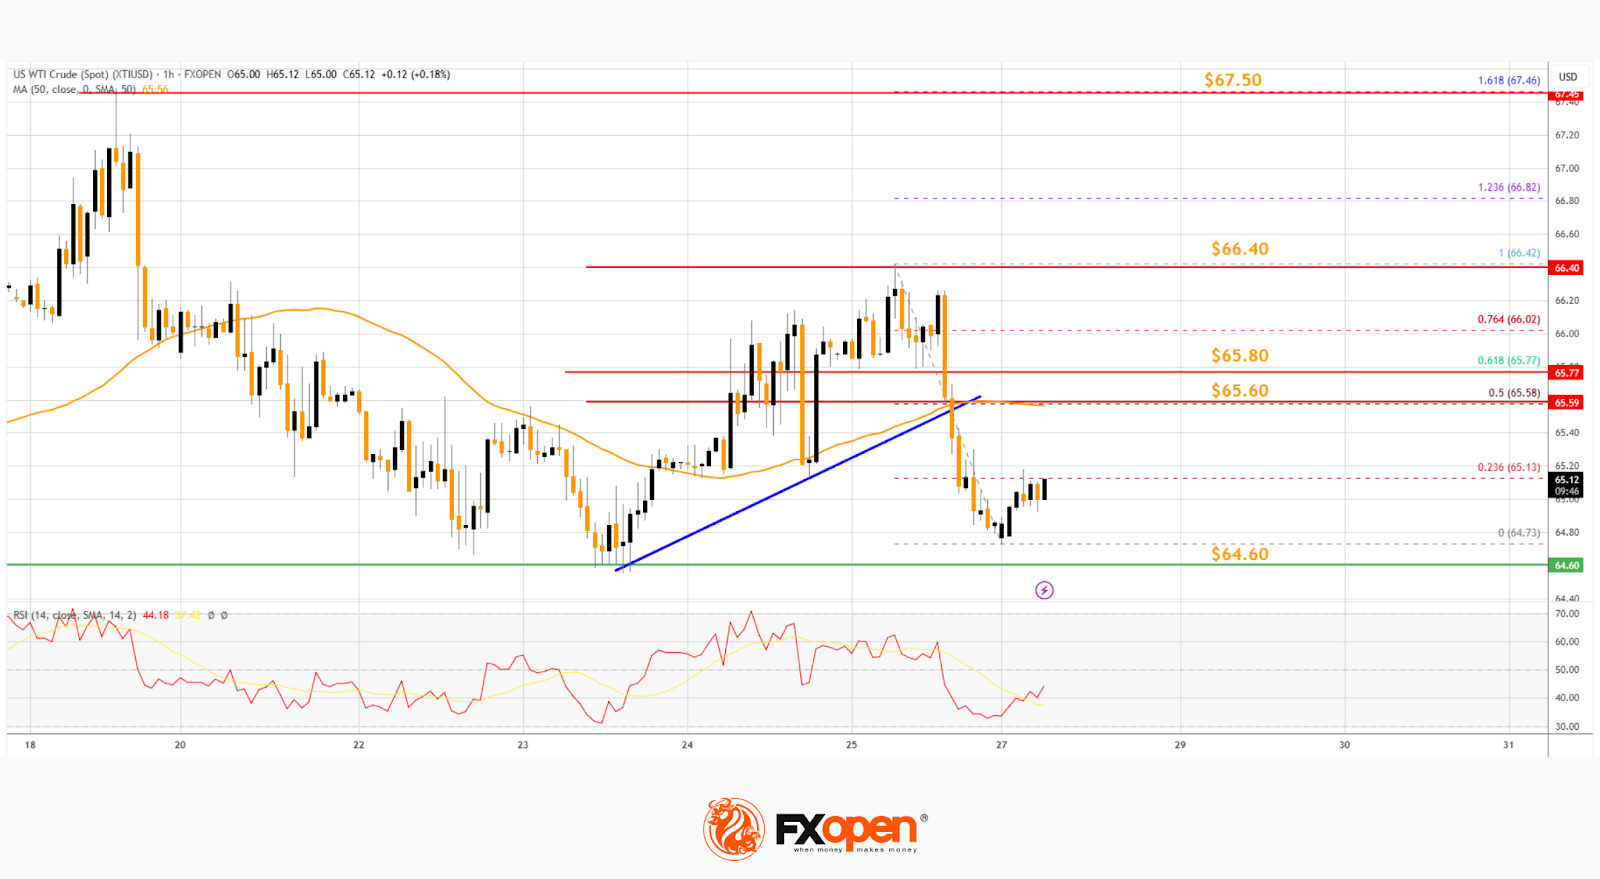
Finally, the price tested the $64.75 zone. The recent swing low was formed near $64.73, and the price is now consolidating losses. On the upside, immediate resistance is near the $65.60 zone. It is close to the 50% Fib retracement level of the downward move from the $66.42 swing high to the $64.73 low.
The main resistance is $65.80. A clear move above it could send the price towards $66.40. The next key resistance is near $67.50. If the price climbs further higher, it could face resistance near $70.00. Any more gains might send the price towards the $72.00 level.
Immediate support is near the $64.60 level. The next major support on the WTI crude oil chart is near $63.20. If there is a downside break, the price might decline towards $60.00. Any more losses may perhaps open the doors for a move toward the $55.00 support zone.
Start trading commodity CFDs with tight spreads. Open your trading account now or learn more about trading commodity CFDs with FXOpen.
This article represents the opinion of the Companies operating under the FXOpen brand only. It is not to be construed as an offer, solicitation, or recommendation with respect to products and services provided by the Companies operating under the FXOpen brand, nor is it to be considered financial advice.
US and European Union Struck a Trade Agreement
Markets
And it’s a deal. The US and European Union struck a trade agreement yesterday, concluding months of back and forth negotiations. Both parties agreed an across-the-board 15% US import levy, covering all goods. That includes cars (which are currently struck by a 27.5% tariff) and according to EC president von der Leyen and senior US officials also semiconductors and pharmaceuticals. US president Trump recently said global tariffs on the latter could be as high as 200% over time after a so-called Section 232 probe comes due over the next three weeks. The 15% does not cover EU’s steel and aluminum, which remain subject to a 50% duty. Securing the 15% instead of the 30% that was set to kick in if no deal was found by August 1 required a buy-in though. The EU agreed to buy $750bn in American energy products over the next three years, to invest $600bn in the US and purchase “a vast amount” of US military equipment. Buying off a lower tariff is also what Japan did with a $550bn investment fund. For now, though, it appears that stocks are the only category actually enjoying the good news. European futures point to a higher open of around 1%+. Bund futures trade weaker (ie. yields to open higher) but are off the intraday lows. We nevertheless believe the weekend breakthrough further strengthened the bottom below European yields, but at the front and the long end of the curve. The euro gapped higher at the Asian open this morning to EUR/USD 1.178 but immediately fell prey to some modest profit-taking. The currency pair is currently back at Friday’s (which, by the way, was an uneventful session) closing level of 1.174. These market moves have an aura of buy the rumour, sell the fact. Speculation was already lingering by end last week of the US and EU nearing an agreement in which the latter was willing to accept a 15% rate. But that doesn’t make it less disappointing that EUR/USD not even came close to the July high of 1.1829. We’ll need confirmation in European and US dealings but it suggests the euro is taking a short-term breather. That also means any potential next upleg in EUR/USD would have to come from dollar weakness. A heavy eco calendar this week at least provides plenty of opportunities. The US update includes JOLTS job openings and consumer confidence tomorrow, Q2 GDP figures and the FOMC decision on Wednesday and the payrolls report on Friday. Several EA member states print growth and inflation numbers over the next days. Trade will remain a critical topic this week, even as the US having secured deals with major trading partners Japan and EU ahead of August 1. Talks with China continue today with a.o. the aim of extending the trade truce beyond the August 12 deadline. Meanwhile, the earnings season rolls into its busiest week (Microsoft, Apple, Amazon and Meta Platforms …).
News & Views
Rating agency Moody’s upgraded Turkey’s credit rating to Ba3 from B1 with a stable outlook. Turkey’s rating is now three notches below investment grade and on par with the ones assigned by Fitch and S&P (both BB-). The upgrade reflects strengthening track record of effective policy making, more specifically in the central bank’s adherence to monetary policy, Moody’s said. That should durably ease inflationary pressures, reduces economic imbalances, and gradually restores local depositor and foreign investor confidence in the Turkish lira. The agency noted a reduced yet still-present risk of policy reversal in the coming years. On a macro level, Moody’s foresees annual inflation to drop to 30% by year’s end and to around 20% by end 2026. GDP growth is expected at 2.2% for this year, below potential growth estimates ranging between 3.5% and 4.5%.
Japan’s top chief negotiator Akazawa said he expects only 1-2% of the recently agreed upon $550bn US fund to be in the form of actual investment, Bloomberg reported. It is on this percentage that investment profits would be split at a 90-10 ratio with the US collecting the larger part. This investment fund was a key pillar in the US-Japanese trade deal concluded last week with which Japan bought off a lower import tariff of 15% (instead of 25%). But being conceptually new, its details remain vague. Akazawa said the bulk of the funds would be dispersed via loans, on which Japan will be earning interest payments, and through loan guarantees, on which – if nothing happens – it will be collecting fees.
EUR/USD Daily Outlook
Daily Pivots: (S1) 1.1710; (P) 1.1735; (R1) 1.1768; More...
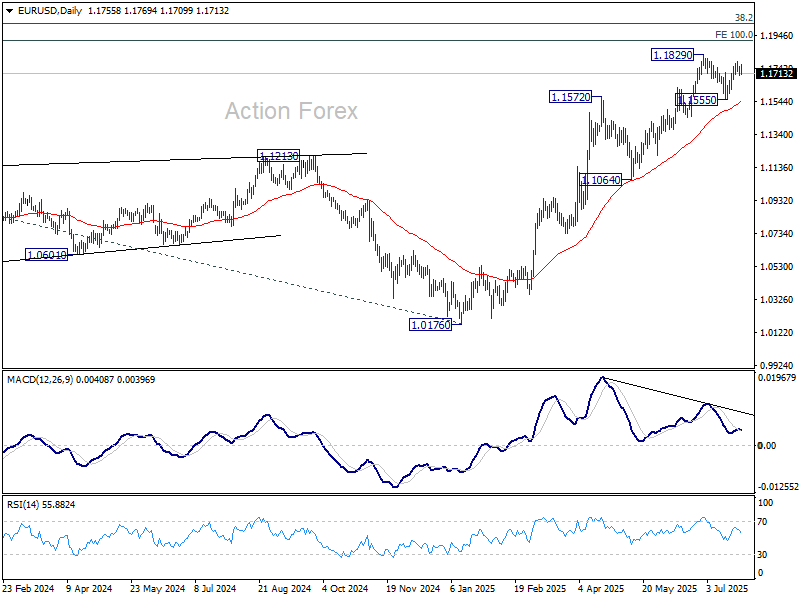
Intraday bias in EUR/USD remains neutral for the moment. On the upside, above 1.1788 will bring retest of 1.1829. Firm break there will will resume whole rally from 1.0176, and target 1.1916 projection level. However, break of 1.1677 will turn bias to the downside, and extend the corrective pattern from 1.1829 with another falling leg.
In the bigger picture, rise from 0.9534 long term bottom could be correcting the multi-decade downtrend or the start of a long term up trend. In either case, further rise should be seen to 100% projection of 0.9534 to 1.1274 from 1.0176 at 1.1916. This will remain the favored case as long as 1.1604 support holds.
USD/JPY Daily Outlook
Daily Pivots: (S1) 147.03; (P) 147.48; (R1) 148.13; More...
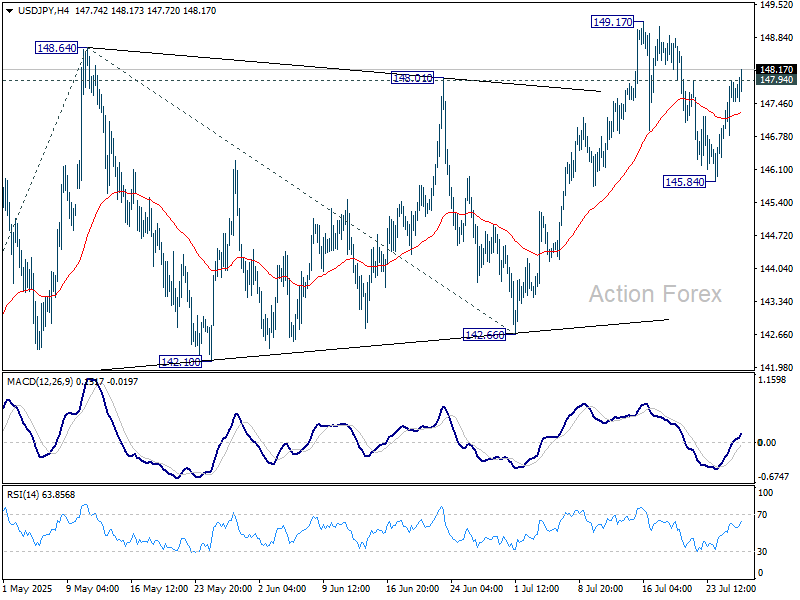
USD/JPY's break of 147.94 resistance suggests that pullback from 149.17 has already completed at 145.84. Intraday bias is back on the upside for retesting 147.94 first. Firm break there will resume whole rise from 139.87. Next target is 100% projection of 139.87 to 148.64 from 142.66 at 151.43, which is close to 151.22 fibonacci level. For now, risk will stay on the upside as long as 145.84 support holds, in case of retreat.
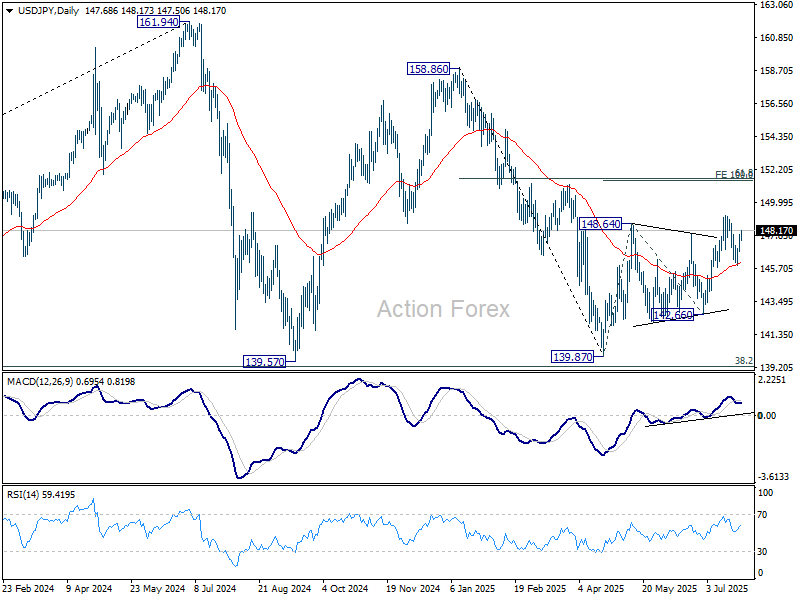
In the bigger picture, price actions from 161.94 (2024 high) are seen as a corrective pattern to rise from 102.58 (2021 low). Decisive break of 61.8% retracement of 158.86 to 139.87 at 151.22 will argue that it has already completed with three waves at 139.87. Larger up trend might then be ready to resume through 161.94 high. In case the corrective pattern extends with another fall, strong support is expected from 38.2% retracement of 102.58 to 161.94 at 139.26 to bring rebound.
GBP/USD Daily Outlook
Daily Pivots: (S1) 1.3395; (P) 1.3458; (R1) 1.3500; More...
Intraday bias in GBP/USD stays neutral for the moment. On the upside, break of 1.3587 will target a retest on 1.3787 high. However, sustained break of 1.3363 support will argue that it's already correcting the whole rally from 1.2099, and target 1.3206 resistance turned support.

In the bigger picture, up trend from 1.3051 (2022 low) is in progress. Next medium term target is 61.8% projection of 1.0351 to 1.3433 from 1.2099 at 1.4004. Outlook will now stay bullish as long as 55 W EMA (now at 1.3045) holds, even in case of deep pullback.

USD/CHF Daily Outlook
Daily Pivots: (S1) 0.7937; (P) 0.7959; (R1) 0.7972; More….
Intraday bias in USD/CHF stays neutral for the moment. On the downside, below 0.7910 will bring retest of 0.7871 low. Firm break there will resume larger down trend and target 61.8% projection of 0.9200 to 0.8038 from 0.8475 at 0.7757. On the upside, break of 0.7990 minor resistance will bring stronger rebound to extend the corrective pattern from 0.7871.

In the bigger picture, long term down trend from 1.0342 (2017 high) is still in progress. Next target is 100% projection of 1.0146 (2022 high) to 0.8332 from 0.9200 at 0.7382. In any case, outlook will stay bearish as long as 0.8475 resistance holds.

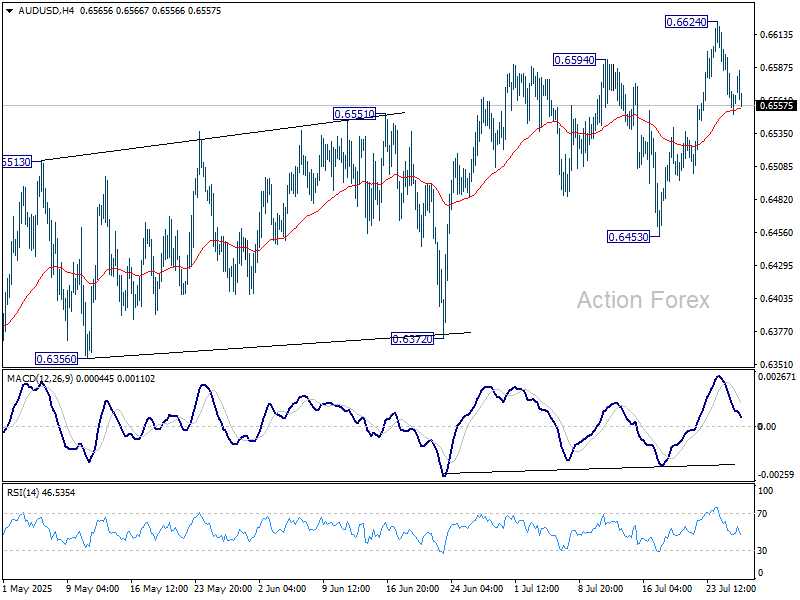
AUD/USD Daily Report
Daily Pivots: (S1) 0.6544; (P) 0.6573; (R1) 0.6594; More...
Intraday bias in AUD/USD remains neutral and more consolidations could be seen below 0.6624 resistance. Further rise is expected as long as 0.6453 support holds. Above 0.6624 will turn bias back to the upside. However, considering bearish divergence condition in D MACD, upside should be limited by 0.6713 fibonacci level on next rise.
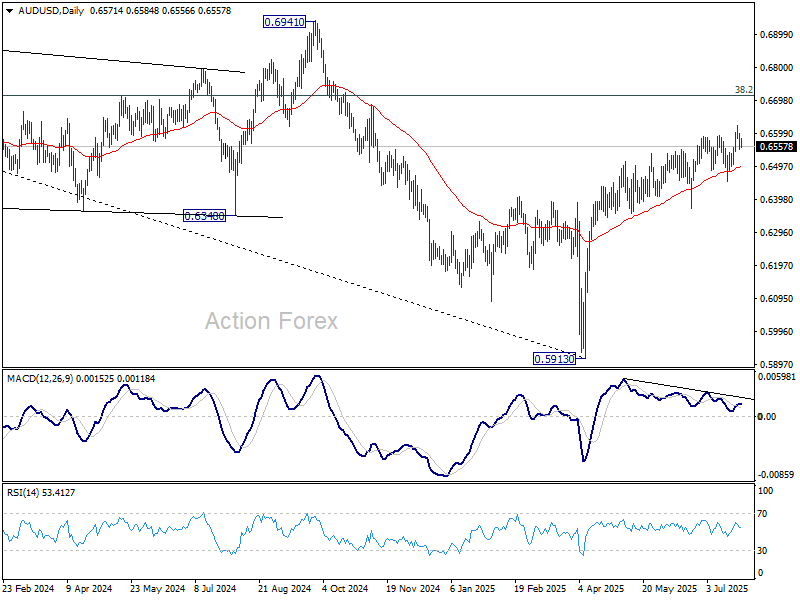
In the bigger picture, there is no clear sign that down trend from 0.8006 (2021 high) has completed. Rebound from 0.5913 is seen as a corrective move. While stronger rally cannot be ruled out, outlook will remain bearish as long as 38.2% retracement of 0.8006 to 0.5913 at 0.6713 holds. Nevertheless, considering bullish convergence condition in W MACD, even in case of another fall through 0.5913, downside should be contained above 0.5506 (2020 low).
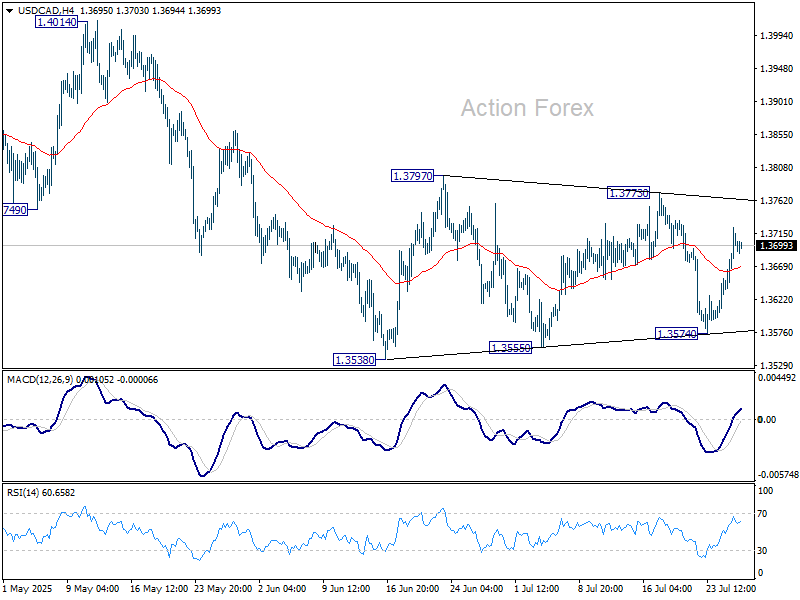
USD/CAD Daily Outlook
Daily Pivots: (S1) 1.3651; (P) 1.3688; (R1) 1.3742; More...
Intraday bias in USD/CAD stays neutral as sideway trading continues. Outlook will remain bearish as long as 1.3773 resistance holds. Break of 1.3574 will argue that consolidation pattern from 1.3538 has completed. And larger fall from 1.4791 is ready to resume through 1.3538. However, firm break of 1.3773 will argue that it's now correcting the whole fall from 1.4791 and target 1.4014 resistance instead.
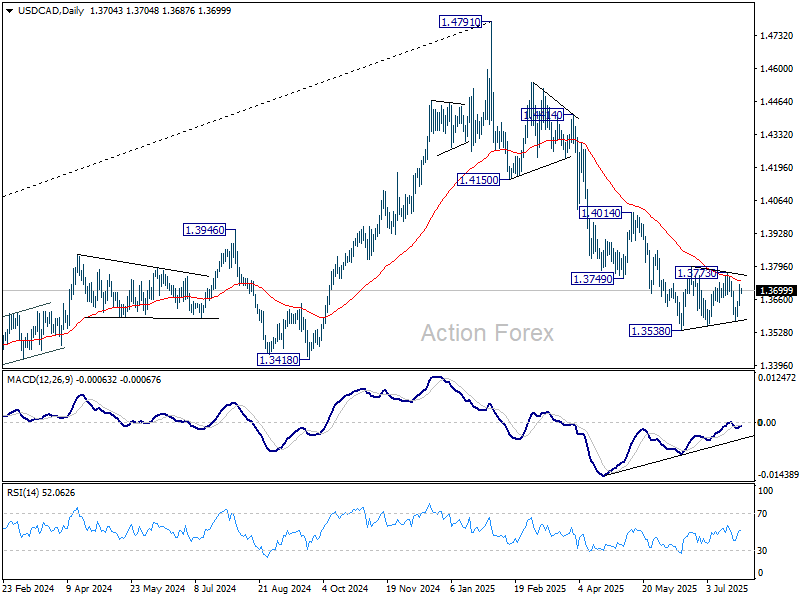
In the bigger picture, price actions from 1.4791 medium term top could either be a correction to rise from 1.2005 (2021 low), or trend reversal. In either case, further decline is expected as long as 1.4014 resistance holds. Next target is 61.8% retracement of 1.2005 (2021 low) to 1.4791 at 1.3069.
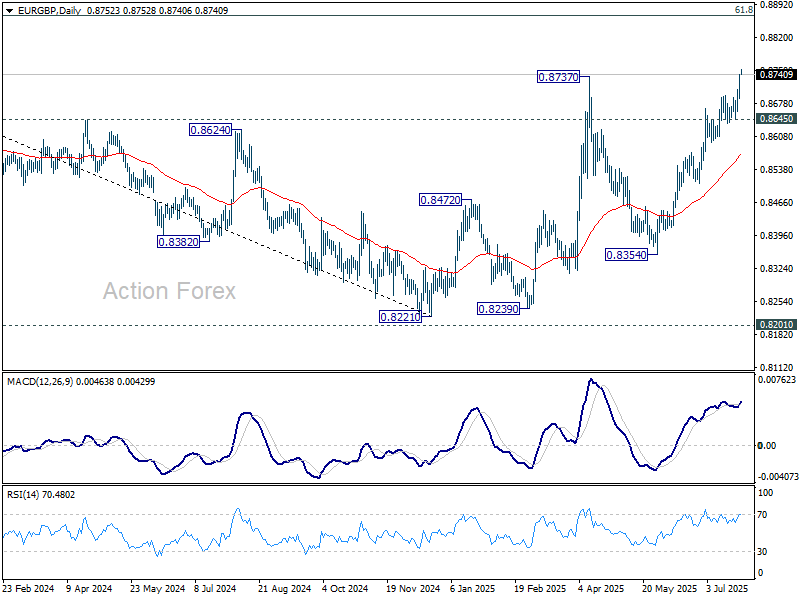
EUR/GBP Daily Outlook
Daily Pivots: (S1) 0.8699; (P) 0.8721; (R1) 0.8762; More...
Intraday bias in EUR/GBP remains on the upside at this point. Current rally is part of the whole medium term rise from 0.8221. Sustained trading above 0.8737 will pave the way to 0.8867 fibonacci level. For now, outlook will stay bullish as long as 0.8645 support holds, in case of retreat.
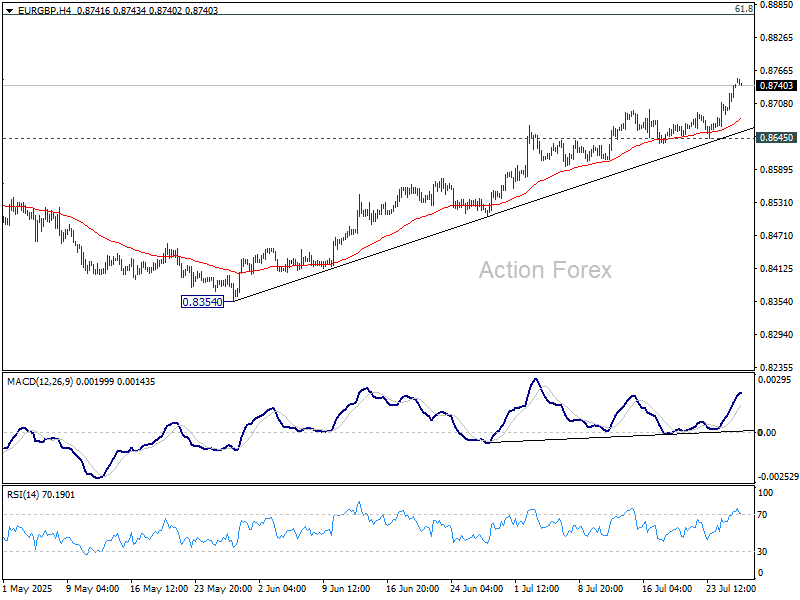
In the bigger picture, the structure from 0.8221 medium term bottom are not impulsive enough to suggest that it's reversing the down trend from 0.9267 (2022 high). But even if it's a correction, further rise is expected to 61.8% retracement of 0.9267 to 0.8221 at 0.8867. This will remain the favored case as long as 55 W EMA (now at 0.8486) holds.