

Sample Category Title
USD/CHF Daily Outlook
Daily Pivots: (S1) 0.7974; (P) 0.8007; (R1) 0.8068; More….
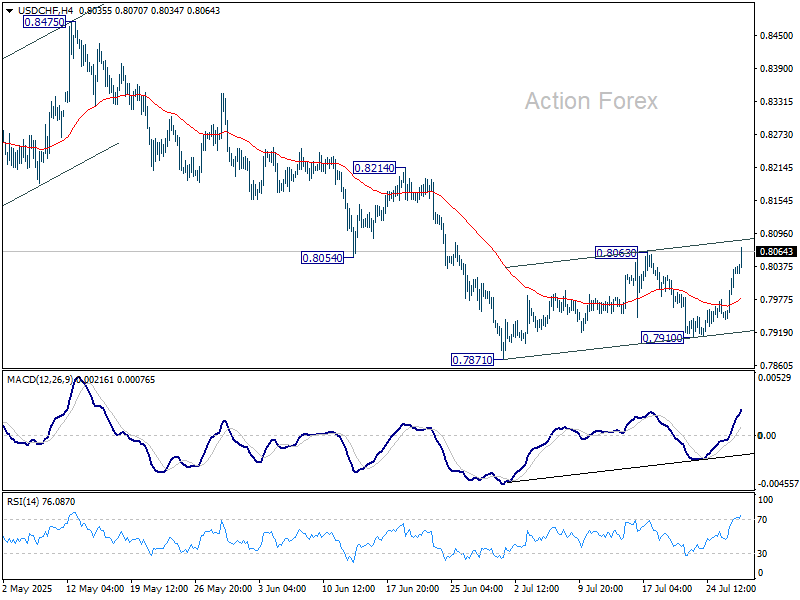
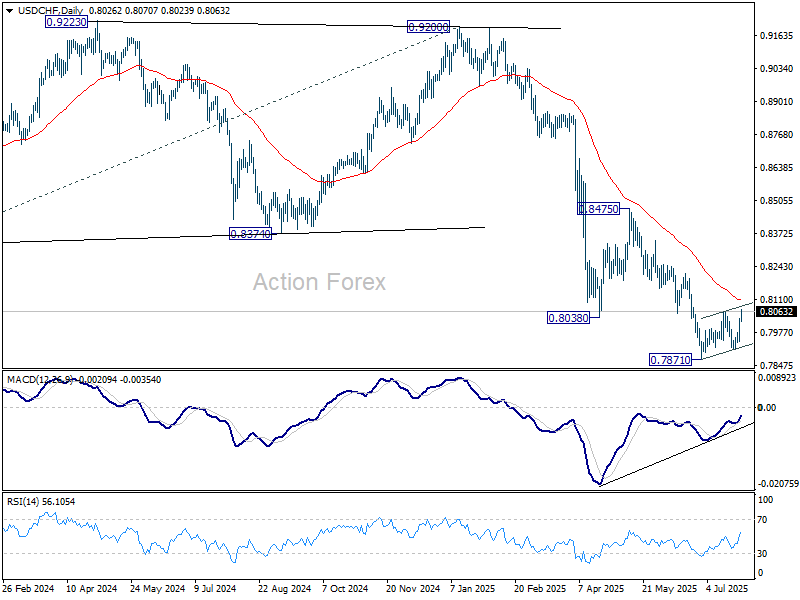
Intraday bias in USD/CHF remains on the upside for the moment. Price actions from 0.7871 are still seen as a corrective pattern. Further rise would be seen to 55 D EMA (now at 0.8107), but upside should be limited there. On the downside, below 0.7910 support will bring retest of 0.7871 low. However, sustained trading above 55 D EMA will indicate medium term bottoming, and target 0.8475 resistance next.
In the bigger picture, long term down trend from 1.0342 (2017 high) is still in progress. Next target is 100% projection of 1.0146 (2022 high) to 0.8332 from 0.9200 at 0.7382. In any case, outlook will stay bearish as long as 0.8475 resistance holds.
AUD/USD Daily Report
Daily Pivots: (S1) 0.6494; (P) 0.6540; (R1) 0.6567; More...
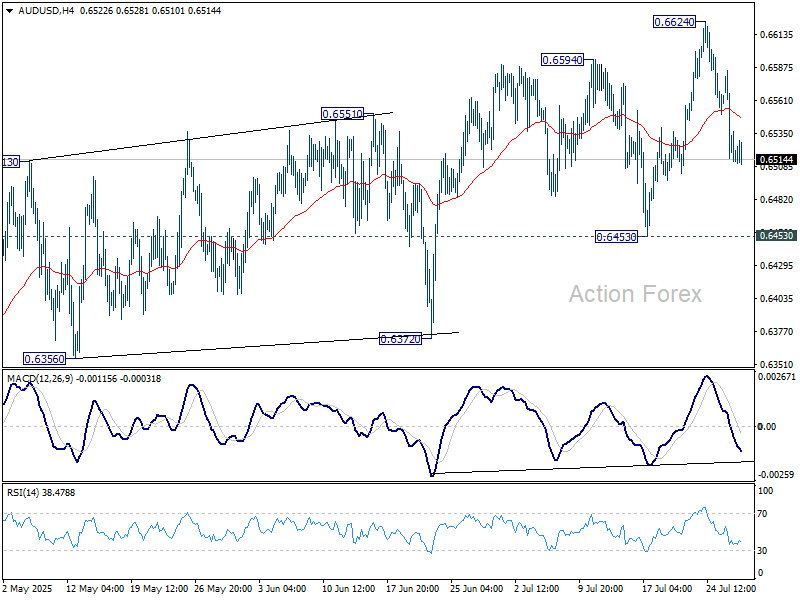
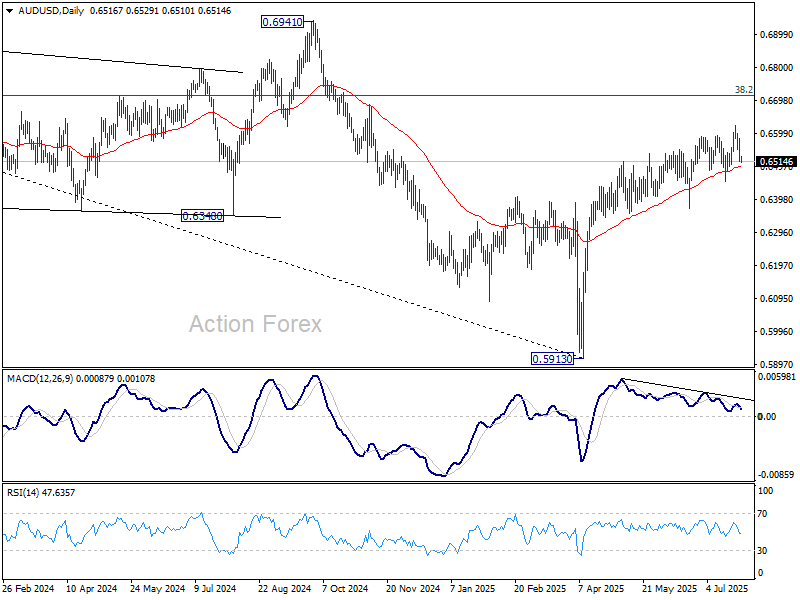
Intraday bias in AUD/USD remains neutral and more consolidations could be seen between 0.6453/6224. Rally from 0.5913 might still extend through 0.6624. However, considering bearish divergence condition in D MACD, upside should be limited by 0.6713 fibonacci level on next rise. Meanwhile, firm break of 0.6453 will turn bias back to the downside for deeper fall.
In the bigger picture, there is no clear sign that down trend from 0.8006 (2021 high) has completed. Rebound from 0.5913 is seen as a corrective move. While stronger rally cannot be ruled out, outlook will remain bearish as long as 38.2% retracement of 0.8006 to 0.5913 at 0.6713 holds. Nevertheless, considering bullish convergence condition in W MACD, even in case of another fall through 0.5913, downside should be contained above 0.5506 (2020 low).
USD/CAD Daily Outlook
Daily Pivots: (S1) 1.3705; (P) 1.3723; (R1) 1.3758; More...
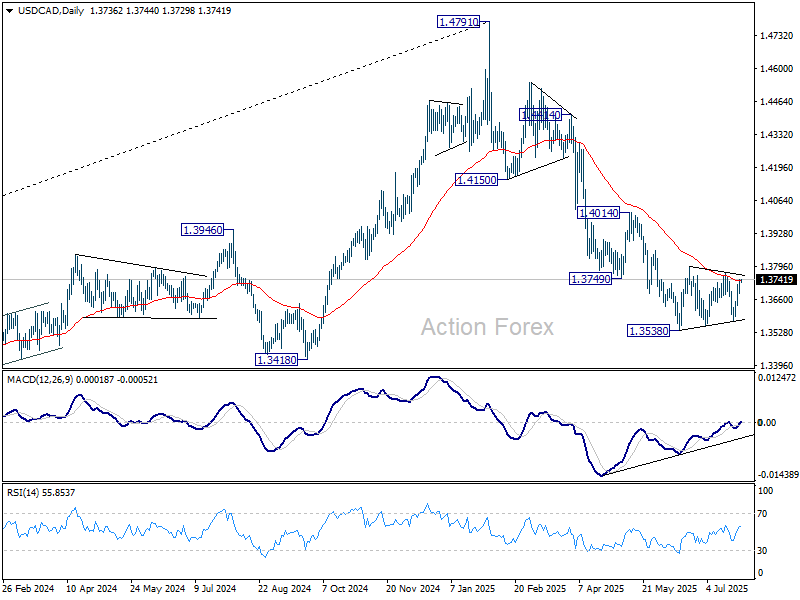
USD/CAD is still bounded in range of 1.3574/3773 and intraday bias stays neutral. Further decline is expected with 1.3773 intact. Break of 1.3574 will argue that consolidation pattern from 1.3538 has completed. And larger fall from 1.4791 is ready to resume through 1.3538. However, firm break of 1.3773 will argue that it's now correcting the whole fall from 1.4791 and target 1.4014 resistance instead.
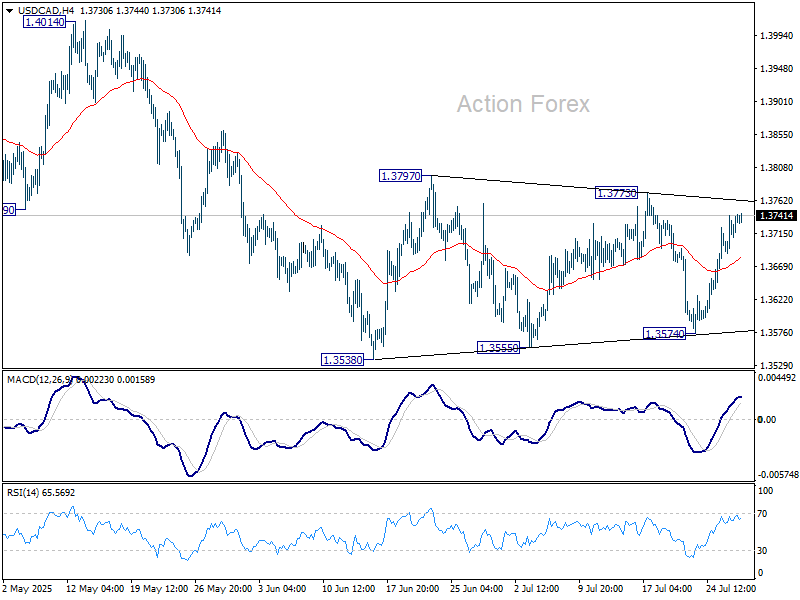
In the bigger picture, price actions from 1.4791 medium term top could either be a correction to rise from 1.2005 (2021 low), or trend reversal. In either case, further decline is expected as long as 1.4014 resistance holds. Next target is 61.8% retracement of 1.2005 (2021 low) to 1.4791 at 1.3069.
EUR/GBP Daily Outlook
Daily Pivots: (S1) 0.8642; (P) 0.8700; (R1) 0.8735; More...
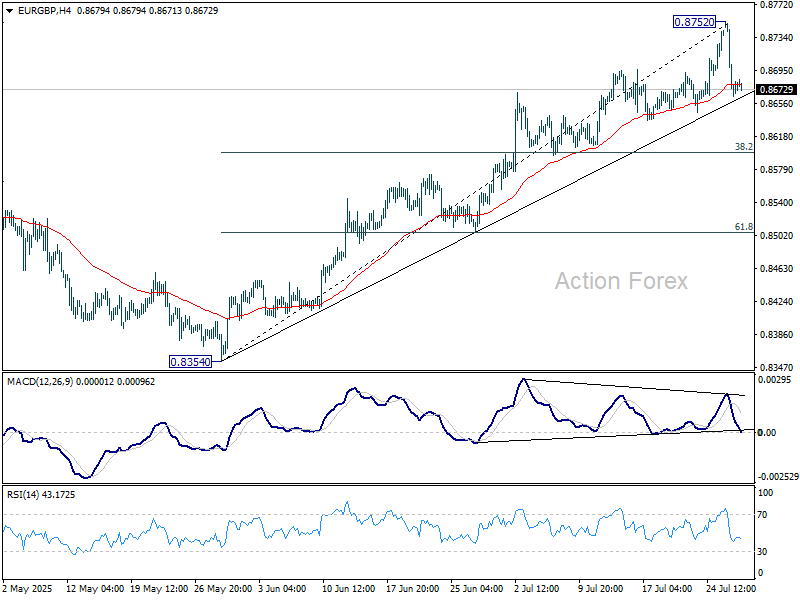
Intraday bias in EUR/GBP is turned neutral first with current steep retreat. Considering bearish divergence condition in 4H MACD, sustained trading below 55 4H EMA (now at 0.8678) will confirm short term topping. Deeper pullback should then be seen to 38.2% retracement of 0.8354 to 0.8752 at 0.8600.
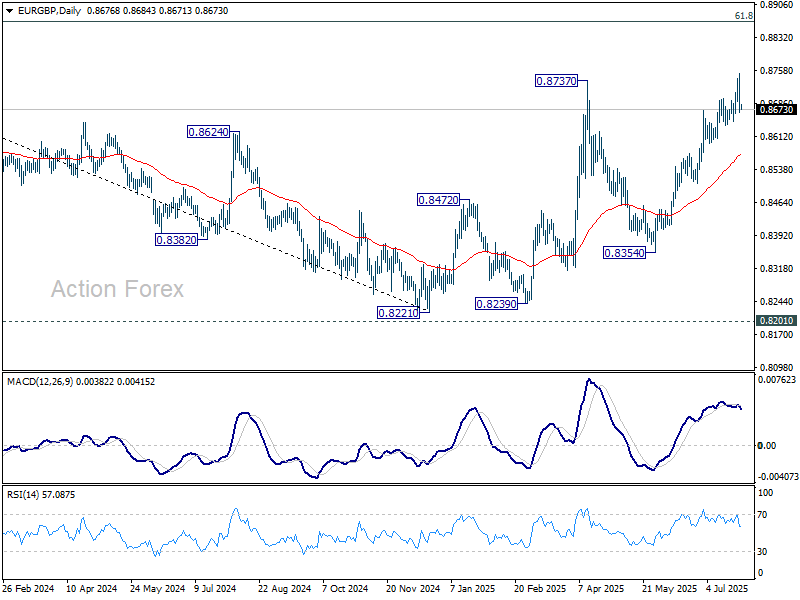
In the bigger picture, the structure from 0.8221 medium term bottom are not impulsive enough to suggest that it's reversing the down trend from 0.9267 (2022 high). But even if it's a correction, further rise is expected to 61.8% retracement of 0.9267 to 0.8221 at 0.8867. This will remain the favored case as long as 55 W EMA (now at 0.8486) holds.
EUR/AUD Daily Outlook
Daily Pivots: (S1) 1.7721; (P) 1.7821; (R1) 1.7874; More...
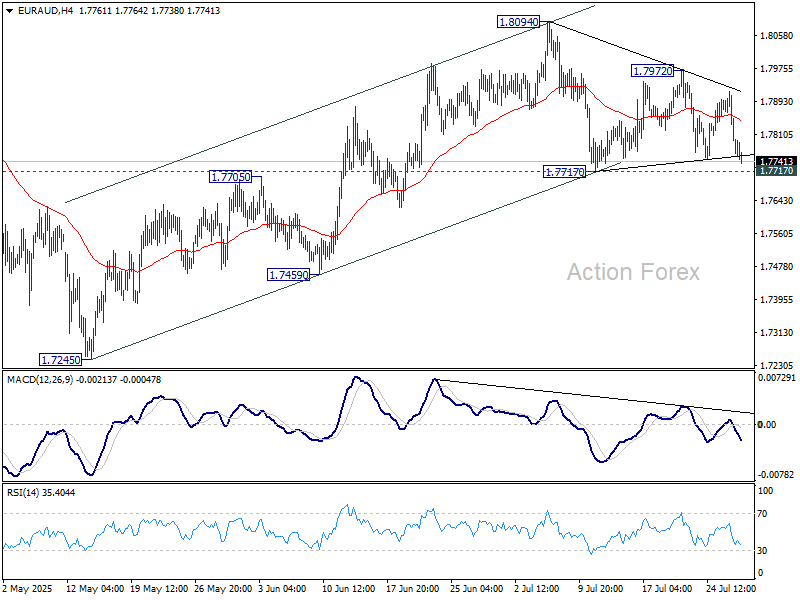
Intraday bias in EUR/AUD stays neutral for the moment. With 1.7717 support intact, further rally is expected. On the upside, above 1.7972 will bring retest of 1.8094. Firm break there will resume the rise from 1.7245 to towards 1.8554 high. However, break of 1.7717 support will revive the case that rise from 1.7245 has completed. Corrective pattern from 1.8554 should have then started the third leg.
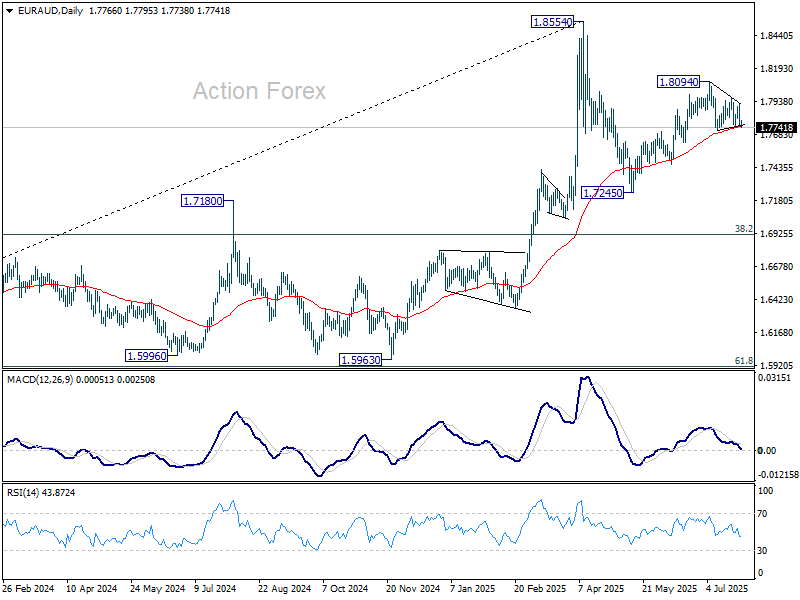
In the bigger picture, price actions from 1.8554 medium term top are seen as a corrective pattern. While deeper pullback might be seen, downside should be contained by 38.2% retracement of 1.4281 (2022 low) to 1.8554 at 1.6922 to bring rebound. Up trend from 1.4281 is expected to resume at a later stage.
GBP/JPY Daily Outlook
Daily Pivots: (S1) 198.00; (P) 198.55; (R1) 198.95; More...
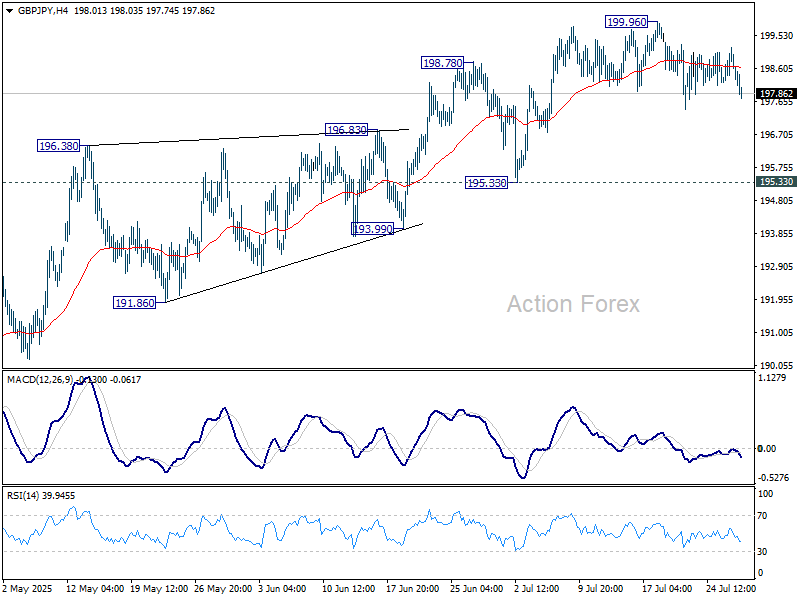
GBP/JPY is staying in consolidations below 199.96 and intraday bias remains neutral. Deeper pullback cannot be ruled out, but outlook will stay bullish as long as 195.33 support holds. On the upside, break of 199.96 will resume the rise from 184.35 to 100% projection of 180.00 to 199.79 from 184.35 at 204.14.
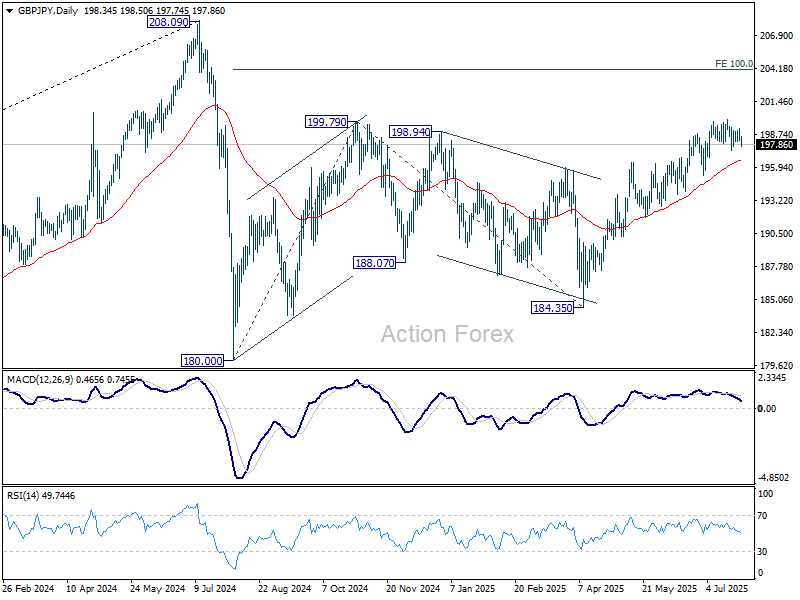
In the bigger picture, price actions from 208.09 (2024 high) are seen as a correction to rally from 123.94 (2020 low). The pattern might still extend with another falling leg. But in that case, strong support should be seen from 38.2% retracement of 123.94 to 208.09 at 175.94 to contain downside. Meanwhile, decisive break of 208.09 will confirm long term up trend resumption.
Elliott Wave Update: EURUSD Favors Weakness In To Support Zone
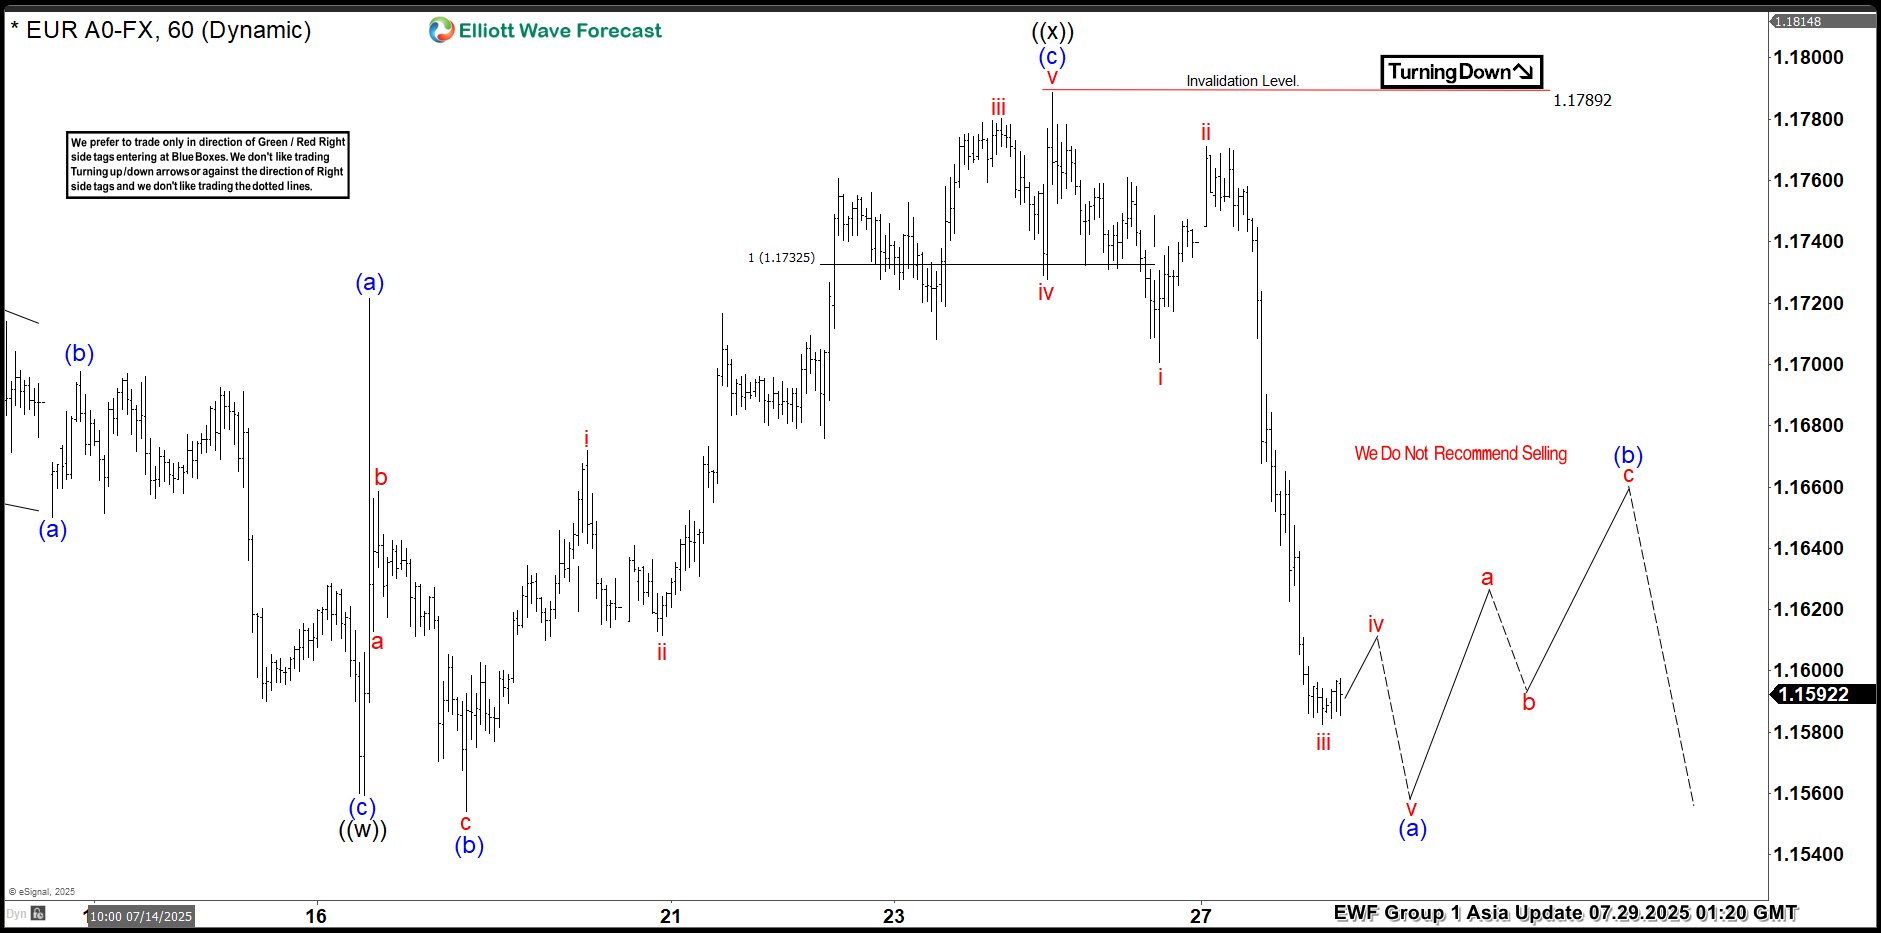
The EURUSD favors upside in 3 swings from September-2022 low & should extend towards 1.1929 or higher against 1.13.2025 low. In 4-hour, it favors double correction lower from 7.01.2025 high to correct 5.12.2025 low. It favors short term pullback in to 1.1512 – 1.1340 area in 7 swing pullback before continue rally in cycle from 1.13.2025 low. Above January-2025 low, it ended (1) at 1.0533 high, (2) at 1.0210 low, (3) at 1.1573 high, (4) at 1.1065 low & favors higher in (5). Within 4-hour, it placed 1 at 1.1830 high & correcting in 2 as double three correction before two more highs. It placed ((w)) at 1.1559 low in 3 swings zigzag correction. In ((w)), it ended (a) at 1.1659 low, (b) at 1.1714 high & (c) at 1.1559 low of 7.16.2025. Later, it unfolded expanded flat correction in ((x)) that ended at 1.1788 high of 7.24.2025. Within ((x)), it placed (a) at 1.1721 high, (b) at 1.1554 low & (c) in 5 swings at 1.1788 high.
Currently, it favors downside in ((y)) of 2 & expect sideways to lower in to support zone. It favors zigzag correction lower in ((y)) to finish 2 in to extreme area before resume rally. Short term, it favors downside in (a) of ((y)) since 7.24.2025 high. In (a), it placed i at 1.1700 low, ii at 1.1771 high & favors downside in iii of (a) towards 1.1576 – 1.1569 area before bounce in iv. It expects a bounce soon in iv followed by one more push lower in v to finish (a) in 5 swings. Wave (a) of ((w)) should end near 1.1578 before bounce in (b) in 3 or 7 swings connector. The bounce in (b) should fail below 1.1788 high to extend lower in (c) in to 1.1512 – 1.1340 area to finish correction. It should find next support in to that area to rally higher as the part of daily sequence targeting 1.1929 or higher. We like to buy in to that area for next leg higher or at least 3 swings bounce. If it breaks above 7.01.2025 high, it expects two more highs to finish cycle from January-2025 before next pullback start.
EURUSD – 60-Minute Elliott Wave Technical Chart:
EURUSD Elliott Wave Technical Video:
https://www.youtube.com/watch?v=pCVQ34fxCHM
EUR/JPY Daily Outlook
Daily Pivots: (S1) 171.52; (P) 172.71; (R1) 173.36; More...
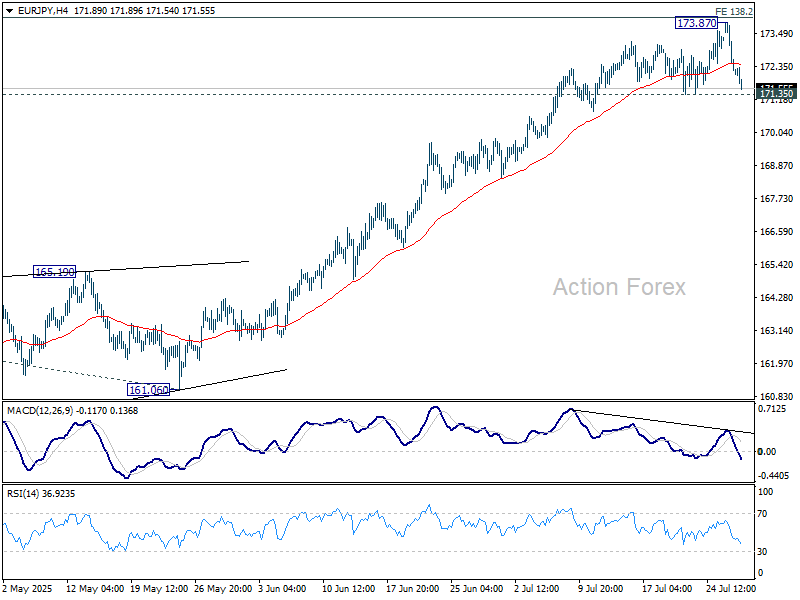
Intraday bias in EUR/JPY is turned neutral first with current steep retreat. Further rise could still be seen as long as 171.35 support holds. Break of 173.87 should pave the way to retest 175.41 high. However, considering bearish divergence condition in 4H MACD, decisive break of 171.35 will confirm short term topping, after rejection by 138.2% projection of 154.77 to 164.16 from 161.06 at 174.03. Deeper pullback should then be seen towards 55 D EMA (now at 168.62).
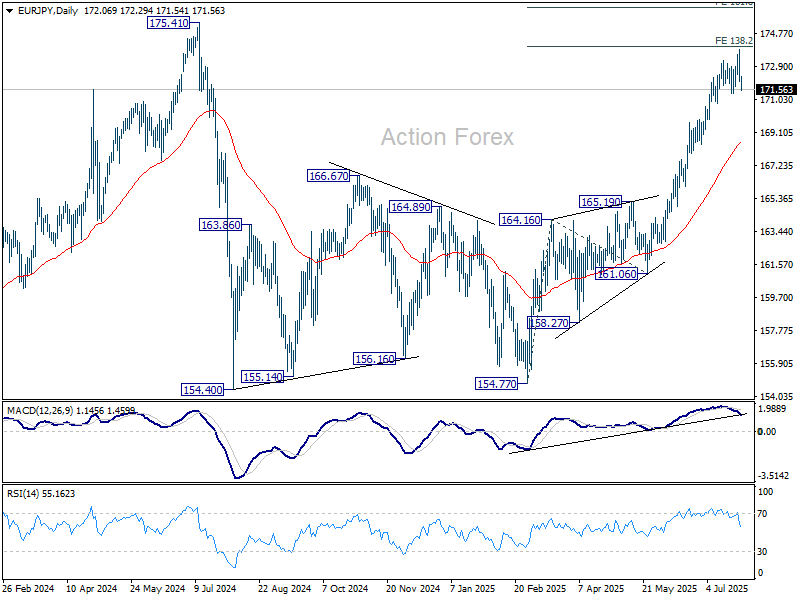
In the bigger picture, considering current strong momentum as seen in the rally from 154.77, corrective pattern from 175.41 could have already completed. Decisive break there will confirm long term up trend resumption. Next target is 61.8% projection of 124.37 to 175.41 from 154.77 at 186.31. However, rejection by 175.41, followed by firm break of 55 D EMA (now at 168.62) will delay this bullish case.
Pre-BoJ Positioning Lifts Yen, Dollar Holds Top Spot
Yen recovered broadly in Asian session, likely helped by short-covering ahead of Thursday’s BoJ policy decision. Traders may be bracing for surprises in the central bank’s updated economic projections, particularly after last week’s US-Japan trade deal lifted some trade-related uncertainty. Although no rate hike is expected, any forward-leaning language suggesting rate hikes in the near term could jolt markets and catch Yen bears off guard.
Across the broader currency markets, Euro remains the worst underperformer for the week after retracing sharply from recent highs. Nevertheless, yesterday’s post-deal drop was not a collapse but rather a technical correction of gains built over the past month. Swiss Franc and Kiwi are also soft, while Dollar continues to lead the majors. Loonie and Yen are gaining ground, while Sterling and Aussie hover in the middle.
On the trade front, US President Donald Trump announced on Monday that countries lacking bilateral deals will soon face a flat tariff of 15–20% when exporting to the US The move aims to simplify trade enforcement and boost U.S. leverage in negotiations. “We’re going to be setting a tariff for essentially the rest of the world,” Trump declared, making clear the US won’t wait on a patchwork of slow-moving talks.
South Korea, meanwhile, is still rushing to avoid the looming 25% tariff threat. Finance Minister Koo Yun-cheol said today he will travel to Washington to pursue a mutually beneficial trade agreement. Koo joins a delegation of senior officials in last-ditch talks with UScounterparts, including Treasury Secretary Bessent and Commerce Secretary Lutnick.
Meanwhile, top US and Chinese trade officials met in Stockholm on Monday for more than five hours of negotiations. While no breakthroughs were announced, both sides signaled that talks would continue Tuesday. Expectations are rather low, as US Trade Representative Jamieson Greer said the goal was to ensure proper implementation of existing deals and improve access to key materials.
Technically, Gold weakened this week following Dollar's rally. Immediate focus is now on 3039.64 support. Firm break there will suggest that rebound from 3248.21 has completed at 3438.89. Deeper decline should then be seen to 3248.21 and possibly below. After all, Gold is extending the corrective pattern from 3499.79 high, which would likely continue for a while.

In Asia, at the time of writing, Nikkei is down -1.04%. Hong Kong HSI is down -1.02%. China Shanghai SSE is flat. Singapore Strait Times is down -0.59%. Japan 10-year JGB yield is down -0.004 at 1.566. Overnight, DOW fell -0.14%. S&P 500 rose 0.02%. NASDAQ rose 0.33%. 10-year yield rose 0.034 to 4.420.
Ranges hold in EUR/USD and stocks even as US-EU deal slammed
Investor sentiment cooled overnight as markets reassessed the US–EU trade agreement more critically. While initially welcomed for averting harsher tariff scenarios, the deal is now being viewed by many as a near-term drag on European growth. What once seemed like a "good deal" in absolute terms is now being interpreted as a relative setback for the EU economy.
Political backlash within Europe has intensified. French Prime Minister Francois Bayrou called the framework a "dark day" for Europe, accusing the bloc of capitulating to US demands. German Chancellor Friedrich Merz also warned that the tariffs embedded in the deal would inflict “significant” damage on Germany’s export-driven economy.
Despite the rhetoric, equity market reactions remained contained. Germany’s DAX lost -1.02% and France’s CAC fell -0.43%, but both indexes remain within tight sideways trading ranges. In the US, DOW dipped slightly by -0.14% while S&P 500 eked out a small gain of 0.02%, signaling that investors don’t see the agreement as overwhelmingly skewed toward American interests either.
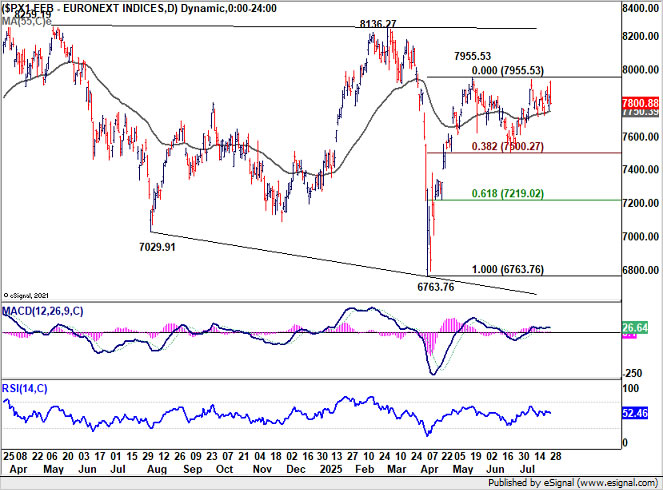
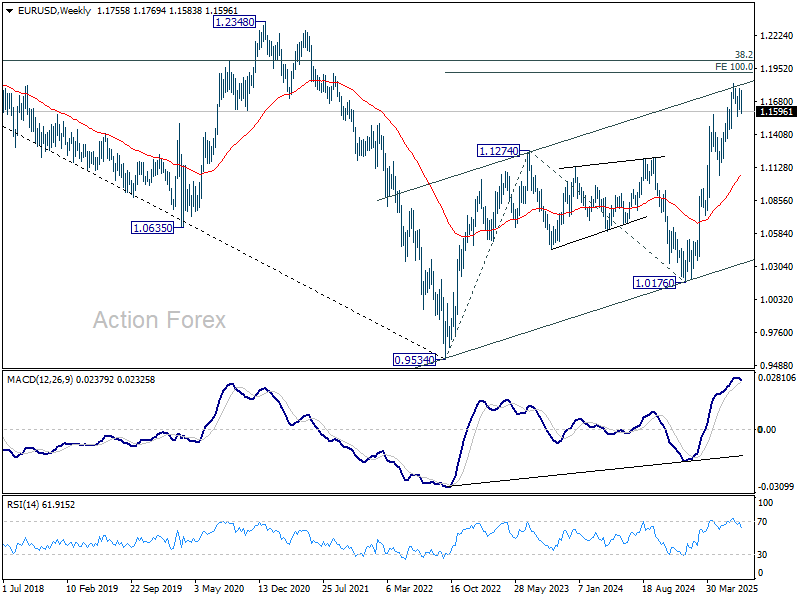
EUR/USD came under strong selling pressure yesterday. However, the move is seen as part of the corrective pattern from 1.1829 short term top. Larger up trend is still expected to resume later. This view will hold as long as 55 D EMA (now at 1.1538) holds.

That said, technical headwinds are clearly building. The pair already touching the long term rising channel resistance, and nearing a long-term Fibonacci projection level at 1.1916, 100% projection of 0.9534 to 1.1274 from 1.0176 at 1.1916. Bearish divergence on D MACD suggests fading momentum, recent up trend is clearly running out of steam. Sustained break of 55 D EMA will argue that it's already in a larger scale correction after rejection by 1.1916.
EUR/JPY Daily Outlook
Daily Pivots: (S1) 171.52; (P) 172.71; (R1) 173.36; More...
Intraday bias in EUR/JPY is turned neutral first with current steep retreat. Further rise could still be seen as long as 171.35 support holds. Break of 173.87 should pave the way to retest 175.41 high. However, considering bearish divergence condition in 4H MACD, decisive break of 171.35 will confirm short term topping, after rejection by 138.2% projection of 154.77 to 164.16 from 161.06 at 174.03. Deeper pullback should then be seen towards 55 D EMA (now at 168.62).
In the bigger picture, considering current strong momentum as seen in the rally from 154.77, corrective pattern from 175.41 could have already completed. Decisive break there will confirm long term up trend resumption. Next target is 61.8% projection of 124.37 to 175.41 from 154.77 at 186.31. However, rejection by 175.41, followed by firm break of 55 D EMA (now at 168.62) will delay this bullish case.
Bitcoin Consolidates Gains, But Bulls Remain In Control
Key Highlights
- Bitcoin rallied above the $115,000 resistance zone before a consolidation phase.
- BTC/USD is following a declining channel with support at $113,500 on the 4-hour chart.
- Ethereum climbed higher above $3,800 resistance.
- XRP price rallied above the $3.20 level and recently corrected gains.
Bitcoin Price Technical Analysis
Bitcoin price started a fresh increase above the $115,000 zone against the US Dollar. BTC was able to climb above the $118,000 and $120,000 resistance levels.
Looking at the 4-hour chart, the price settled above the $115,000 level, the 100 simple moving average (red, 4-hour), and the 200 simple moving average (green, 4-hour). The bulls even pumped the price above the $122,000 resistance.
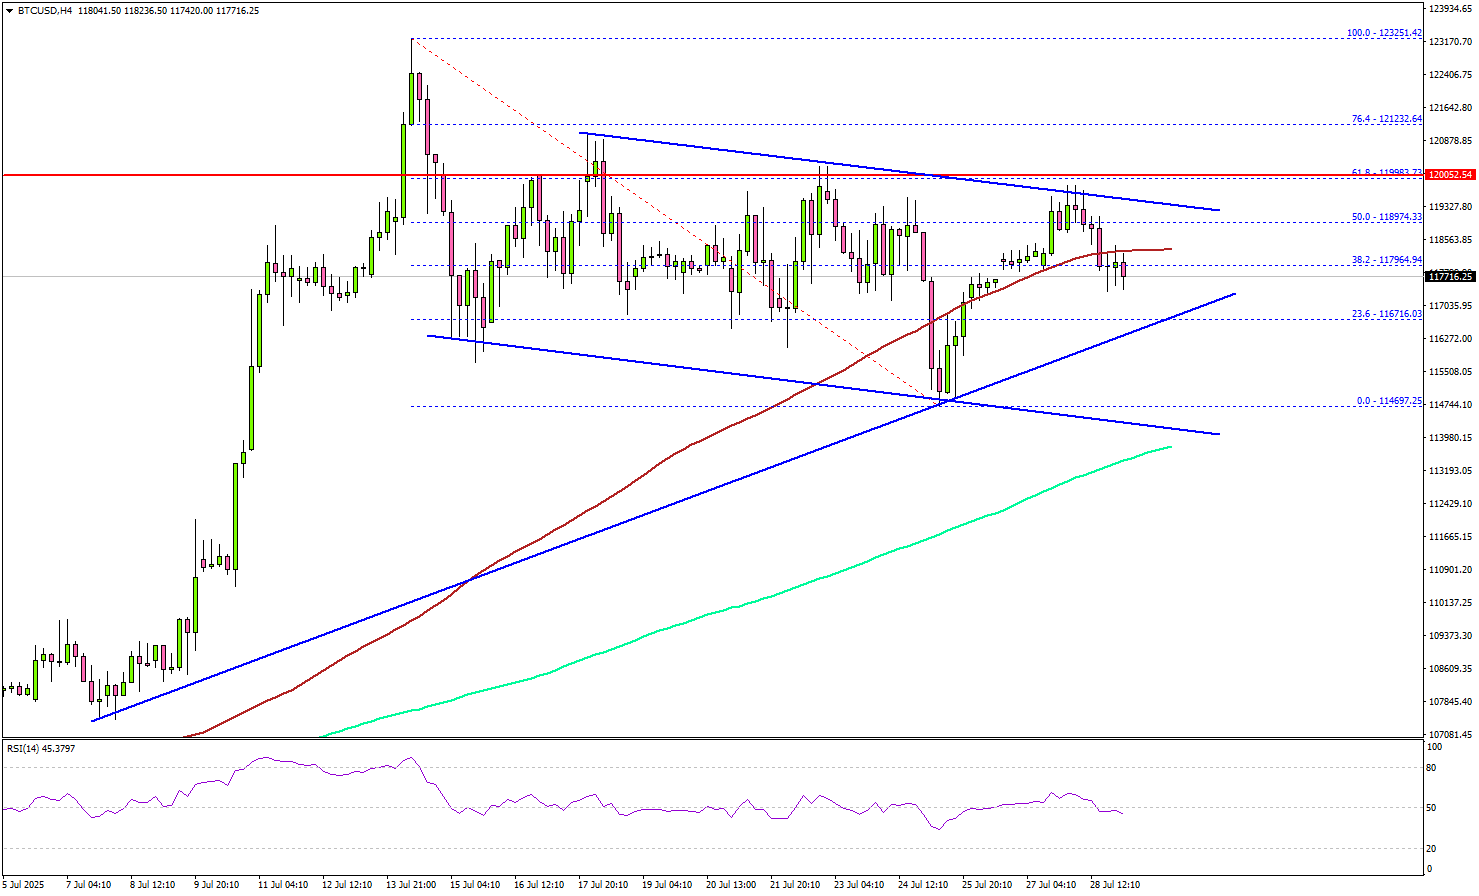
A new all-time high was formed near $123,200 and the price is now correcting gains. Immediate support is near $116,700 and a connecting bullish trend line on the same chart.
A downside break below $116,700 might send BTC toward the $115,000 support. Any more losses might send the price toward the $113,500 support zone. There is also a declining channel in place with support at $113,500.
On the upside, the price could face resistance near the $119,500 level. The next key resistance is $120,500. A successful close above $120,500 might start another steady increase.
In the stated case, the price may perhaps rise toward the $122,500 level. Any more gains might call for a test of $123,200.
Looking at Ethereum, the bulls seem to be in control, and they were able to push the price above the $3,800 resistance zone.
Today’s Economic Releases
- US Housing Price Index for May 2025 (MoM) - Forecast -0.2%, versus -0.4% previous.