

Sample Category Title
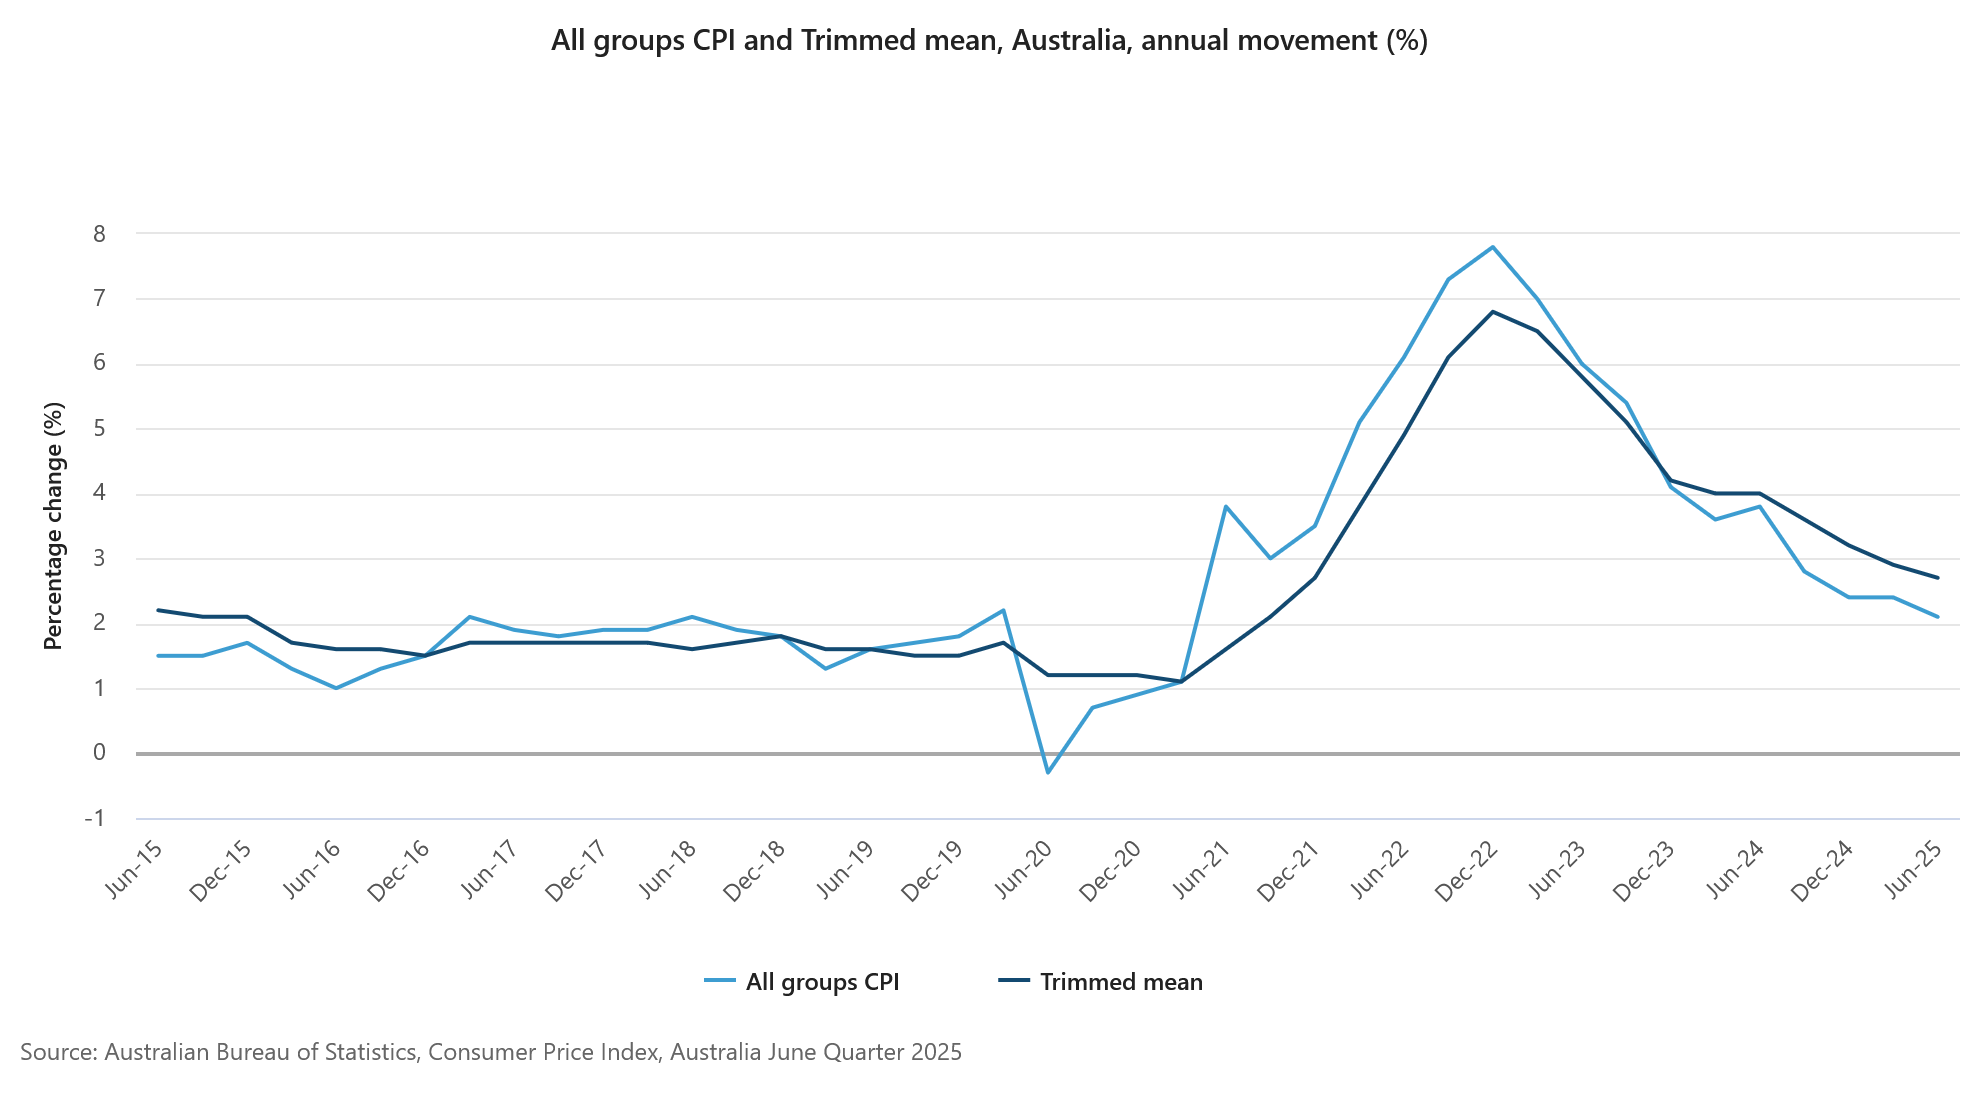
Australia CPI cools to 2.1% in Q2, June reading undershoots
Australia’s inflation pressures continued to ease in Q2, reinforcing expectations for further policy easing from the RBA.
Headline CPI rose 0.7% qoq, down from Q1’s 0.9% qoq and under the 0.8% qoq consensus. On an annual basis, CPI slowed from 2.4% yoy to 2.1% yoy, the lowest since early 2021, and below expectation of 2.2% yoy.
Trimmed mean inflation, the RBA’s preferred gauge, also moderated from 0.7% qoq to 0.6% qoq. Annual rate fell from 2.9% to 2.7% yoy, matched expectations, and marking the lowest since Q4 2021.
Underlying disinflation is broadening too. Annual services inflation cooled from 3.7% yoy to 3.3% yoy, the weakest since Q2 2022. Goods inflation dipped back to 1.1% yoy after a brief uptick from Q4's 0.8% yoy to Q1's 1.3% yoy.
The June monthly CPI dropped from 2.1% yoy to 1.9% yoy, also below expectations of 2.1% yoy, and undershoots RBA's 2-3% target band.
NZ ANZ business confidence ticks up to 47.8, easing inflation signals more RBNZ cuts ahead
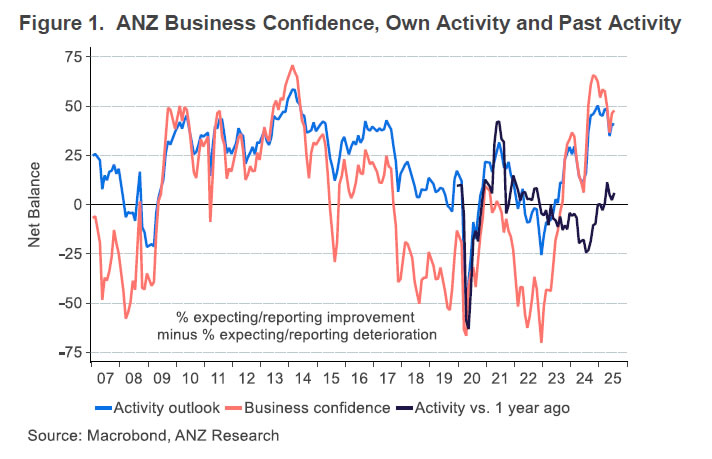
New Zealand’s ANZ Business Confidence ticked higher in July, rising from 46.3 to 47.8. Own Activity Outlook edged down slightly from 40.9 to 40.6. The share of firms expecting to raise prices over the next three months dropped to 43.5%—the lowest since December 2024. Inflation expectations also dipped from 2.71% to 2.68%.
ANZ described the inflation signals as “benign,” noting declines across both cost and pricing expectations. The bank suggested that RBNZ may soon shift from worrying about inflation staying too high to concerns about it falling too low, implying a greater likelihood of deeper monetary easing than currently priced in by markets or flagged by the RBNZ itself.
EURGBP Wave Analysis
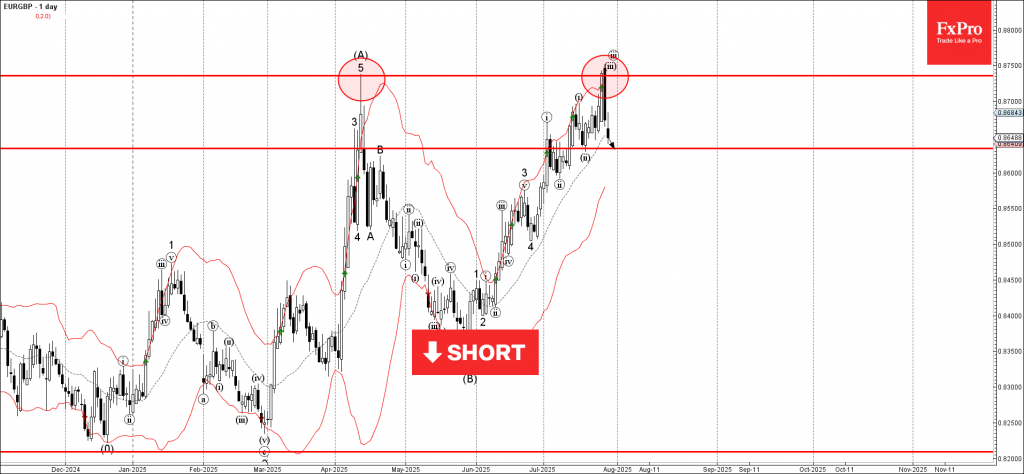
EURGBP: ⬇️ Sell
- EURGBP reversed from the resistance zone
- Likely fall to support level 0.8635
EURGBP currency pair recently reversed down from the resistance zone between the multi-month resistance level 0.8735 (which stopped sharp wave (A) in April) and the upper daily Bollinger Band.
The downward reversal from this resistance zone created the daily Japanese candlesticks reversal pattern Dark Cloud Cover.
Given the strength of the resistance level 0.8735, EURGBP currency pair can be expected to fall to the next support level 0.8635 (low of the previous minor correction ii).
Nikkei 225 Wave Analysis
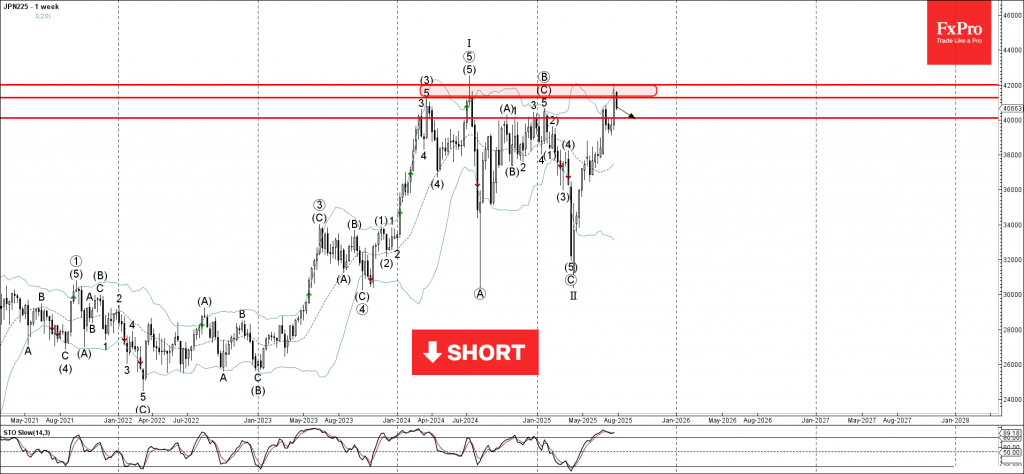
Nikkei 225: ⬇️ Sell
- Nikkei 225 reversed from the resistance zone
- Likely fall to support level 40000.00
Nikkei 225 index recently reversed from the resistance zone between the resistance levels 42000.00 (which started the sharp sell-off in 2024) and 41285.00.
This resistance zone was further strengthened by the upper daily and the weekly Bollinger Bands.
Given the strength of the aforementioned resistance zone and the overbought weekly Stochastic, Nikkei 225 index can be expected to fall to the next round support level 40000.00.
Dow Jones Wave Analysis
Dow Jones: ⬇️ Sell
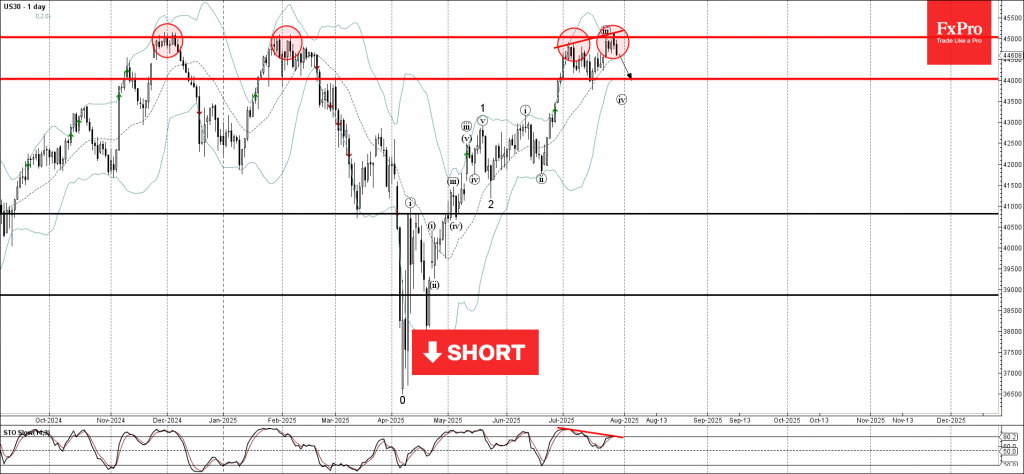
- Dow Jones reversed from the long-term resistance level 45000.00
- Likely fall to support level 44000.00
Dow Jones index recently reversed down from the resistance zone between the long-term resistance level 45000.00 (which has been reversing the price from the end of 2024) and the upper daily Bollinger Band.
The downward reversal from this resistance zone created the daily Japanese candlesticks reversal pattern, Bearish Engulfing.
Given the strength of the resistance level 45000.00 and the bearish divergence on the daily Stochastic, Dow Jones index can be expected to fall to the next support level 44000.00 (which reversed the price earlier in July).
EURUSD Selloff Deepens as Yearly Highs Fade from View
The Euro had been on a strong run this year, and only a few events could stop its uptrend in the first half of 2025.
Between new infrastructure deals, unification behind the Ukrainian cause, and the constant mess-ups from the Trump Administration, EUR/USD had many reasons go higher.
But Markets are forward-looking, and all these factors have been priced in, with sellers now heavily grabbing control of the price action: The latest EU-US Deal is considered disadvantageous for the EU, and this is turning into a sell-the-fact trade.
The pair's end-June rally has not seen any retracement, and the ongoing selloff is about to make this final up-move to the 1.1830 highs vanish.
The question is: Is the ongoing rally in the US Dollar strong enough to keep pushing the pair down further?
Let’s take a look at the technical patterns moving EUR/USD.
EUR/USD Technical Analysis
EUR/USD Daily Chart
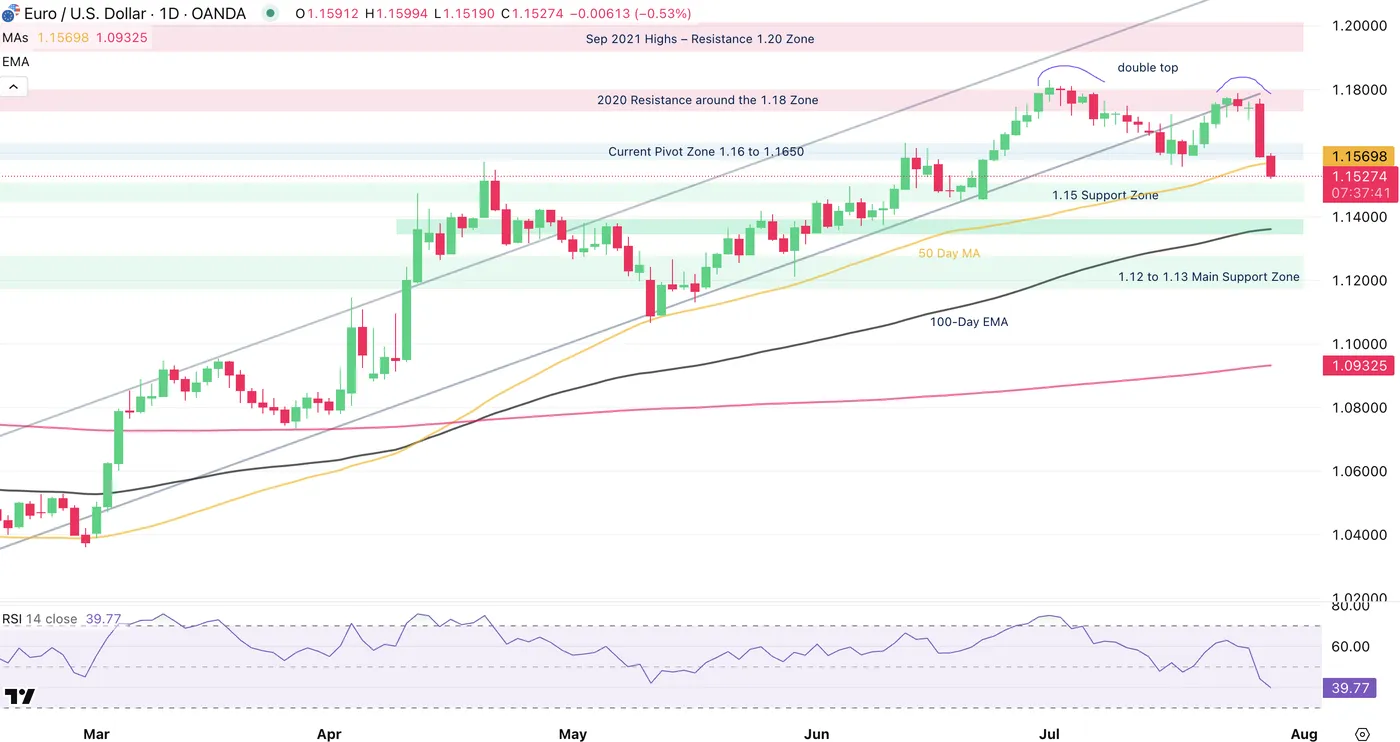
EUR/USD Daily Chart, July 29, 2025 – Source: TradingView
The Pound had led major currencies in the ongoing sell-offs for US Dollar buybacks.
In our most recent US Dollar analysis, we pointed to the formation of a double top. Over the past two sessions, markets haven’t taken it lightly—we are now about three handles lower from the past week's highs.
A daily close right at the Current Pivot Zone 1.16 to 1.1650 after a 1.30% correction in yesterday’s session was followed by another strong selling candle, now breaching below the 50-Day Moving Average.
Daily RSI momentum is now becoming bearish as the sellers bring the pair around the 1.15 Main support Zone.
Let’s take a closer look.
EUR/USD 4H Chart
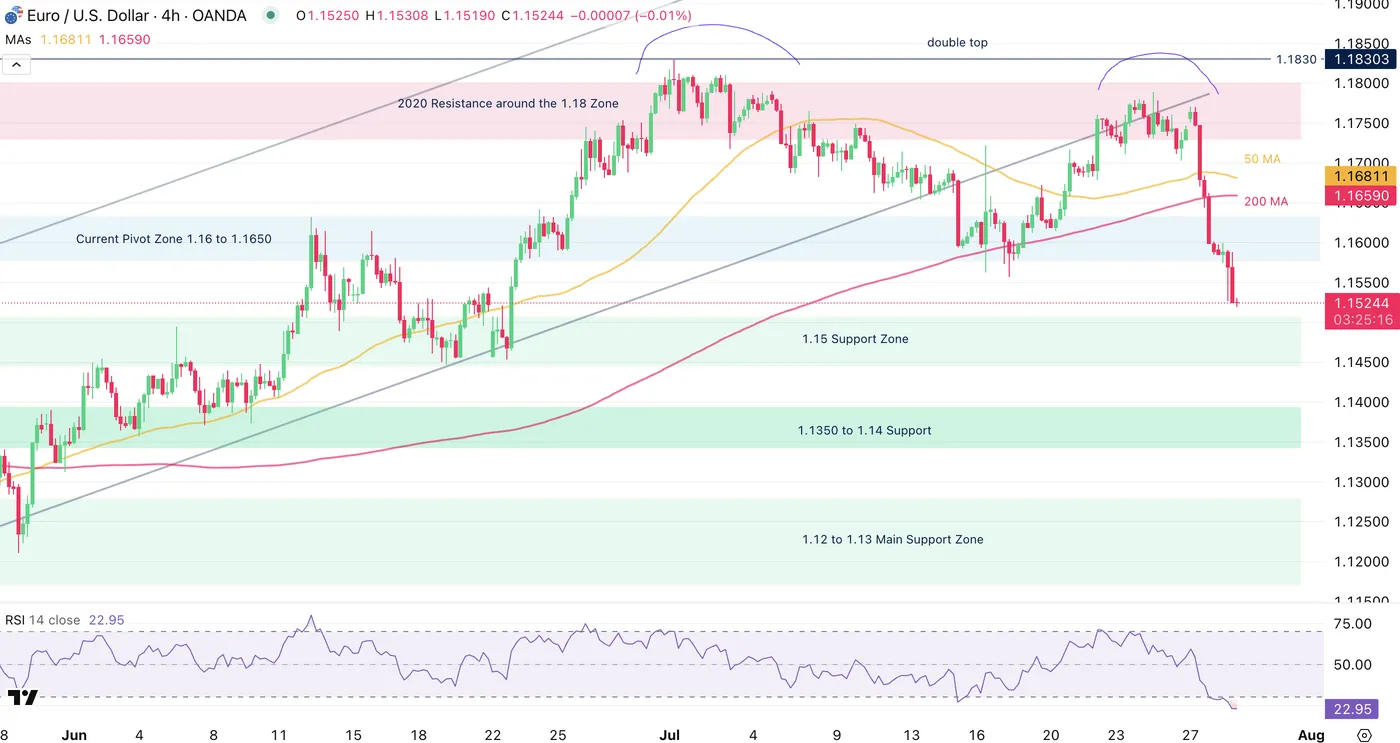
EUR/USD 4H Chart, July 29, 2025 – Source: TradingView
Sellers have had full control since the weekly open, sending the pair in a 2.12% correction.
The ongoing selloff is forming a tight bear channel, and with candles closing at their extremes, momentum is strong. Some mean reversion is currently trying to take place as the 4H RSI is turning oversold.
The 1.15 Support Zone is located just below the psychological level, so reactions as prices arrive in this region will be essential to track – any consolidation in the zone would be considered more bearish than an actual retracement higher but the idea right now is to keep an eye on the ongoing move.
Levels of interest to place on your charts:
Support Levels:
- 1.15 Support Zone (encompassing - 300 pips)
- 1.1350 to 1.14 Support in confluence with the 100-Day EMA
- 1.12 to 1.13 Main Support Zone
Resistance Levels:
- Current Pivot Zone 1.16 to 1.1650
- 1.1660 MA 50 and 200 Confluence
- 2020 Resistance around the 1.18 Zone
- 1.1830 2025 Highs
EUR/USD 1H Chart
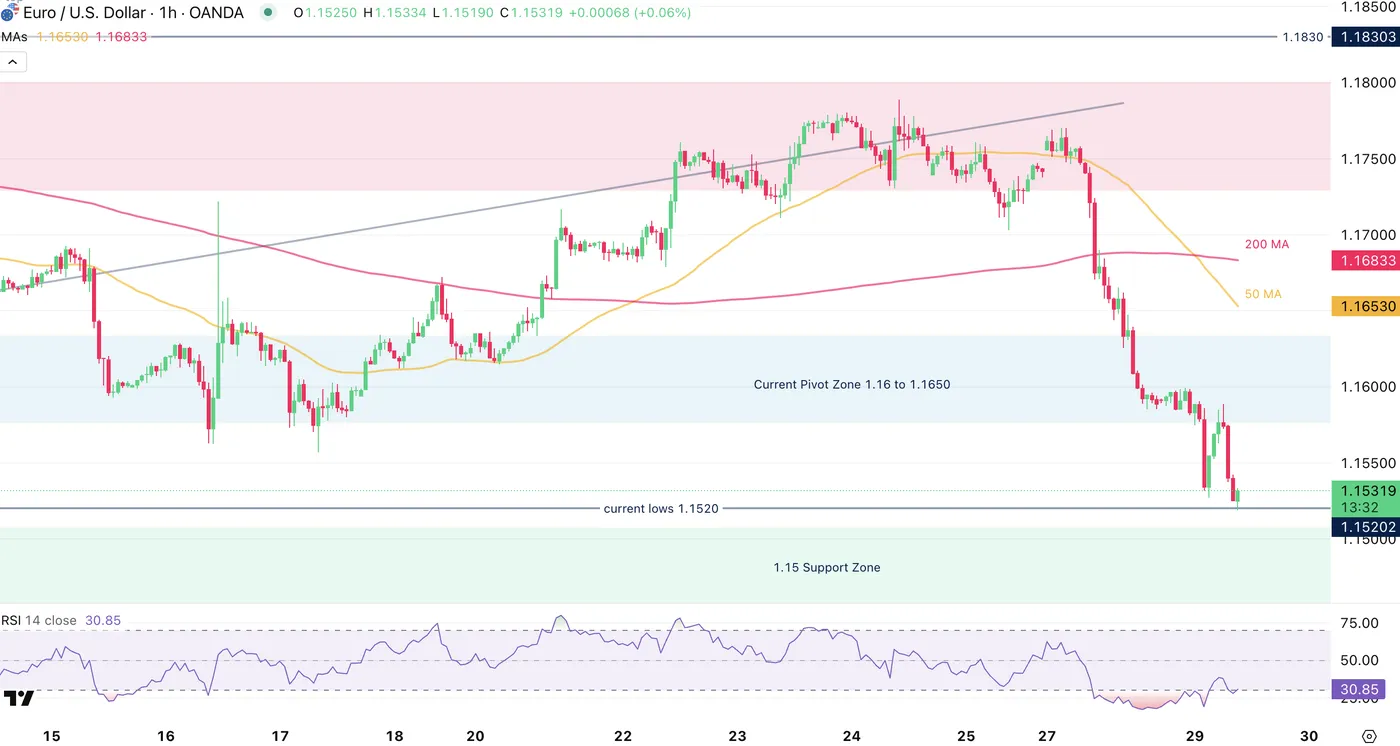
EUR/USD 1H Chart, July 29, 2025 – Source: TradingView
Markets are awaiting to see what happens to the US Dollar after the JOLTS report coming up in about 10 minutes – In the meantime, the selling seems to be slowing down after touching the 1.1520 lows.
Any strong close below warrants a further continuation towards the bottom of the support zone (between 1.1470 to 1.1450).
Reversals on a weaker USD would point to the Pivot Zone – Also consider the 1H MA 50 currently at 1.1650 and catching up to the prices fastly amid this flash-selloff.
Safe Trades!
Sunset Market Commentary
Markets
EUR/USD weakness continues to prevail in the wake of the trade agreement with the US, be it in choppy trading. The common currency wiped out early losses in the European session only to stack them up again in early US dealings. A buy-the-rumour, sell-the-fact correction was nevertheless inbound after failing to move beyond the July high end last week amid rumours of an imminent deal. All of the EUR/USD dips since March of this year were seen as good entry points and we think this time is no different. For the time being though, we wouldn’t row against the tide and let the downleg run its course. That’s particularly so given the high risk of a technical break lower below the 1.1578 neckline of a double top formation. The level is cracking right now and could, in case of a confirmed break, pave the way for a return to 1.1431 initially with 1.1214/1.1184 then popping up as the next reference. Aside from euro weakness, we’re spotting dollar strength as well going into the first releases (JOLTS, Conference Board consumer confidence, cfr infra) of a busy economic calendar this week. The IMF supported the upleg with an upward revision to US growth for this year to 1.9% from 1.8% estimated in April and to 2% (from 1.7%) in 2026. The fund cited lower than expected tariff rates for the move, though warned they still pose a risk for the US (as well as global) economy. DXY takes out the mid-July high to trade north of 99 for the first time since end June. The 99.63/100 barrier serves as the next resistance. The IMF’s updated forecasts for the euro area entail a 1% growth this year (+0.2 ppts) but partially due to a jump in frontloaded Irish pharmaceutical exports to the US. It kept the 2026 estimate unchanged at 1.2%. Global growth expectations were lifted to 3% from 2.8% and 3.1% from 3% for 2025 and 2026 respectively. Rates markets trade pretty quiet with some minor Bund underperformance vs Treasuries. German yields eke out 1.5 bp at the front and middle section of the curve. It’s worth noting that the ultralong end (30-yr) remains near the 14-year highs. US rates are down between 2.8-4.4 bps in a bull flattening move.
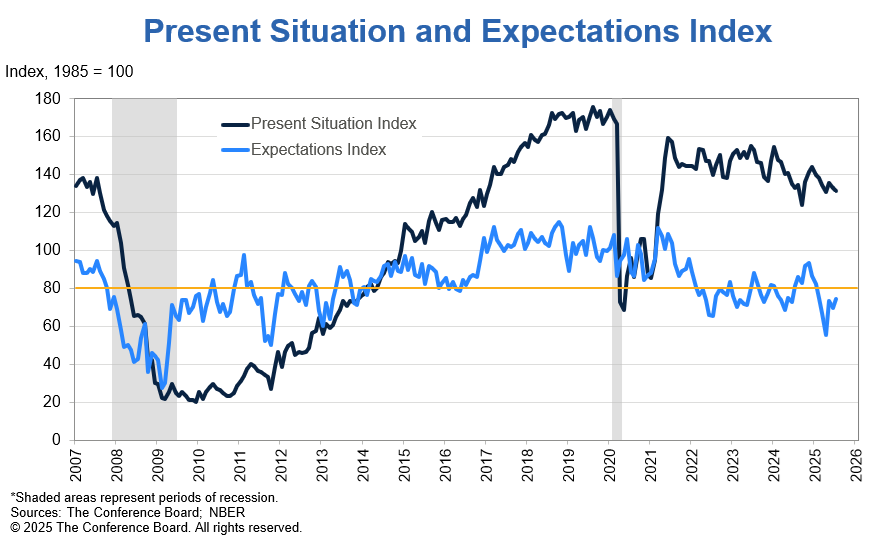
US JOLTS job openings in June came in at 7.43 mln, pretty close to the 7.5 mln expected but lower than May’s 7.77 mln. The quits rate – a gauge of confidence in finding a new job after voluntarily quitting one – stabilized at 2%. July consumer confidence measured by the Conference Board meanwhile improved from an upwardly revised 95.2 to 97.2. The present situation was considered slightly worse than the upwardly revised print for June. The expectations component rose from 69.9 to 74.4, the highest since February this year. The US dollar and yields react stoic.
News & Views
The Belgian economy grew by 0.2% q/q in the second quarter of 2025, the National Bank of Belgium’s initial estimate showed today. That’s halve the pace of the first quarter. The year-on-year growth rate stood at 1%, easing from 1.1% in Q1 and maintaining the +/- 1% growth pace in place since 2024. This flash estimate has no expenditure details yet. Instead, the value added approach reveals a 0.1% q/q contraction in the industrial sector while both the construction and services sectors saw positive activity growth of 0.2%.
• Hungary’s economy ministry slashed its growth estimates for this year and the next. GDP may now grow a meagre 1% this year vs an already earlier reduced 2.5% from the initial 3.4% estimate. Economy minister Nagy said the economy may have stagnated in Q2 following a contraction in the first quarter and added that it may grow significantly less than forecast in the second half of the year. Expectations for 2026 were lowered to 3.1% from 4.1%. The struggling economy going into election year 2026 prompted several ad hoc government interventions, including price caps to tame inflation and a series of stimulus measures. The former fail to keep price pressures really in check with inflation remaining above the central bank’s target in June (4.6%), so offering little relief for consumers, but instead weighing on business confidence. The latter put additional strain on already weak public finances. Nagy nevertheless still believes it can reach its earlier upwardly revised 4.1% deficit target for this year. The Hungarian forint weakened abruptly and sharply after the new government estimates. EUR/HUF is testing the 400 barrier again.
US consumer confidence rises to 97.2, but recession signal persists
US Conference Board Consumer Confidence rose from 93.0 to 97.2 in July, beating expectations of 95.9. Expectations Index climbed 4.5 points to 74.4, signaling a slight improvement in sentiment about future conditions, but remained below the critical 80 threshold, a level typically associated with looming recession risk. Meanwhile, Present Situation Index dipped -1.5 points to 131.5, suggesting consumers’ views on current conditions remain broadly steady.
Stephanie Guichard of The Conference Board noted that while overall confidence has rebounded from earlier weakness, it “remains below last year’s heady levels.” She added that improved expectations on jobs, income, and business conditions helped drive July’s uptick.
Fed Likely to Pave the Way for a Rate Cut in September
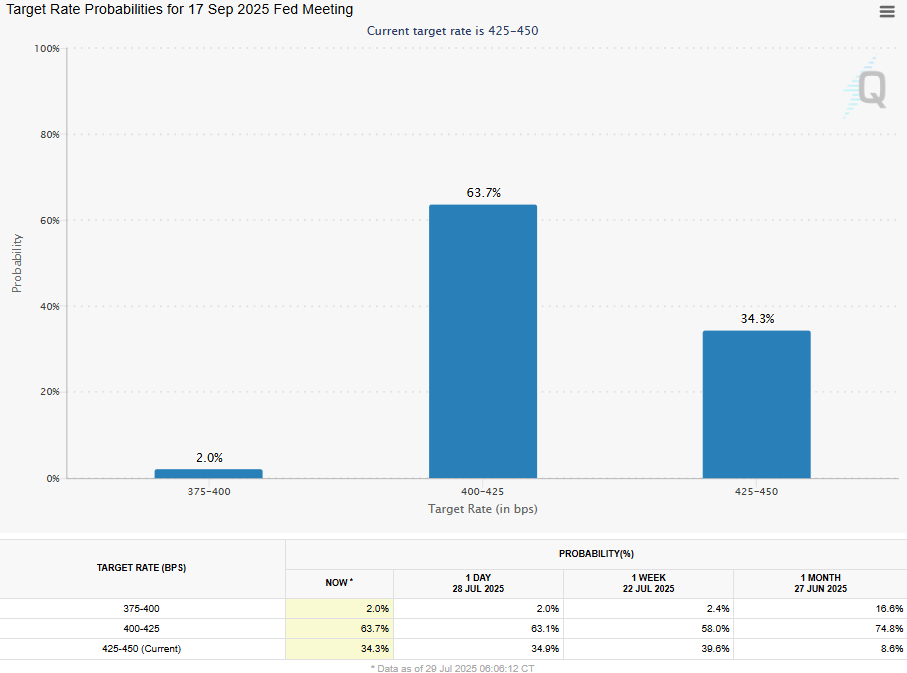
The central event of the current week is the Fed meeting, which has the potential to create significant market movement and set the tone for the coming months. Although there is virtually no chance of a rate cut at the end of July, investors and traders will be closely watching for signals in an attempt to assess the likelihood of policy easing in September.
According to the latest estimates, the futures market is pricing in a 64% chance of a rate cut in September after it was held steady at the end of July. This disposition leaves plenty of room for market expectations to be adjusted, ultimately affecting dollar market dynamics. The Fed prefers to give clearer hints in advance, changing its official commentary at least one meeting in advance. Wednesday’s decision promises to be a compromise between the three camps.
The doves prefer to cut now, noting the deterioration in the private sector employment situation. Two FOMC members have publicly voiced this position.
The largest camp of centrists is open to easing policy later this year. However, they want two more inflation reports confirming the slowdown.
There is also a small camp of hawks who want to see signs of a significant economic slowdown before supporting a rate cut. They note that many years of high inflation may have changed Americans’ perception of the norm. In other words, they fear that inflation is not yet under control.
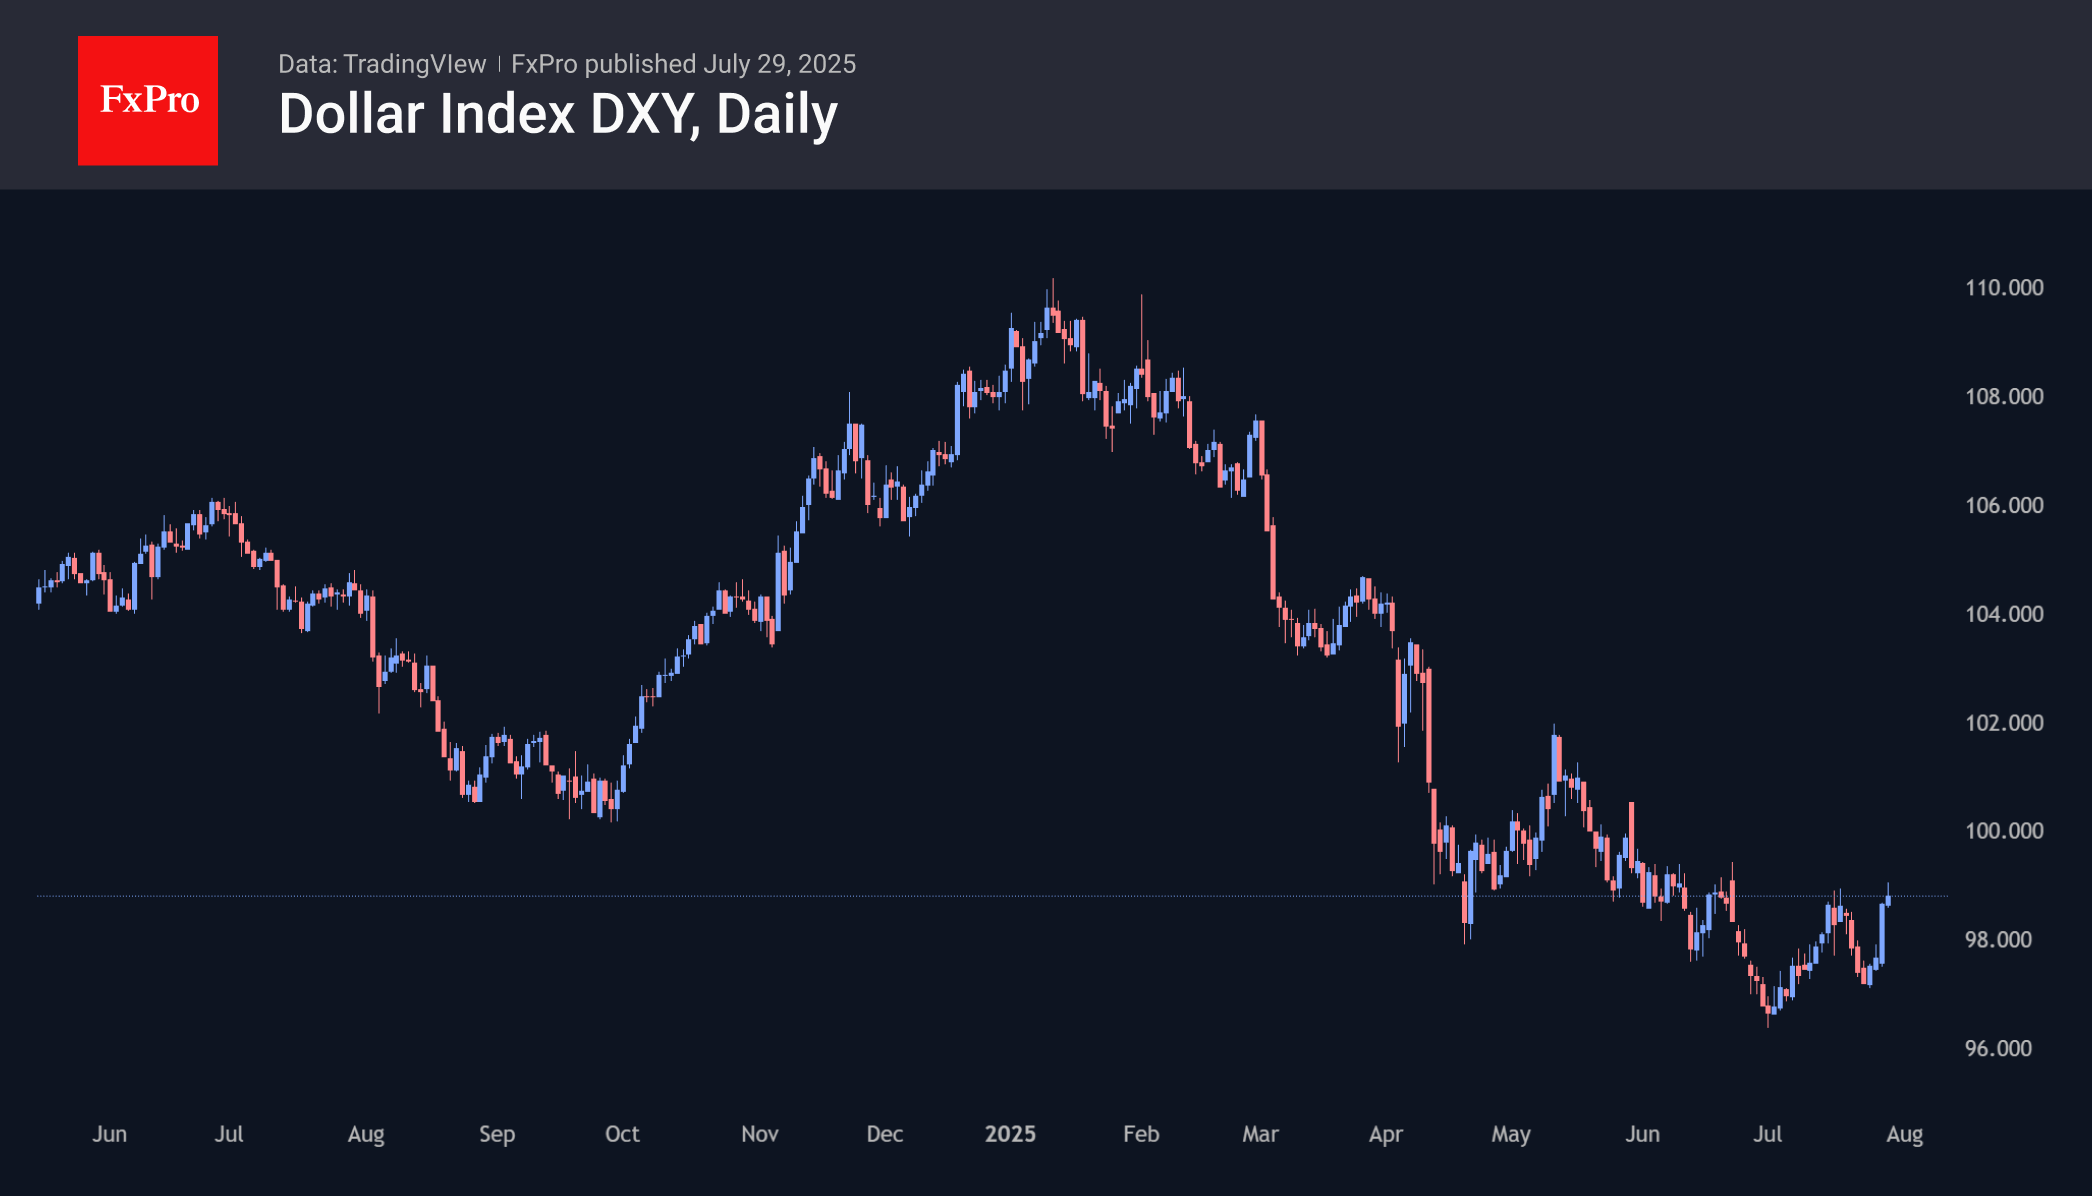
The most rational scenario seems to be preparing the markets for a rate cut in September, which could be met with a positive reaction from the debt and stock markets. For the dollar, this looks like a relatively neutral scenario, given its significant oversold condition.
However, a hawkish surprise could force a reassessment of expectations for the September or year-end rate. In this case, the stock and bond markets risk a sell-off, and the dollar will accelerate its growth.
There is also room for another surprise, such as Powell’s sudden resignation or a mention of his readiness to do so during the subsequent press conference. This would be a real black swan event with unpredictable consequences for the markets, where the dollar promises to be the main loser now.