Sample Category Title
Retreating from the Ceiling Again, Gold Risks Correction
Concerns about the trade war between the US and the European Union and the retreat of platinum group metals allowed gold to break above the upper limit of the medium-term consolidation range of $3250-3400 per ounce. However, the White House’s trade agreement with Japan and the reduction of import duties on Japanese goods brought gold back to the centre of the latest consolidation range.
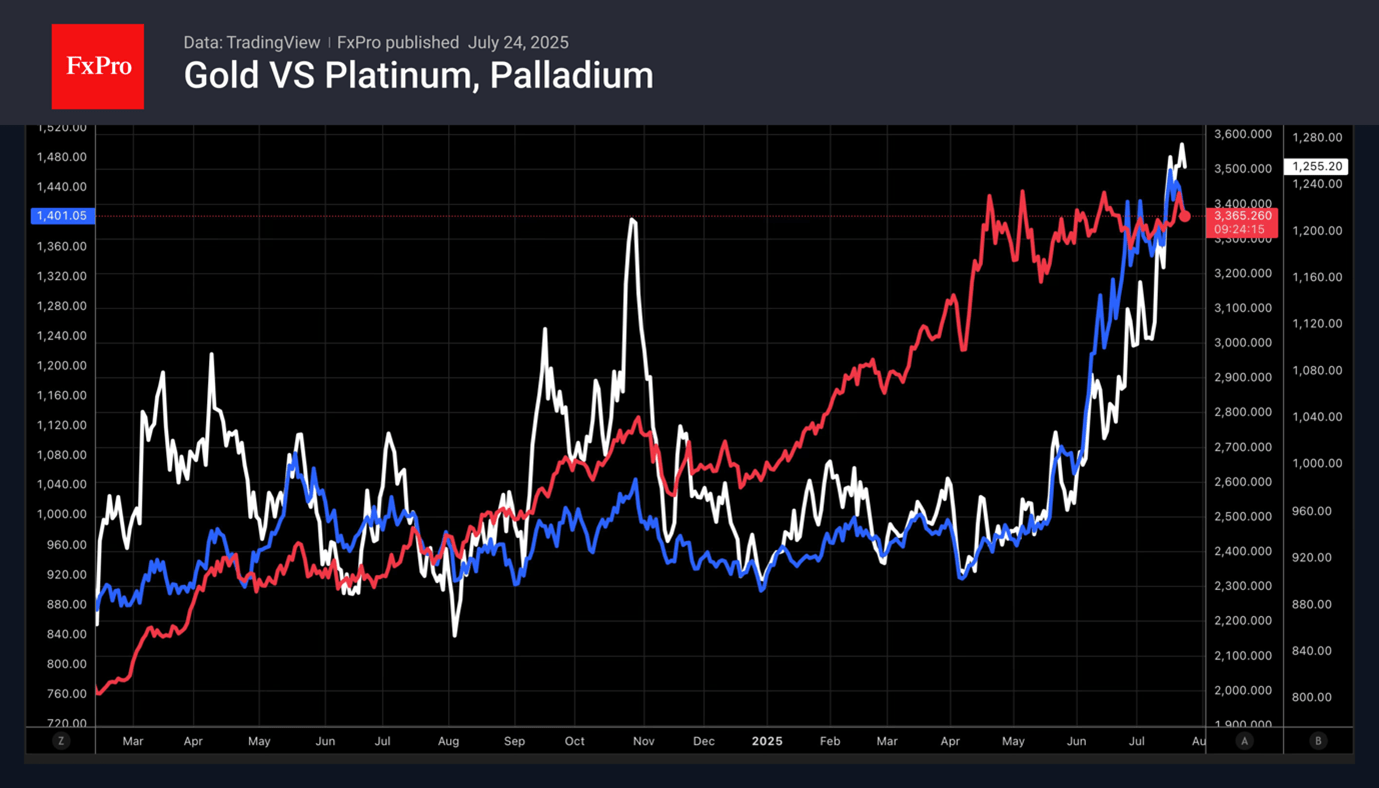
Platinum and palladium, which showed impressive results in 2025, were the main beneficiaries of rumours that gold was overbought. Investors diversified their portfolios in favour of less expensive metals. However, due to the high share of demand from the automotive industry, platinum group metals are highly sensitive to tariffs. A reduction in import duties could restore the upward trends and put pressure on gold against the background of renewed capital outflows.
The leader of the precious metals sector is also vulnerable due to expectations of a reduction in the federal funds rate. The futures market forecasts 1-2 acts of monetary expansion in 2025 and is confident of three in 2026. The sooner the Fed begins to ease monetary policy, the better for gold.
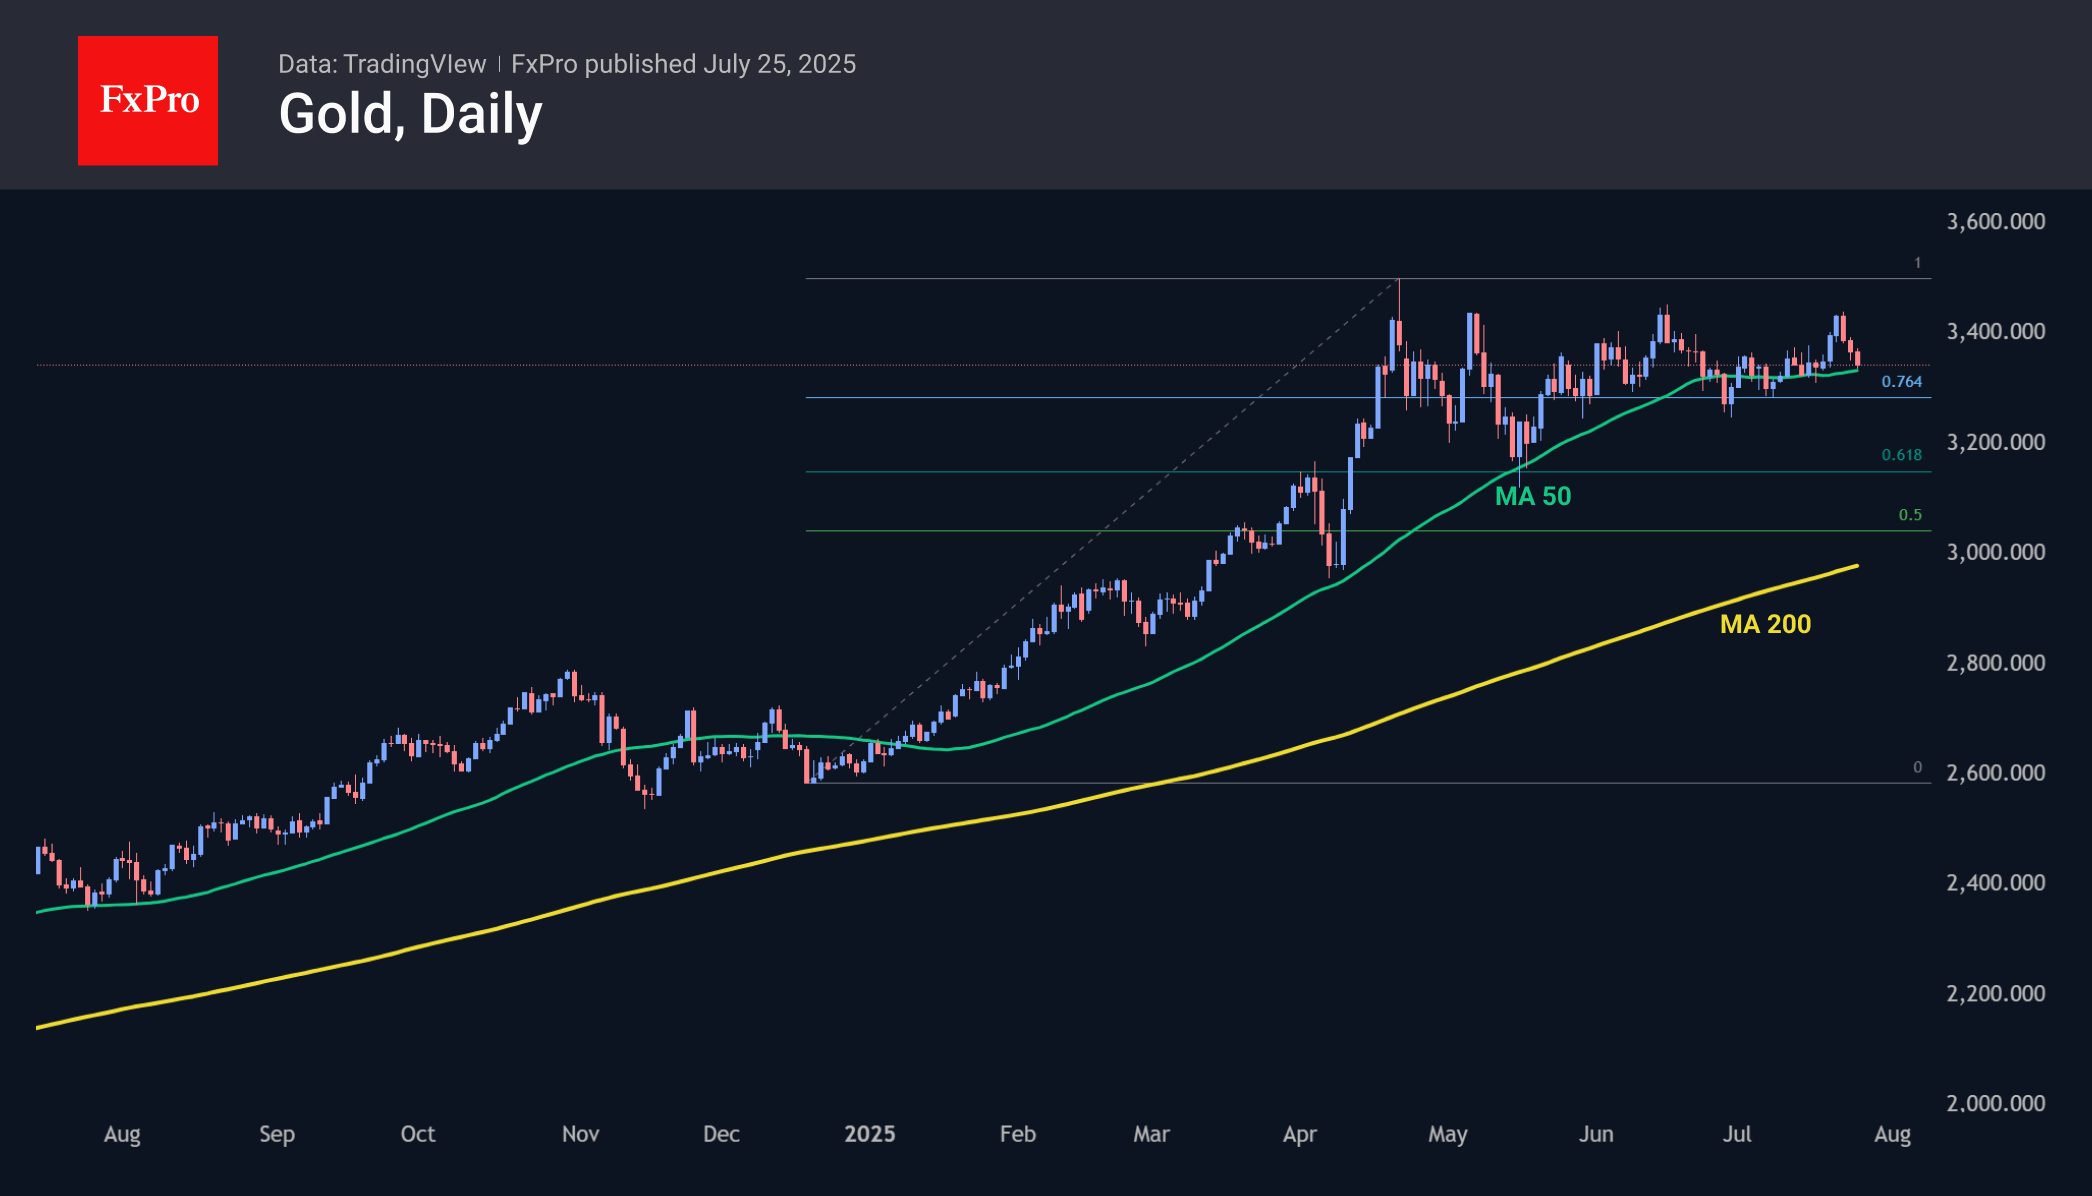
At the same time, gold failed to consolidate above $3,450 for the fourth time since April. On the one hand, this is a sign of abundant supply at highs and the desire of players to close their long positions in gold, looking for alternatives. On the other hand, gold has been benefiting from strong catalysts this year: it was the first of the popular exchange-traded instruments to return to new highs after the shock of Trump’s tariffs, and in recent weeks it has been rising in line with the recovery in risk appetite.
By the end of the week, the price of gold had fallen back to its 50-day moving average. A sharp drop below this line in the new week will be an important signal of a transition from consolidation to correction — roughly what we are seeing with Bitcoin at the end of this week. If gold moves into a correction, there is potential for a rapid move to $3,150 or even $3,050. The upper target is the area of highs before the ‘liberation day’ and 61.8% of the rally since the end of last year. The lower target is already close to half of this growth and not far from the 200-day moving average.
Bank of Canada Poised to Hold Rates Steady, Unveil New Projections
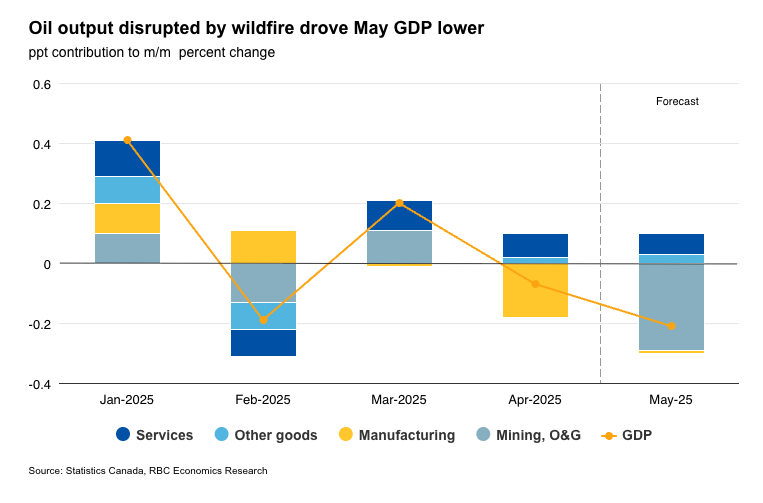
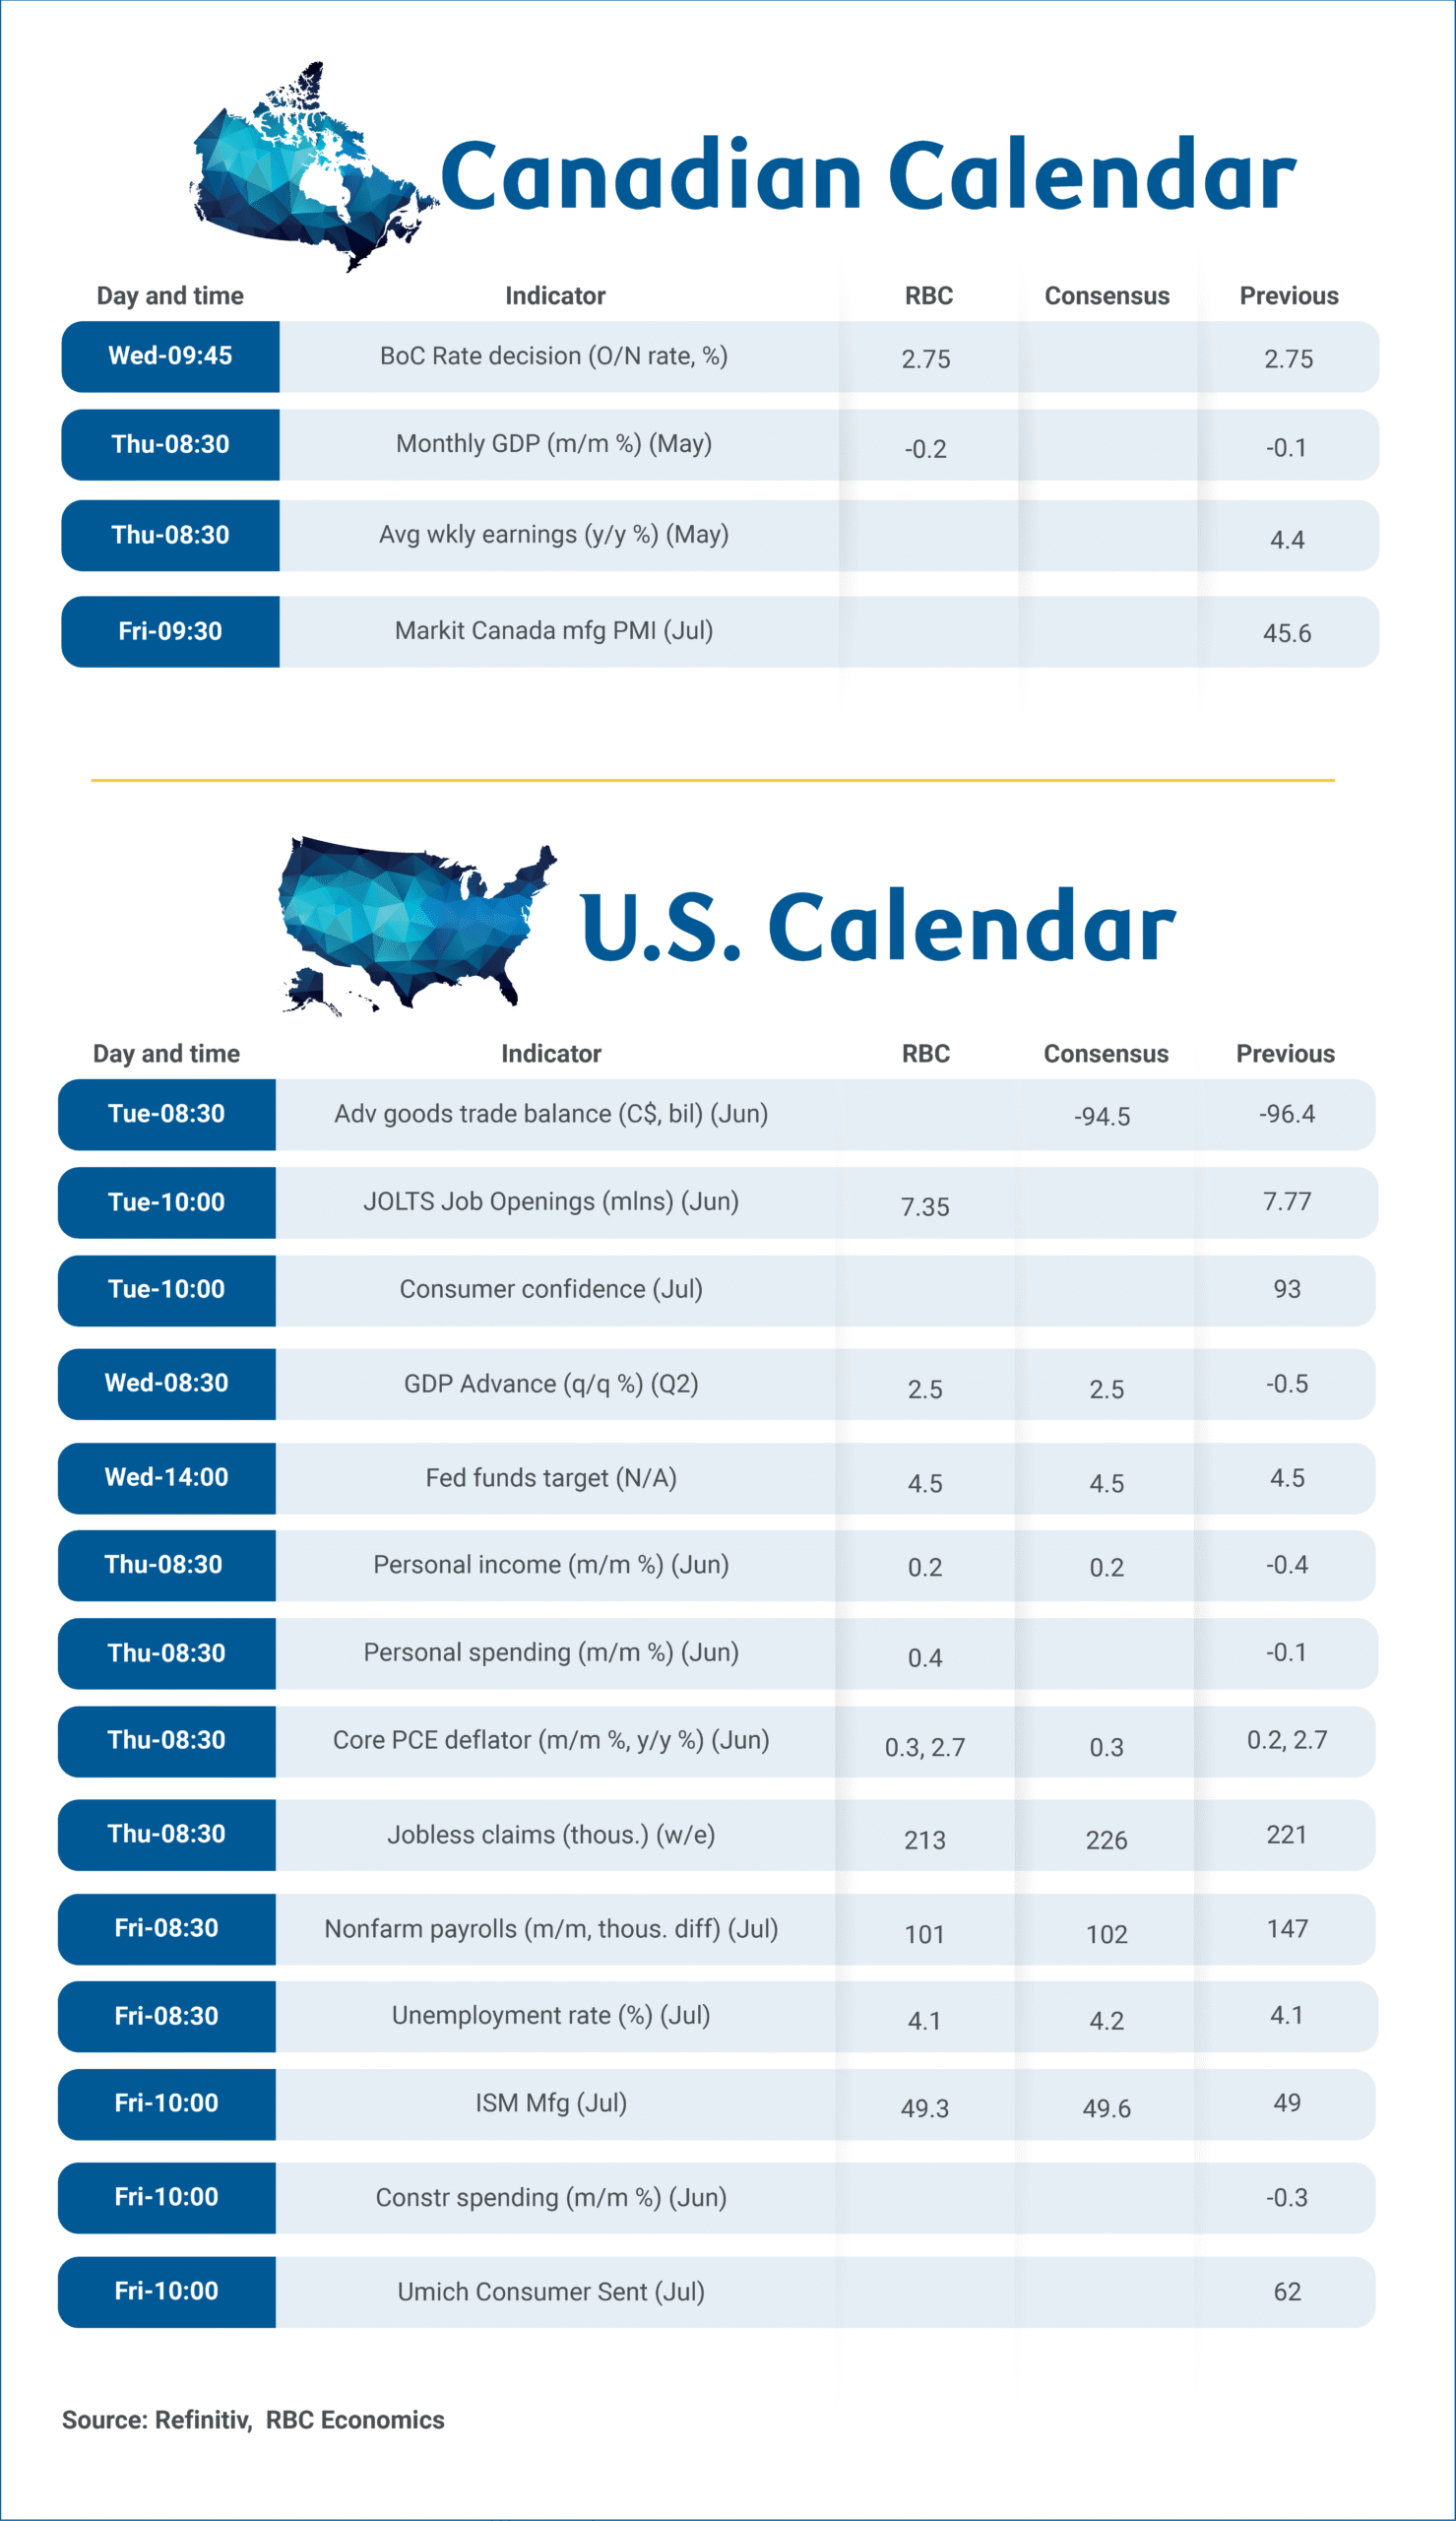
We’re expecting the Bank of Canada to leave the overnight rate unchanged again on Wednesday, while Thursday’s May’s gross domestic product (GDP) report for Canada will likely show a larger 0.2% decline, though most of it is expected to have reversed in June.
Manufacturing activity likely remains soft from ongoing trade disruptions, but we expect the bulk of May’s GDP decline could be attributed to a sharp decline in oil production, as wildfires in Alberta significantly disrupted operations.
Retail activity was also soft, dragged down by lower auto sales that reversed earlier gains in March and April when consumers pulled purchases forward to front-run tariffs.
Losses from both factors – lower retail purchases and oil production – are expected to have at least partially recovered in June. Statistics Canada’s preliminary estimate was for a 1.6% increase in nominal retail sales in June following the 1.1% May decline. Additionally, rebuilding efforts following natural disasters could also have supported GDP growth in other sectors.
On a quarterly basis, Q2 GDP growth is tracking close to flat— aligning with the more optimistic of the two scenarios the BoC projected in its April forecast. In its last Monetary Policy Report, the central bank took the unusual step of not providing a base case growth forecast but scenario analysis, given the enormous uncertainty tied to international trade at the time.
We’ll be watching Wednesday’s MPR closely for new projections but don’t expect any surprises regarding the decision to hold the overnight rate steady. The BoC has remained on the sidelines for the past two meetings after cutting the overnight rate by 225 basis points since June 2024.
What’s holding the BoC back?
Trade tensions remain heightened and economic data is still soft. However, the Canadian labour market showed signs of bottoming out in June, and sentiment indicators, which took a nosedive in March, have also partially recovered.
Critically for Canada, CUSMA exemptions are allowing the vast majority of Canadian goods exports to enter the U.S. duty-free. Echoing business reports from the latest BoC outlook survey, we continue to consider the most severe economic scenarios as less probable than earlier in spring, and expect the economy will remain soft over the second half of this year but won’t contract.
More unnerving for the BoC are recent inflation reports that have surprised broadly to the upside. Its preferred core measures have edged higher in 2025, driven mostly by building pressures among domestic services components. This contradicts earlier expectations that softening in domestic demand would lead to further disinflation and easing in core inflation.
Overall, sticky inflation readings, a weakening but relatively resilient economic backdrop and prospects for larger fiscal spending are reasons why we do not expect the BoC will cut again in this cycle.
Week ahead data watch:
Job vacancies in May’s Canadian Survey of Employment, Payrolls, and Hours (SEPH) data on Thursday will be analyzed for signs of softening in the labour market. Alternative job openings data from Indeed.com have stabilized in the summer after declines earlier in the year.
The U.S. data calendar is also crowded next week. U.S. Q2 GDP On Wednesday is expected to show an annualized increase of 2.5%, reflecting in part the reversal of a statistical quirk that distorted trade and inventory figures in Q1. The Fed meeting that afternoon is expected to maintain current rates and otherwise uneventful Friday's July payrolls data is forecast to show a moderately slower but still robust pace of job growth. The unemployment rate from the separate Household Survey is expected to have remained unchanged at 4.1%.
Is S&P 500 Losing Steam?
This week saw one of the most mixed price action towards the newly formed all-time highs for the 500 best US Companies – The ongoing opening bell is not showing much juice to retest the overnight highs and other global indices are also correcting on the session.
The Earnings season has been more than decent but looking at the price action, buyers seem to have come to an exhaustion point.
Despite a Daily Golden Cross leading to 11 consecutive new highs, the price discovery for the S&P looks to be stalling at a key zone of interest, coming short of the 6,400 psychological level for both the CFD and actual Index.
Many of the best performing assets in the year have started to form local tops: looking at the strong retracement in Gold, Bitcoin, the freshly formed Double top in the Nasdaq that sellers are starting to lean up on and the Dow Jones just retesting its ATH just yesterday without breaching the level.
This week had some decently positive news that could have boosted momentum for equities further such as Trump confirming he won't fire Jerome Powell and the finalized US-Japan Trade Deal.
Positioning and Sentiment at an extreme
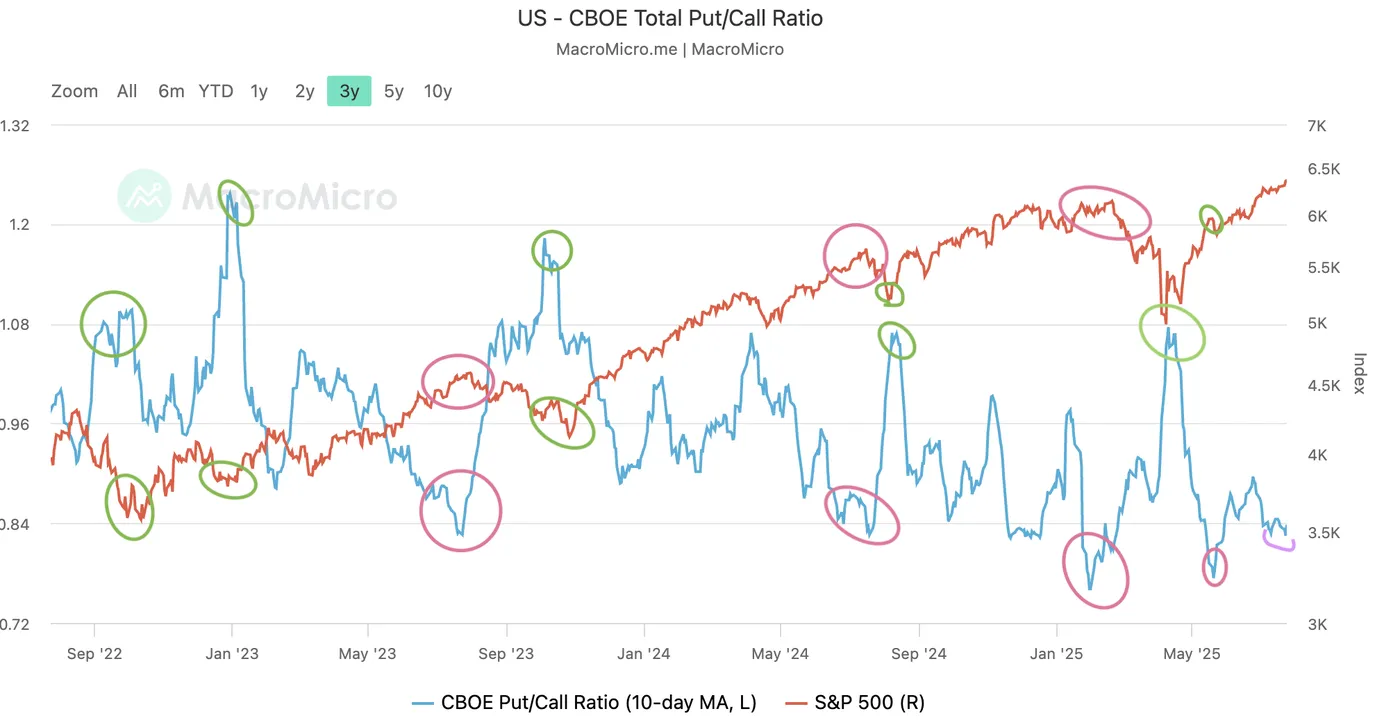
S&P 500 and CBOE Put/Call Ratio – July 24 2025 – Source: MacroMicro
Wherever you look, Market participants mention how strong the ongoing US Trend is and how such strong momentum cannot be faded – This is far from an invitation to sell highs but to trade with more caution looking ahead.
The S&P 500 Put/Call Ratio is coming at a trough and such positive & negative spikes tend to coincide with some tops, particularly amid extreme Fear/Greed levels.
I remember the 2022 Bear Market concluding on an extreme put ratio against calls – The trough isn't forming such a spike today but the extremes are close.
S&P 500 Technical Analysis from the Daily to intraday charts
S&P 500 Daily
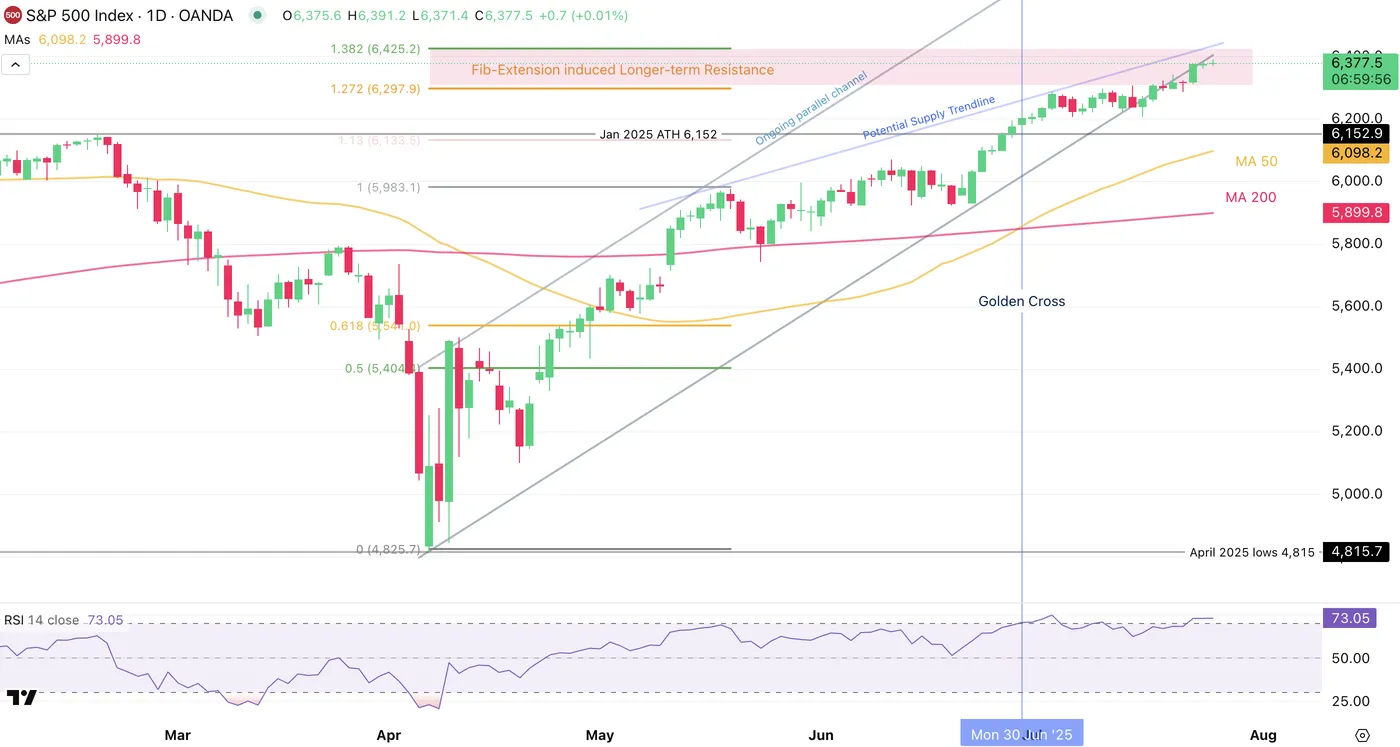
S&P 500 Daily Chart, July 24 2025 – Source: TradingView
The S&P 500 has been flying upwards particularly since the end of the Israel-Iran conflict after forming lows at 5,930.
There hasn't been much selling, with almost no daily candle closing below the prior with this pushing Daily RSI to overbought levels.
Overbought RSI is by definition a standard in such strong trends – Such technical signs don't always traduce with a correction but at least an exhaustion in the move.
You may also take a peek at the Potential Supply trendline that is not too far from current trading – But a closer look is more than required for further analysis.
S&P 500 4H
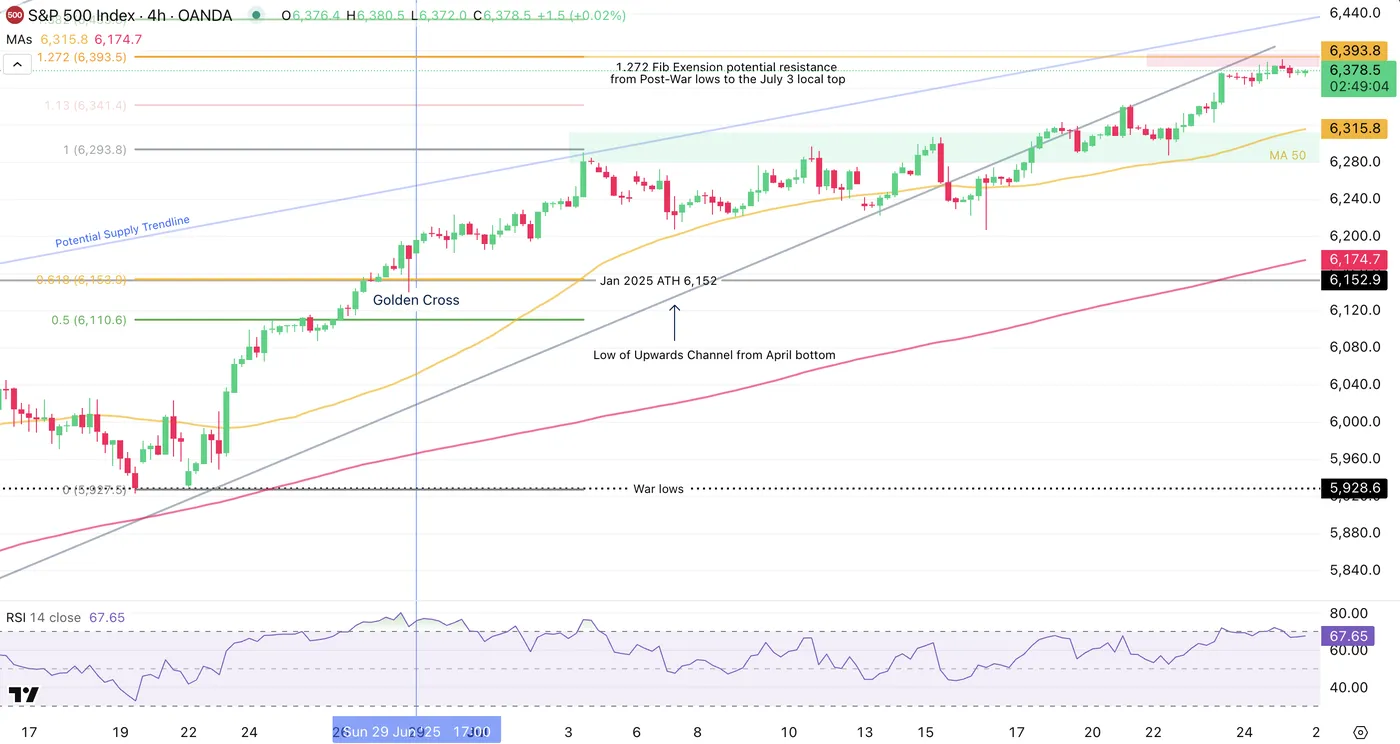
S&P 500 4H Chart, July 24 2025 – Source: TradingView
Looking closer, we can spot candles that are looking less strong particularly as buyers are stepping against the 1.272 Fib-Extension from the War lows to the July 3 Local top.
Momentum is currently retracting from overbought and momentum is starting to become slightly more neutral.
Buyers will want to re-enter above the longer-run upwards Channel formed with the April 2025 bottom and will need to breach the current highs on strong momentum – Local CFD Highs at 6,391, Index at 6,381.
S&P 500 1H Chart
Looking even closer, buyers haven't given up just yet, especially with RSI momentum not breaching the neutral line.
Except for the higher timeframe warning signs, holding above the 1H-MA 50 still give the short-term hand to the bulls, but they will have to break the last swing highs to gain further traction.
Levels of interest to place on your charts:
Support Levels:
- Mini-Support and 50-H MA 6,370
- 200-H MA 6,315
- Key Support 6,300
- Past week lows 6,230
Resistance Levels:
- 6,390 to 6,400 Current highs resistance
- Potential Resistance at Fib extension 6,420
- Level to breach for new ATH 6,391
Safe Trades!
Lower Global Trade Uncertainty Supports Risk Appetite
US dollar
The US has signed agreements with Japan, Indonesia and the Philippines. Tariffs range from 15% to 19%. Tokyo has secured a reduction in import duties on cars from Washington from 25% to 15%. Looking at this deal, the European Union also wants to get 15% tariffs. Brussels does not intend to activate the anti-coercion mechanism and respond with reciprocal duties of €100 billion.
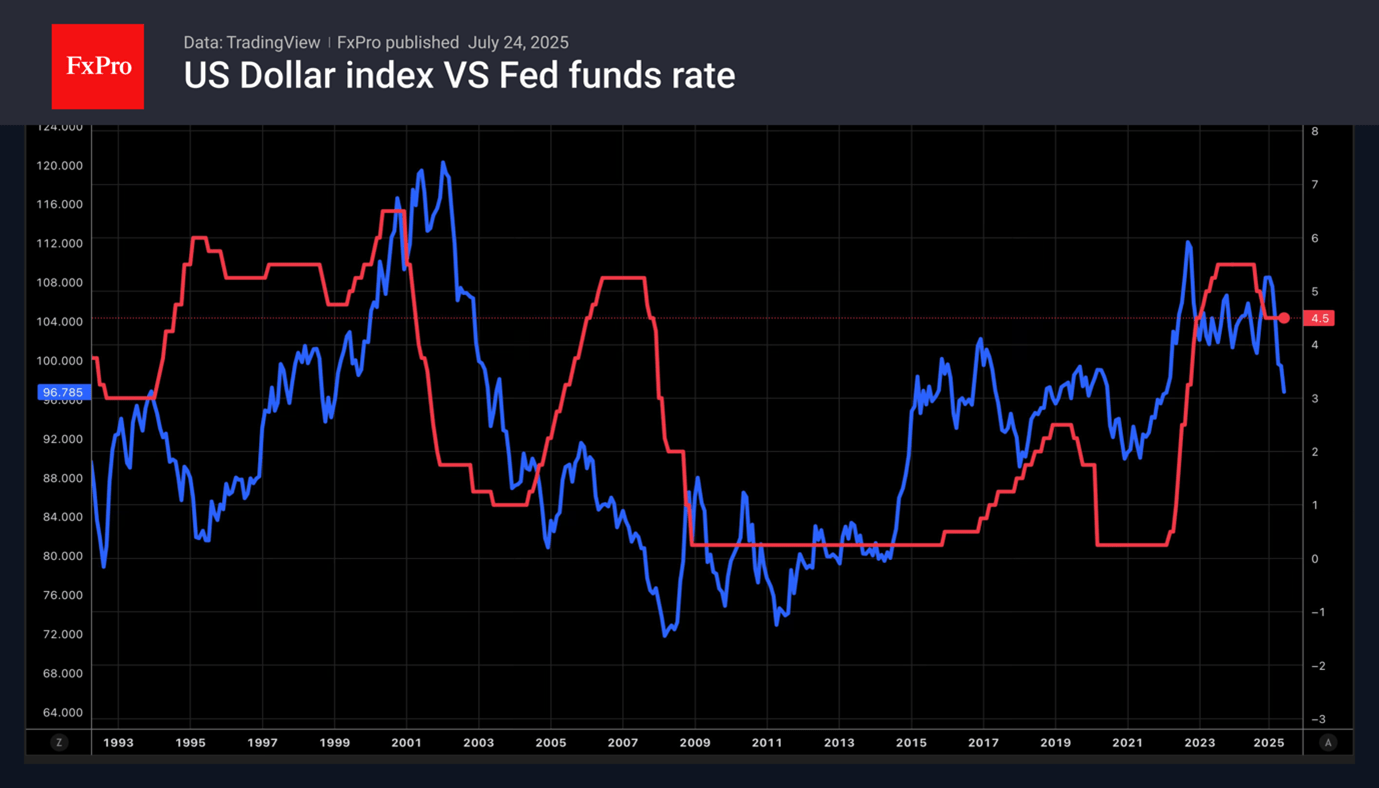
The reduced risk of a large-scale trade war between the US and the EU is increasing global risk appetite and putting pressure on the US dollar as a safe-haven asset. At the same time, the reduction in trade uncertainty is giving the Fed a free hand to ease monetary policy. A sharp cut in the federal funds rate may happen sooner than expected, contributing to the dollar’s decline.
The futures market expects an acceleration of easing in 2026 due to Jerome Powell’s departure from the Fed chair. Donald Trump should choose the nominee, and obviously, it will be a very dovish person who aligns with the president’s opinion. Recently, he demanded that the Fed cut rates by 300 basis points.
Stock indices
The US economy is not falling off a cliff since trade deals are reducing uncertainty. The Fed is moving towards easing monetary policy, and corporate earnings are positive. What else do stock indices need for a rally? The S&P 500 continues to break historical highs and eagerly awaits data from the so-called Magnificent Seven. Analysts expect those companies to report 14% profit growth compared to just 3% growth for the other 493 companies in the broad stock index.
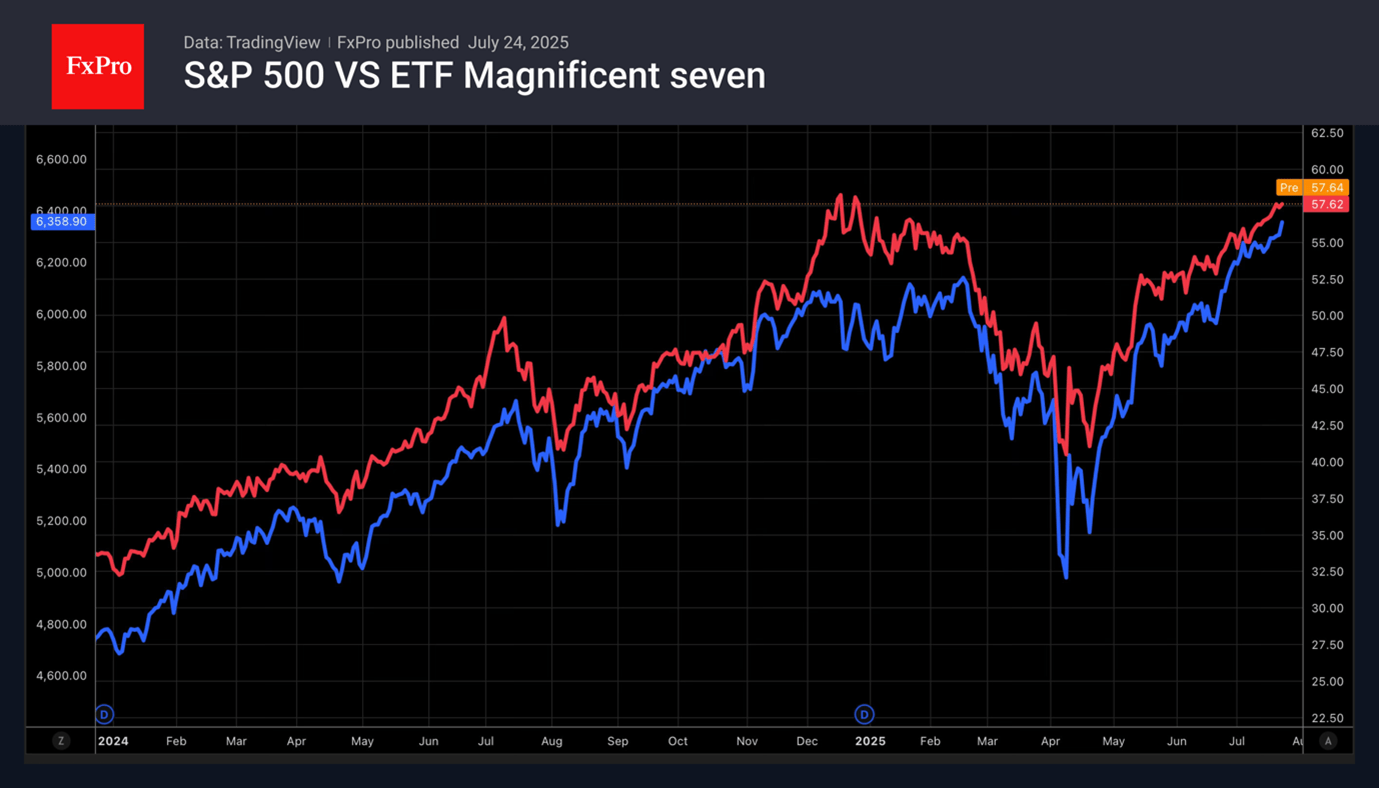
So far, actual data for the second quarter has been better for 83% of reporting issuers. The average for the last 5 and 10 years is 78% and 75%, respectively. A weak dollar supports the S&P 500. Due to the enormous size of the US domestic market, only 13% of corporate profits come from abroad. Companies included in the broad stock index are more international. For Goldman Sachs, for example, the figure is 28%.
How long will the euphoria last? If tariffs push the US economy toward stagflation, corporate earnings will fall, and the S&P 500 will slide.
XAU/USD: Gold Bears Regained Control and Look for Test of Key Supports
Gold price continues to trend lower for the third consecutive day, deflated by stronger dollar and optimism on signs of progress in US-EU trade talks.
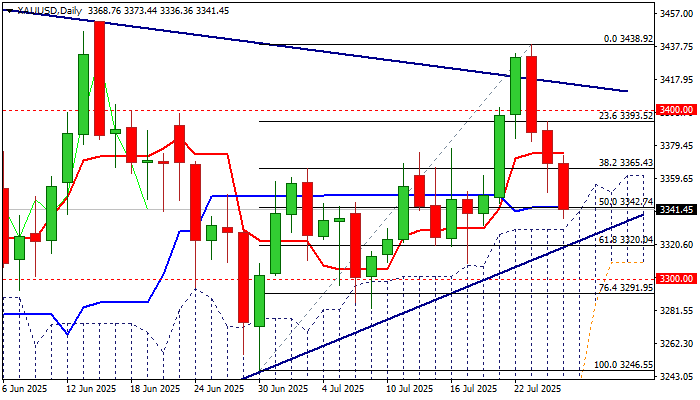
Bears regained control after a double upside rejection and false break above the bear-trendline connecting ($3500 record high and June 16 lower top at $3452) with formation of bearish engulfing pattern on daily chart, providing fresh bearish signal.
Strong acceleration pushed the metal’s price down by over 2.5% in past three days, to retrace over a half of recent $3246/$3438 upleg (Fibo 50% at $3342, reinforced by 20DMA) and approach key support at $3330 (daily Ichimoku cloud top) as rising daily cloud supported the action since mid-Jan and cloud top contained a number of attacks in past two months.
Penetration of daily cloud and violation nearby other pivotal support at $3320 (trendline support / Fibo 61.8%) would sideline larger bulls and risk further losses towards $3300/$3290 zone (psychological / Fibo 76.4%).
Weaker technical studies on daily chart (14-d momentum hits the centreline in attempts to break into negative territory / price fell below 10 and 20DMA’s) support the notion, with formation of weekly Gravestone Doji candle signaling that sellers currently dominate.
However, it will be important to watch reaction at daily cloud top, as cloud still marks very significant support that may limit dips one more time.
Res: 3350; 3365; 3374; 3393.
Sup: 3330; 3320; 3309; 3300.
Sunset Market Commentary
Markets
European bonds extended declines in the wake of yesterday’s ECB policy meeting. President Lagarde sounded pretty optimistic on the economy, saying it perhaps withstood the trade uncertainty better than expected. The comment took markets a bit by surprise since they were discounting another rate cut somewhere later this year. That base case is now seriously put into question, especially against the backdrop of a (rumoured) potential trade deal between the US and EU in the very near future. The classic “Bloomberg sources” at the ECB later hit the wires, saying that those at the Governing Council calling for further cuts face an uphill battle, reinforcing the move. Yields shot up, especially at the front end of the curve. That upward momentum rolled over in today, be it in a bear steepener this time around. Net daily changes vary between +1 and +3.2 bps in Germany, with a slight underperformance vs swap as well as other core areas. US yields eke out around 0-2 bps while UK rates add up to 2.5 bps at the front. The latter is a bit surprising after the recent string of disappointing data that began with yesterday’s PMIs and moved to this morning’s poor UK GfK consumer confidence and lower-than-expected rebound in June retail sales. Similarly striking is the muted response of front-end Japanese yields to news agency Bloomberg citing officials at the Bank of Japan who see a growing case for a rate hike by year-end after the trade deal reduced uncertainty. Markets give it an unchanged probability of around 80%. Both JPY and GBP are today’s underperformers on the FX market. USD/JPY bounces to 147.88, helped higher by a touch of dollar strength as well. EUR/GBP pierces through 0.87 and prepares for an attack of the post-Liberation Day high which more or less coincides with the 50% recovery on the 2022-2024 decline (resp. 0.8738 and 0.8744). GBP/USD, helped with the aforementioned USD strength, is headed for a back-to-back loss, declining to the 1.343 area. EUR/USD (1.172) loses some ground but remains near the multi-year July high.
The all-in-all muted market moves today shouldn’t surprise given the loaded eco and event calendar for next week. It may even start already this weekend with a possible trade agreement between the EU and US. If not this weekend, then probably early next week since Trump’s renewed tariff deadline lapses on Friday, August 1. In the run-up to that, we have US-Sino trade talks starting on Monday, European inflation prints as well as US and Eurozone Q2 GDP numbers. Friday’s US labour market report will as usual be closely watched for any potential clues regarding Fed rate cuts. Last month’s good edition in any case ruled out such a move at next week’s policy meeting. Fed aside, the Bank of Canada and Bank of Japan also meet. All this happens against the backdrop of the most busiest earnings week.
News & Views
IFO sentiment among German companies has improved somewhat. The index rose to 88.6 in July, up from 88.4 in June. Companies were slightly more satisfied with current business (86.5 from 86.2). Expectations remained largely unchanged (90.7 from a downwardly revised 90.6). Ifo concludes that the upturn in the German economy remains sluggish. The manufacturing index went up (-11 from -13.9) as companies see their current situation as noticeably better. Expectations also brightened further, but incoming orders still lack momentum. Services’ sector business climate deteriorated (2.7 from 3.8). Current business activity was assessed less favorably, while expectations were also revised slightly downward. Trade (-20.2 from -19.2) also weakened due to more pessimistic expectations. The construction subindex rose again (-14.0 from -15.1) on both the current and expected situation.
The IMF today published its 2025 Article IV Consultation with the UK economy. The IMF expects 1.2% growth this year and sees activity improving to 1.4% next year as monetary easing, positive wealth effects, and an uptick in confidence bolster private consumption and offset the drag of trade tensions. Current rise in inflation is seen as temporary due to regulated price increases. Inflation is expected to drop to 2.3% next year. On fiscal policy, the IMF indicates that difficult decisions will likely be needed beyond the medium term to address new expenditure pressures and rebuild fiscal buffers. Short-term the IMF advices a strategy maintaining more headroom so that small changes in to outlook do not compromise assessments of rule compliance. In this respect a once in a year assessment of the self-imposed rules at the time of the autumn budget is preferred rather than twice yearly review.
USD/JPY Mid-Day Outlook
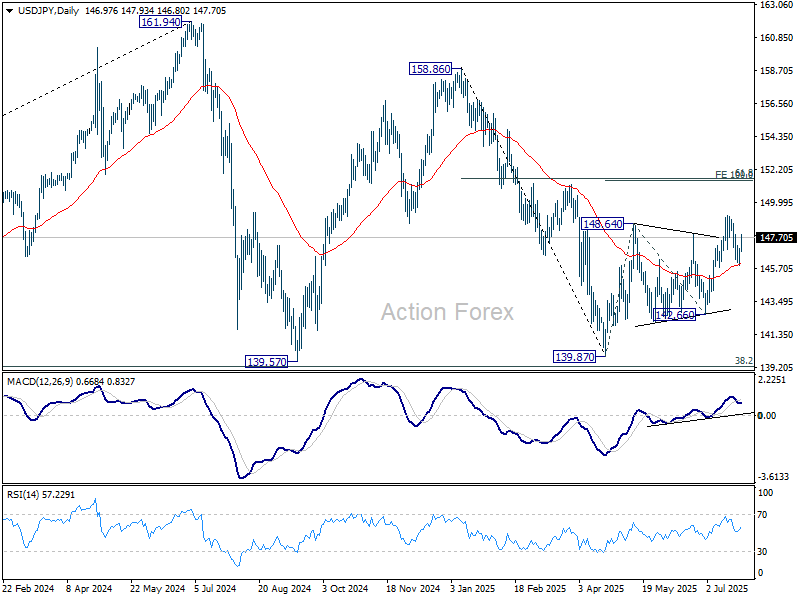
Daily Pivots: (S1) 146.23; (P) 146.63; (R1) 147.39; More...
Intraday bias in USD/JPY remains neutral and outlook is unchanged. As long as 55 D EMA (now at 145.97) holds, further rally is still expected. On the upside, above 147.94 minor resistance will bring retest of 149.17. Firm break there will target 100% projection of 139.87 to 148.64 from 142.66 at 151.43. That is close to 61.8% retracement of 158.86 to 139.87 at 151.22. However, sustained trading below 55 D EMA will argue that the whole rebound from 139.87 might have completed and target 142.66 support for confirmation.
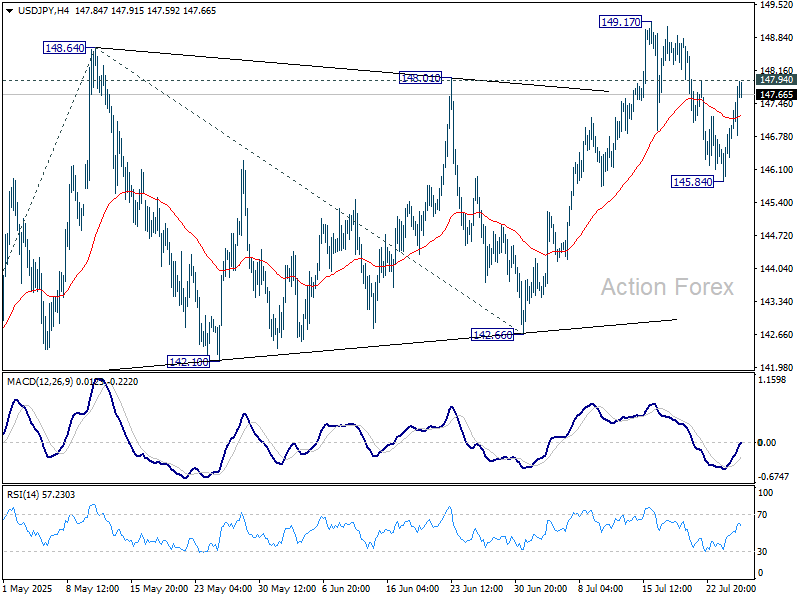
In the bigger picture, price actions from 161.94 (2024 high) are seen as a corrective pattern to rise from 102.58 (2021 low). There is no clear sign that the pattern has completed yet. But still, strong support is expected from 38.2% retracement of 102.58 to 161.94 at 139.26 to bring rebound. in case of another fall.
USD/CHF Mid-Day Outlook
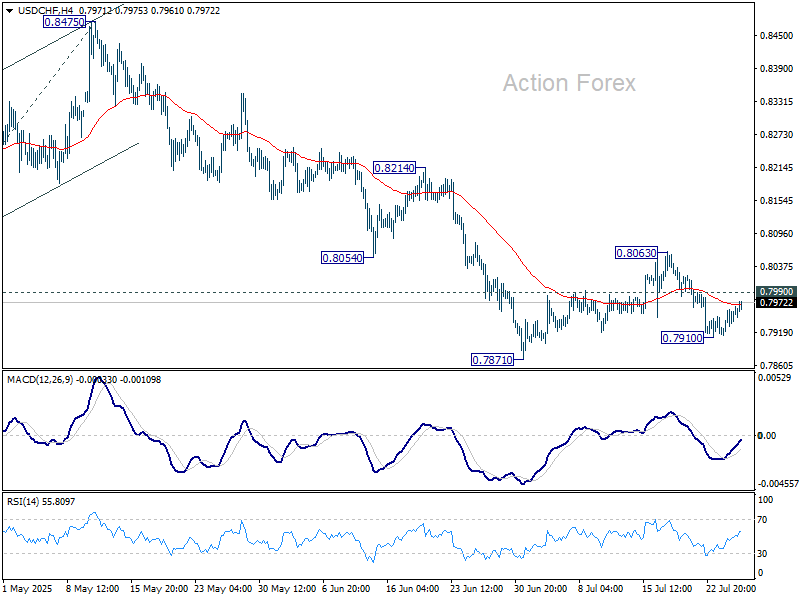
Daily Pivots: (S1) 0.7928; (P) 0.7944; (R1) 0.7973; More….
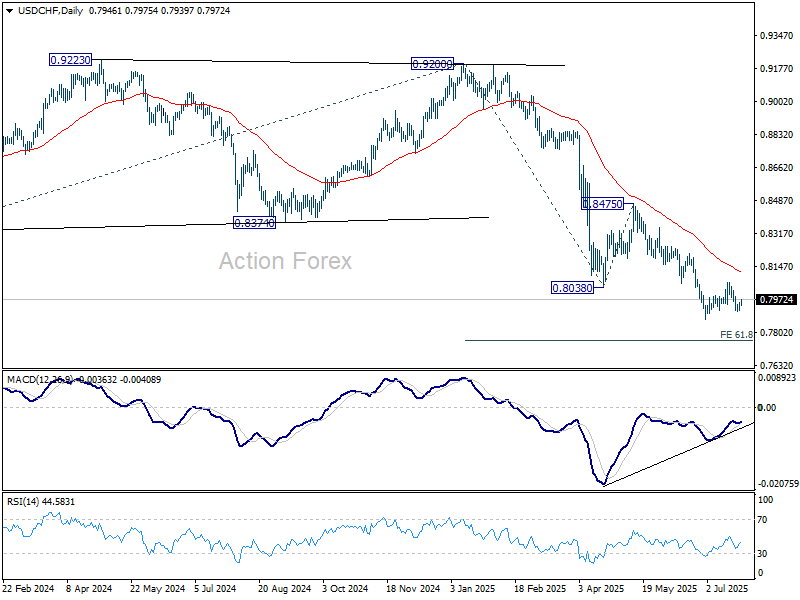
No change in USD/CHF's outlook and intraday bias remains neutral. On the downside, below 0.7910 will bring retest of 0.7871 support. Firm break there will resume larger down trend and target 61.8% projection of 0.9200 to 0.8038 from 0.8475 at 0.7757. On the upside, break of 0.7990 minor resistance will bring stronger rebound to extend the corrective pattern from 0.7871.
In the bigger picture, long term down trend from 1.0342 (2017 high) is still in progress. Next target is 100% projection of 1.0146 (2022 high) to 0.8332 from 0.9200 at 0.7382. In any case, outlook will stay bearish as long as 0.8475 resistance holds.
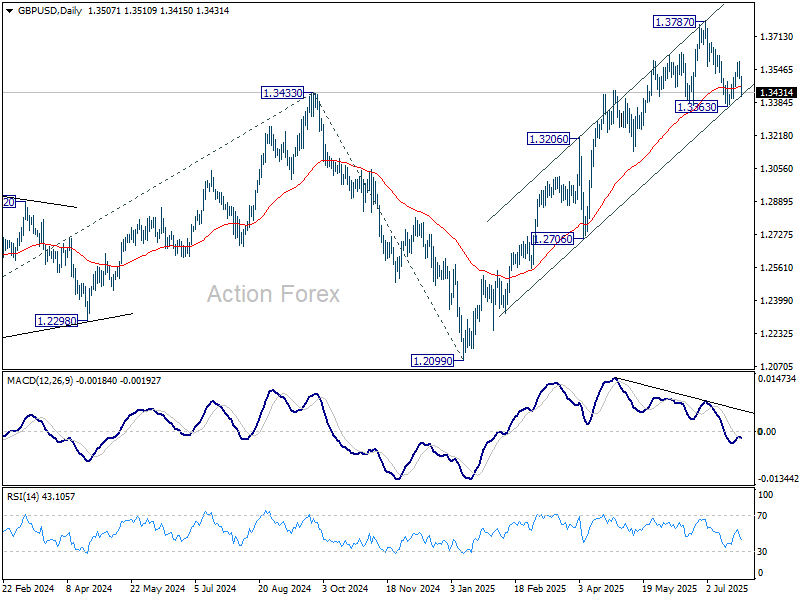
GBP/USD Mid-Day Outlook
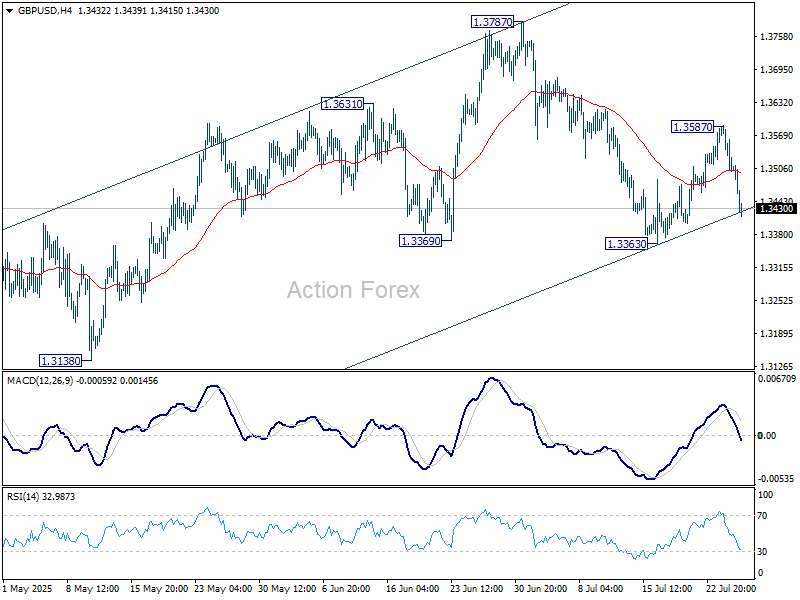
Daily Pivots: (S1) 1.3476; (P) 1.3533; (R1) 1.3562; More...
Intraday bias in GBP/USD remains neutral at this point. Further rise is expected as long as 1.3363 support holds. Above 1.3587 will turn bias back to the upside for retesting 1.3787 first. However, sustained break of 1.3363 will argue that it's already correcting the whole rally from 1.2099, and target 1.3206 resistance turned support.
In the bigger picture, up trend from 1.3051 (2022 low) is in progress. Next medium term target is 61.8% projection of 1.0351 to 1.3433 from 1.2099 at 1.4004. Outlook will now stay bullish as long as 55 W EMA (now at 1.3017) holds, even in case of deep pullback.
EUR/USD Mid-Day Outlook
Daily Pivots: (S1) 1.1723; (P) 1.1756; (R1) 1.1781; More...
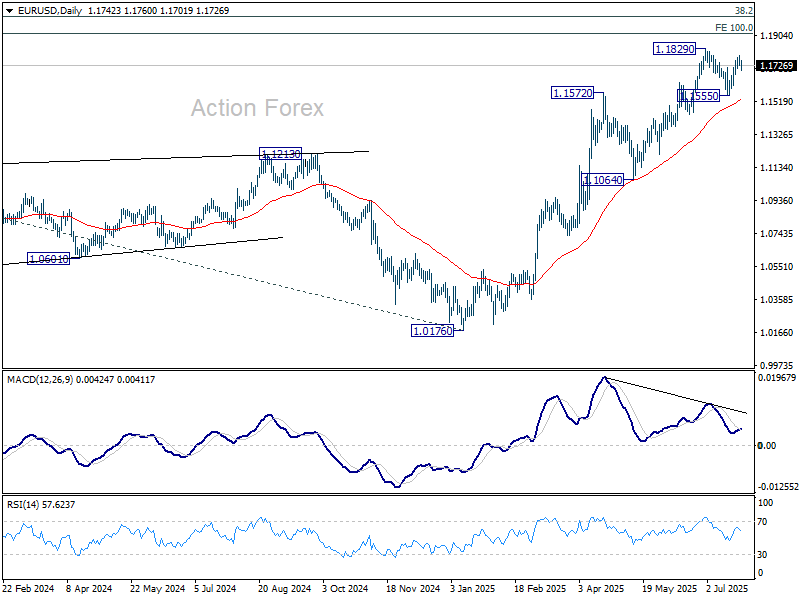
Intraday bias in EUR/USD is turned neutral with current retreat. Further rise is favor as long as 1.1677 minor support holds. Firm break of 1.1829 will resume whole rally from 1.0176, and target 1.1916 projection level. However, break of 1.1677 will turn bias to the downside, and extend the corrective pattern from 1.1829 with another falling leg.
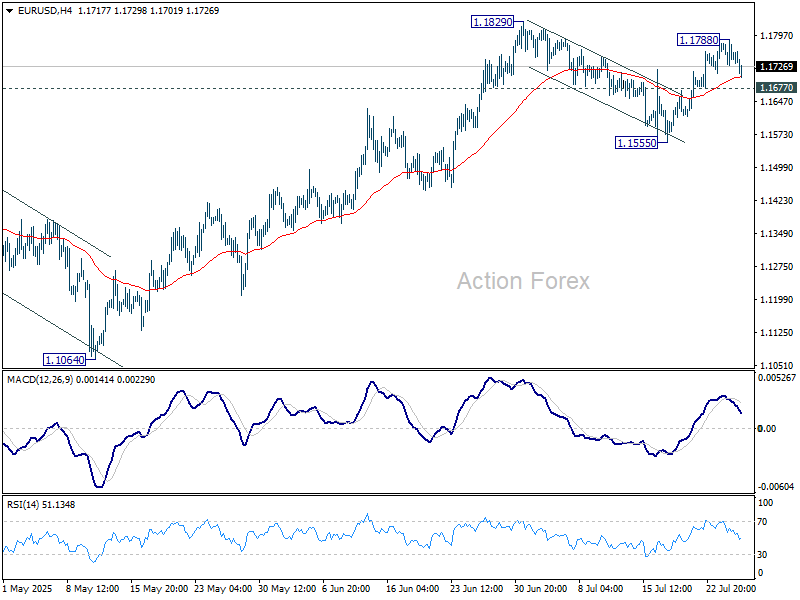
In the bigger picture, rise from 0.9534 long term bottom could be correcting the multi-decade downtrend or the start of a long term up trend. In either case, further rise should be seen to 100% projection of 0.9534 to 1.1274 from 1.0176 at 1.1916. This will remain the favored case as long as 1.1604 support holds.