Sample Category Title
Asia Stock Markets Pull Back as USD Rebounds, Hang Seng Index (Chart of the Day)
A seven-day rally in global equities paused during Thursday’s Asian session, following a mixed overnight performance on Wall Street. The Dow Jones Industrial Average and Russell 2000 slid 0.7% and 1.4%, respectively, while the S&P 500 and Nasdaq 100 pushed to fresh record highs, up 0.1% and 0.3%. Gains were driven by mega-cap tech names including Nvidia (+1.7%), Amazon (+1.7%), Microsoft (+1%), and Alphabet (+0.9%).
Asia’s longest winning streak since January ends
Asia-Pacific markets snapped their longest winning streak of the year. Hong Kong’s Hang Seng Index dropped 0.9% intraday after hitting a 3.5-year high, while Japan’s Nikkei 225 fell 0.9%, just shy of its all-time peak at 42,427. Singapore’s Straits Times Index also saw profit-taking, down 0.3% after a record-breaking 14-session rally.
Profit-taking and the US dollar rebound pressure Asian equities
Today’s Asian regional pullback likely reflects overbought conditions and a technical rebound in the US dollar after a four-day losing streak. The US dollar Index’s intraday firm tone is weighing on risk assets in Asia as traders reassess their short-term bullish momentum.
The worst performers against the US dollar at this time of writing are CAD (-0.17%), AUD (-0.16%), and GBP (-0.13%)
The intraday bounce seen in the US dollar is also reinforced by a slowdown in growth in Japan’s leading inflation gauge, where Tokyo’s core-core CPI (excluding food and energy) advanced at a slower pace of 2.9% y/y in July, a drop from 3.1% recorded in June.
Gold slips further as US dollar firms, support levels in focus
Gold (XAU/USD) declined for the third straight session, falling 0.4% intraday. The yellow metal is now approaching key support at its 20- and 50-day moving averages near US$3,333, amid headwinds from a strengthening US dollar.
Economic data releases
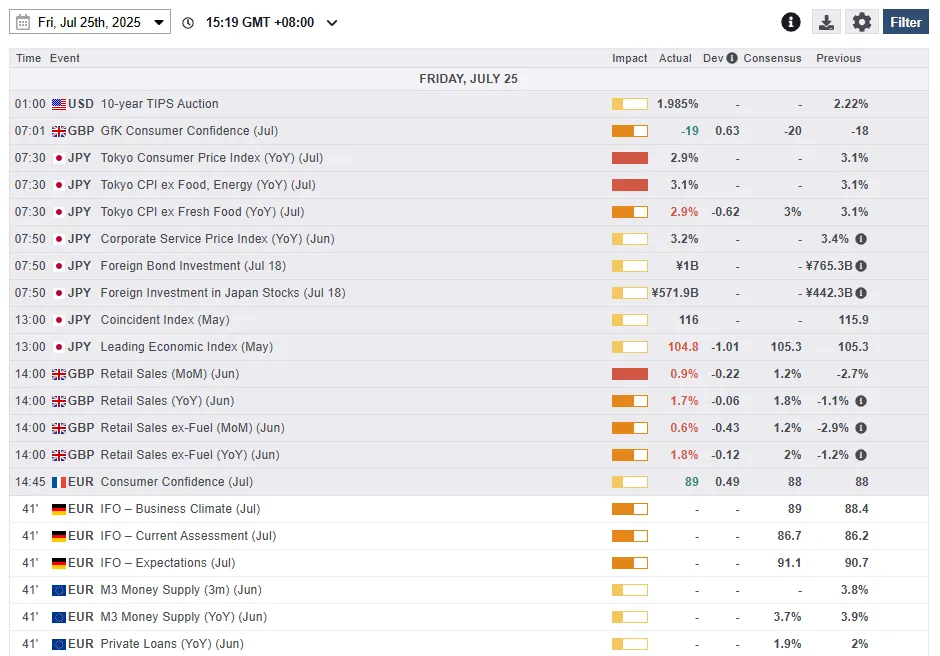
Fig 1: Key data for today’s Asia mid-session (Source: MarketPulse)
Chart of the day – Hang Seng Index at risk of minor corrective decline
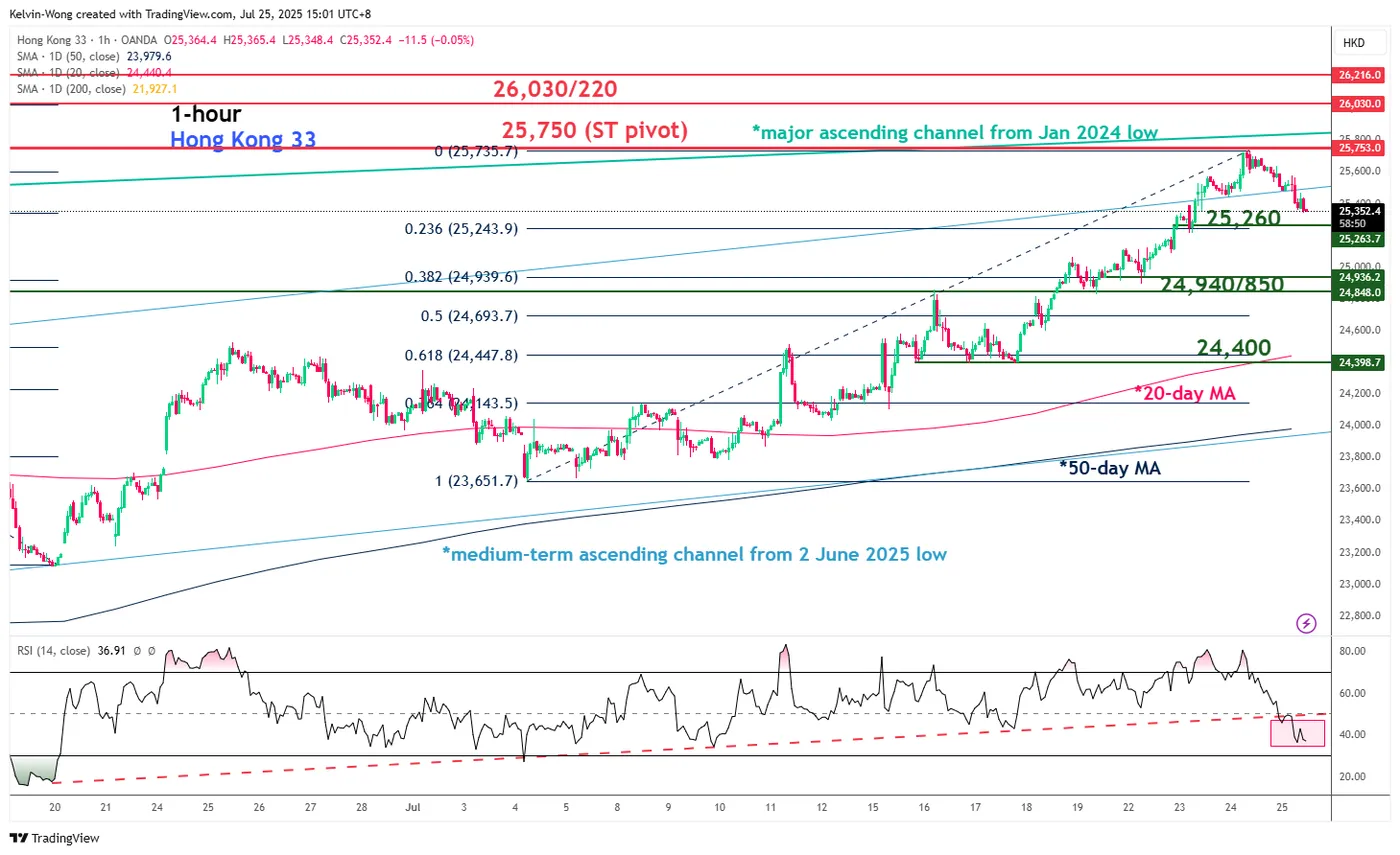
Fig 2: Hong Kong 33 CFD Index minor & medium-term trends as of 25 July 2025 (Source: TradingView)
The price actions of the Hong Kong 33 CFD Index (a proxy of the Hang Seng Index futures) have rallied as expected. Recap our previous Chart of the day – Start of a potential impulsive bullish sequence for Hang Seng Index.
The two weeks of advancement have hit the upper boundary of a major ascending channel from the January 2024 low, now acting as an intermediate resistance at 25,750. The hourly RSI momentum indicator has just staged a bearish breakdown below a parallel ascending support from 19 June.
These observations suggest that bullish momentum has waned, and the Hong Kong 33 CFD Index is likely to stage a potential imminent minor corrective decline to retrace some of the gains seen from the prior rally from the 4 July 2025 low to the 24 July 2025 high (see Fig 2).
Watch the 25,750 key short-term pivotal resistance, and a break below 25,260 may reinforce the minor corrective decline sequence on the Hong Kong 33 CFD Index to expose the next intermediate support at 24,940/850.
On the flipside, a clearance above 25,750 revives the bullish tone for the continuation of the bullish impulsive up move sequence to seek out the next intermediate resistance at 26,030/26,220 (Fibonacci extension and medium-term swing high areas of 20/26 October 2021).
EUR/USD Daily Outlook
Daily Pivots: (S1) 1.1723; (P) 1.1756; (R1) 1.1781; More...
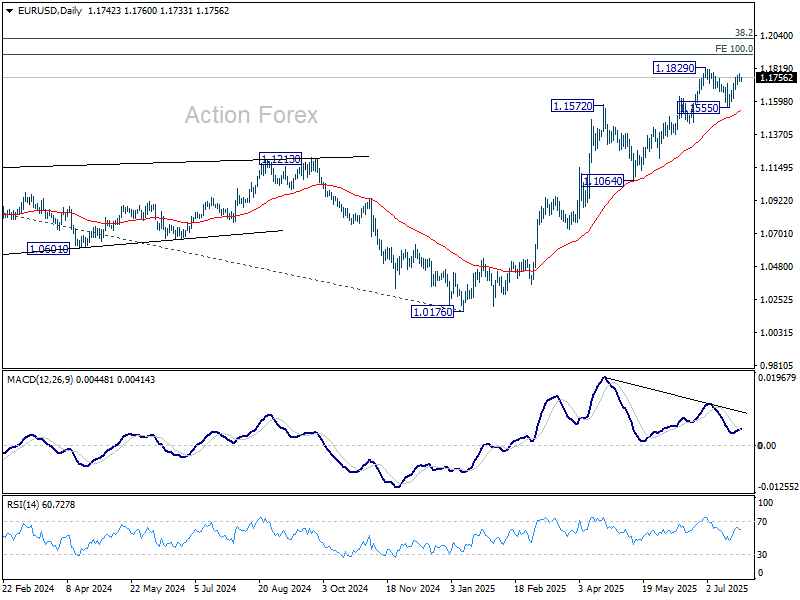
Intraday bias in EUR/USD stays mildly on the upside and rise from 1.1555 would extend to retest 1.1829 high. Firm break there will resume whole rally from 1.0176, and target 1.1916 projection level. However, break of 1.1677 will delay the bullish case, and turn intraday bias neutral, with more consolidations below 1.1829 first.
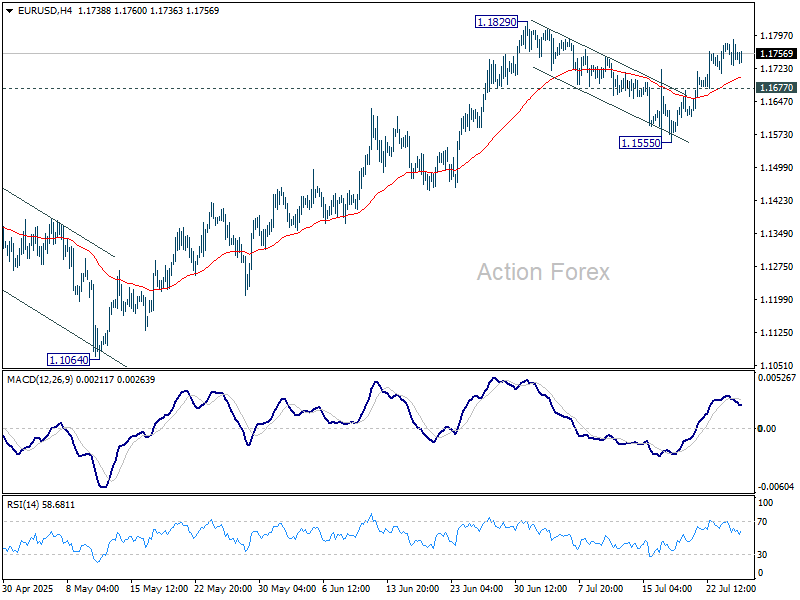
In the bigger picture, rise from 0.9534 long term bottom could be correcting the multi-decade downtrend or the start of a long term up trend. In either case, further rise should be seen to 100% projection of 0.9534 to 1.1274 from 1.0176 at 1.1916. This will remain the favored case as long as 1.1604 support holds.
USD/JPY Daily Outlook
Daily Pivots: (S1) 146.23; (P) 146.63; (R1) 147.39; More...
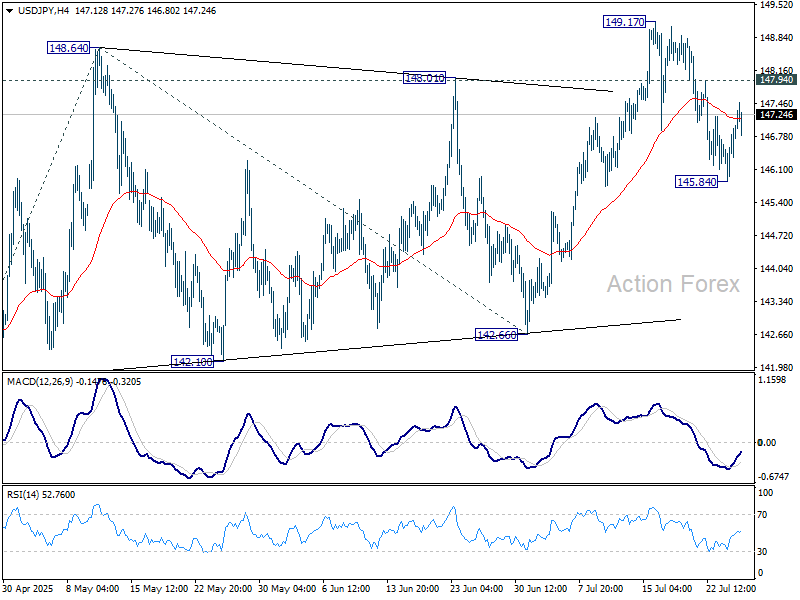
Intraday bias in USD/JPY stays neutral. As long as 55 D EMA (now at 145.97) holds, further rally is still expected. On the upside, above 147.94 minor resistance will bring retest of 149.17. Firm break there will target 100% projection of 139.87 to 148.64 from 142.66 at 151.43. That is close to 61.8% retracement of 158.86 to 139.87 at 151.22. However, sustained trading below 55 D EMA will argue that the whole rebound from 139.87 might have completed and target 142.66 support for confirmation.
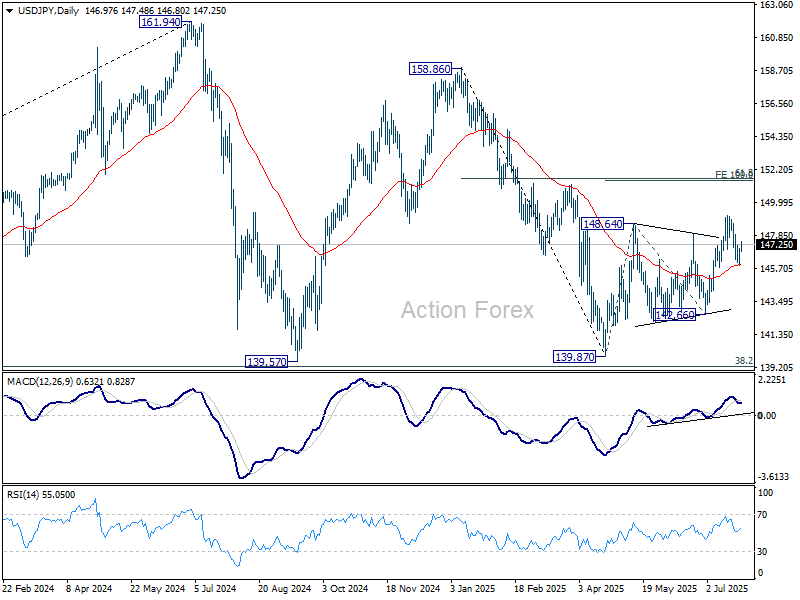
In the bigger picture, price actions from 161.94 (2024 high) are seen as a corrective pattern to rise from 102.58 (2021 low). There is no clear sign that the pattern has completed yet. But still, strong support is expected from 38.2% retracement of 102.58 to 161.94 at 139.26 to bring rebound. in case of another fall.
GBP/USD Daily Outlook
Daily Pivots: (S1) 1.3476; (P) 1.3533; (R1) 1.3562; More...
Intraday bias in GBP/USD stays neutral for the moment, and some consolidations would be seen. Further rise is expected as long as 1.3363 support holds. Above 1.3587 will turn bias back to the upside for retesting 1.3787 first. However, sustained break of 1.3363 will argue that it's already correcting the whole rally from 1.2099, and target 1.3206 resistance turned support.
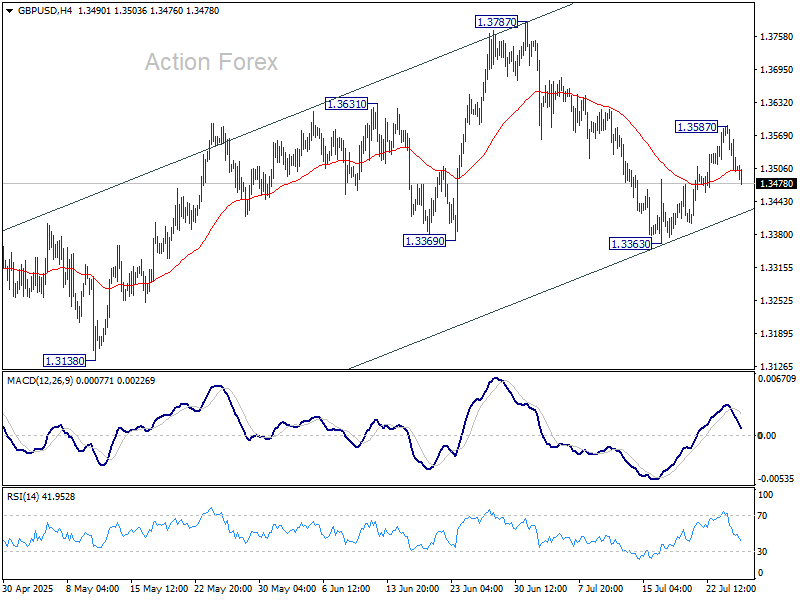
In the bigger picture, up trend from 1.3051 (2022 low) is in progress. Next medium term target is 61.8% projection of 1.0351 to 1.3433 from 1.2099 at 1.4004. Outlook will now stay bullish as long as 55 W EMA (now at 1.3017) holds, even in case of deep pullback.

USD/CHF Daily Outlook
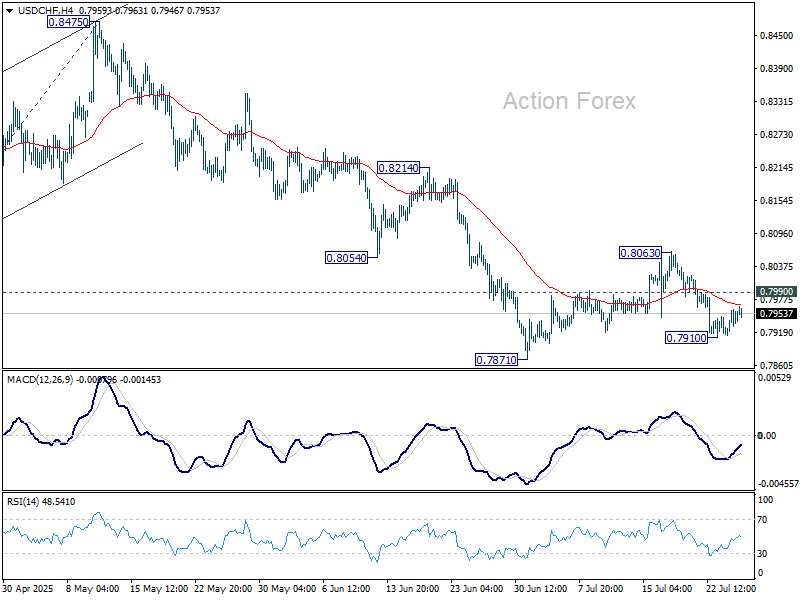
Daily Pivots: (S1) 0.7928; (P) 0.7944; (R1) 0.7973; More….
Intraday bias in USD/CHF remains neutral for the moment. On the downside, below 0.7910 will bring retest of 0.7871 support. Firm break there will resume larger down trend and target 61.8% projection of 0.9200 to 0.8038 from 0.8475 at 0.7757. On the upside, break of 0.7990 minor resistance will bring stronger rebound to extend the corrective pattern from 0.7871.
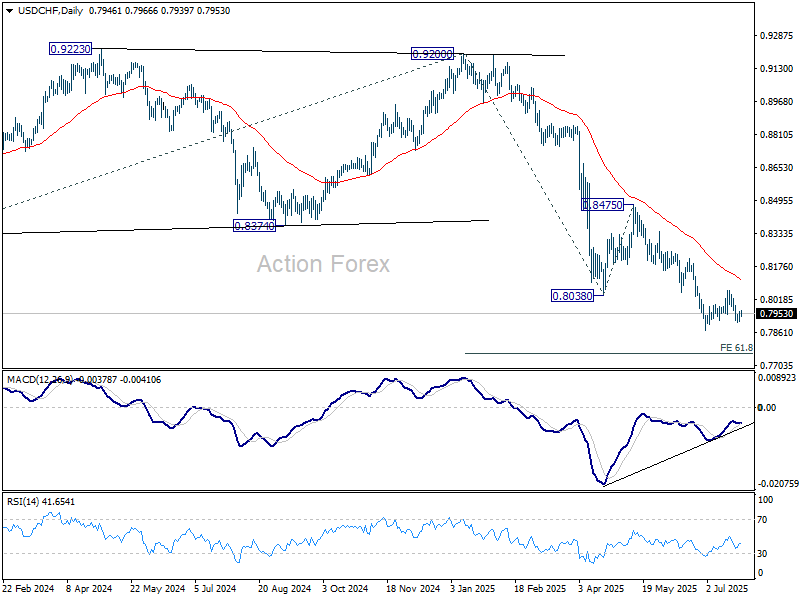
In the bigger picture, long term down trend from 1.0342 (2017 high) is still in progress. Next target is 100% projection of 1.0146 (2022 high) to 0.8332 from 0.9200 at 0.7382. In any case, outlook will stay bearish as long as 0.8475 resistance holds.
AUD/USD Daily Report
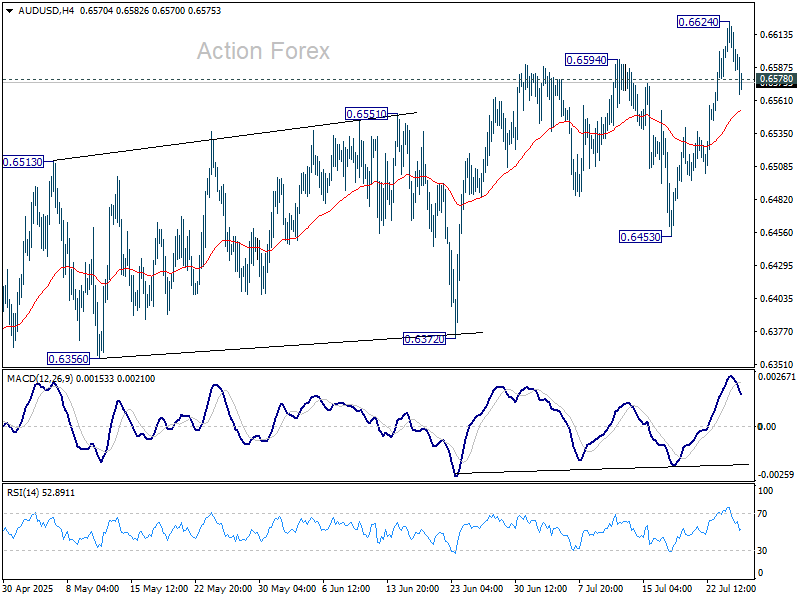
Daily Pivots: (S1) 0.6576; (P) 0.6601; (R1) 0.6615; More...
Intraday bias in AUD/USD is turned neutral first with current retreat. Some consolidations would be seen below 0.6624. But further rally is expected as long as 0.6453 support holds. Break of 0.6624 will resume the rise from 0.5913 towards 0.6713 fibonacci level.
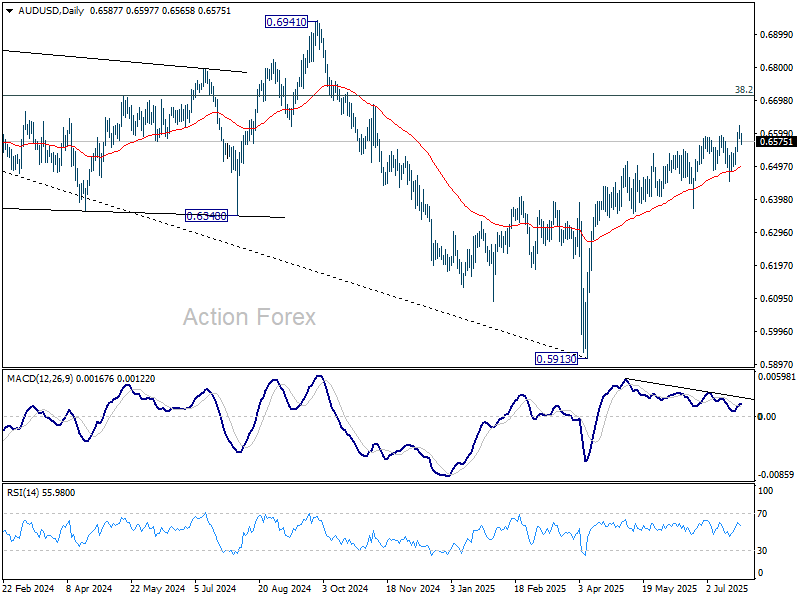
In the bigger picture, there is no clear sign that down trend from 0.8006 (2021 high) has completed. Rebound from 0.5913 is seen as a corrective move. While stronger rally cannot be ruled out, outlook will remain bearish as long as 38.2% retracement of 0.8006 to 0.5913 at 0.6713 holds. Nevertheless, considering bullish convergence condition in W MACD, even in case of another fall through 0.5913, downside should be contained above 0.5506 (2020 low).
USD/CAD Daily Outlook
Daily Pivots: (S1) 1.3602; (P) 1.3628; (R1) 1.3665; More...
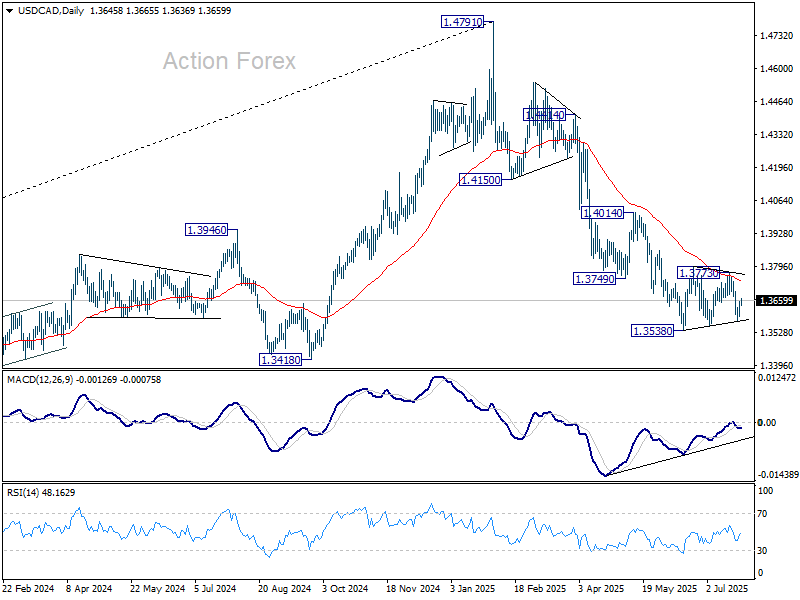
USD/CAD's recovery ahead of 1.3538/3555 support zone and break of 1.3628 minor resistance suggests that consolidation pattern from 1.3538 is extending with another leg. Intraday bias is turned neutral first. Upside of recovery should be limited below 1.3773 resistance. Firm break of 1.3538 will confirm resumption of whole decline from 1.4791.
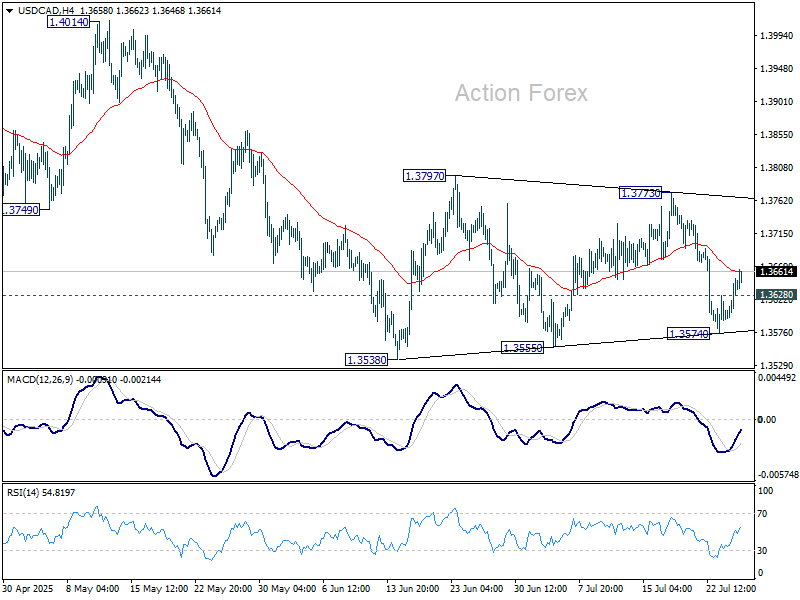
In the bigger picture, price actions from 1.4791 medium term top could either be a correction to rise from 1.2005 (2021 low), or trend reversal. In either case, further decline is expected as long as 1.4014 resistance holds. Next target is 61.8% retracement of 1.2005 (2021 low) to 1.4791 at 1.3069.
EUR/CHF Daily Outlook
Daily Pivots: (S1) 0.9325; (P) 0.9344; (R1) 0.9365; More....
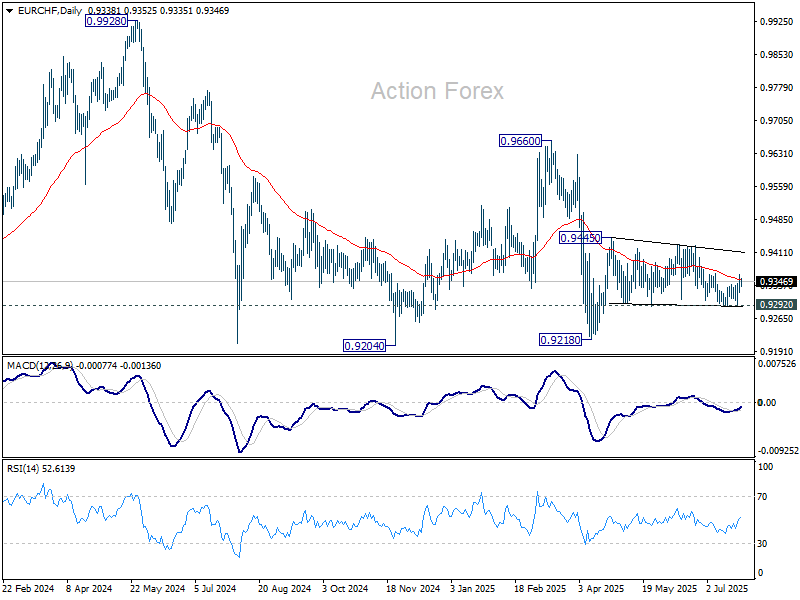
Intraday bias in EUR/CHF remains neutral at this point. On the upside, firm break of 0.9365 resistance will be the first sign that corrective pattern from 0.9445 has already completed. Further rise should then be seen to 0.9428/45 resistance zone. Firm break there will resume the rebound from 0.9218 low. However, firm break of 0.9292 will bring retest of 0.9218 instead.
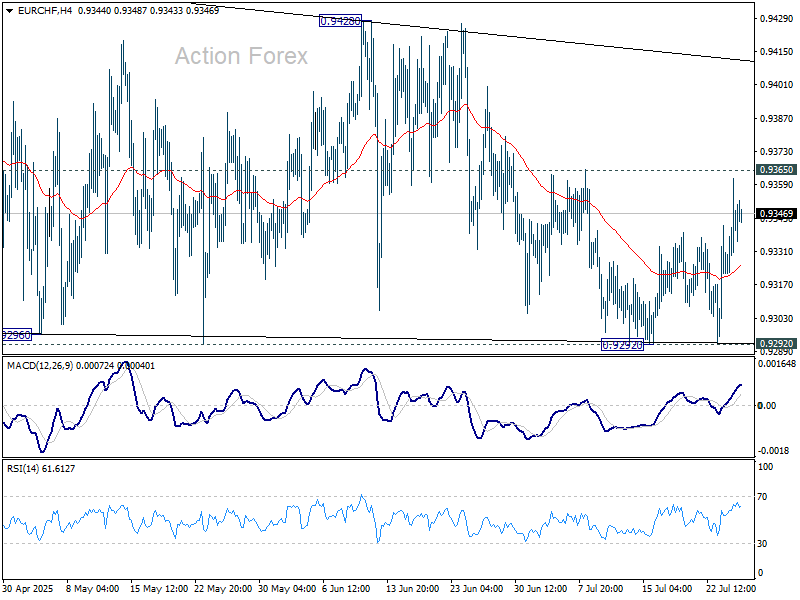
In the bigger picture, while downside momentum has been diminishing as seen in W MACD, there is no sign of bottoming yet. EUR/CHF is still staying below 55 W EMA (now at 0.9424) and well inside long term falling channel. Outlook will stay bearish as long as 0.9660 resistance holds. Break of 0.9204 (2024 low) will confirm resumption of down trend from 1.2004 (2018 high).
GBP/JPY Daily Outlook
Daily Pivots: (S1) 198.14; (P) 198.61; (R1) 199.48; More...
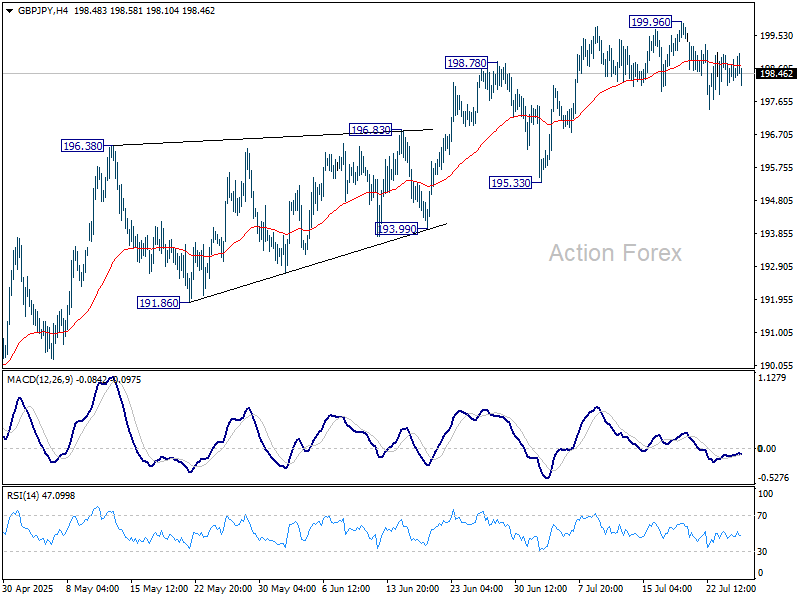
Intraday bias in GBP/JPY remains neutral for the moment as consolidations continue below 199.96. While deeper pullback cannot be ruled out, further rally will remain in favor as long as 195.33 support holds. Above 199.96 will resume the rise from 184.35 to 100% projection of 180.00 to 199.79 from 184.35 at 204.14.
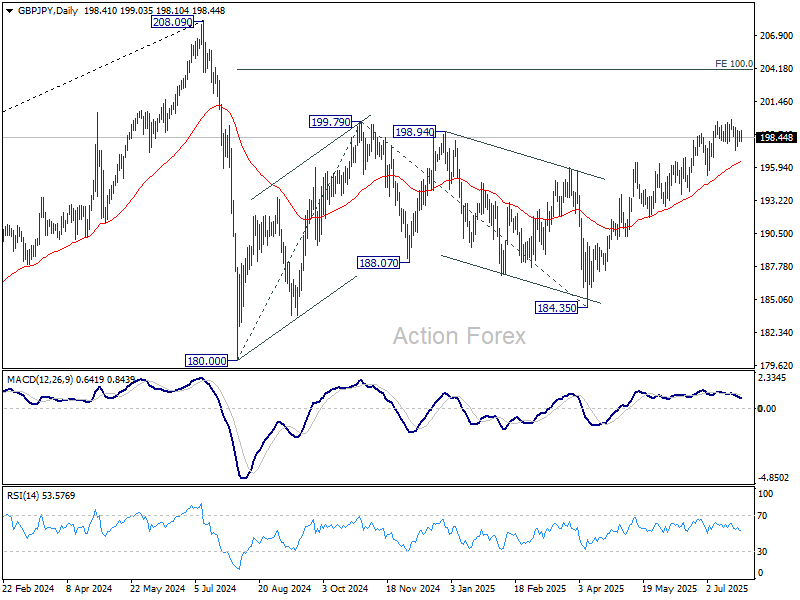
In the bigger picture, price actions from 208.09 (2024 high) are seen as a correction to rally from 123.94 (2020 low). The pattern might still extend with another falling leg. But in that case, strong support should be seen from 38.2% retracement of 123.94 to 208.09 at 175.94 to contain downside. Meanwhile, decisive break of 208.09 will confirm long term up trend resumption.
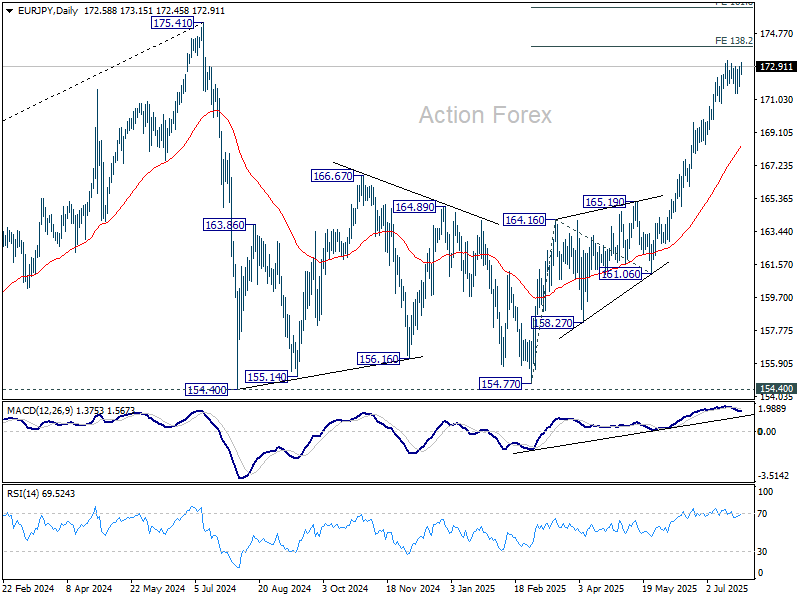
EUR/JPY Daily Outlook
Daily Pivots: (S1) 171.98; (P) 172.45; (R1) 173.15; More...
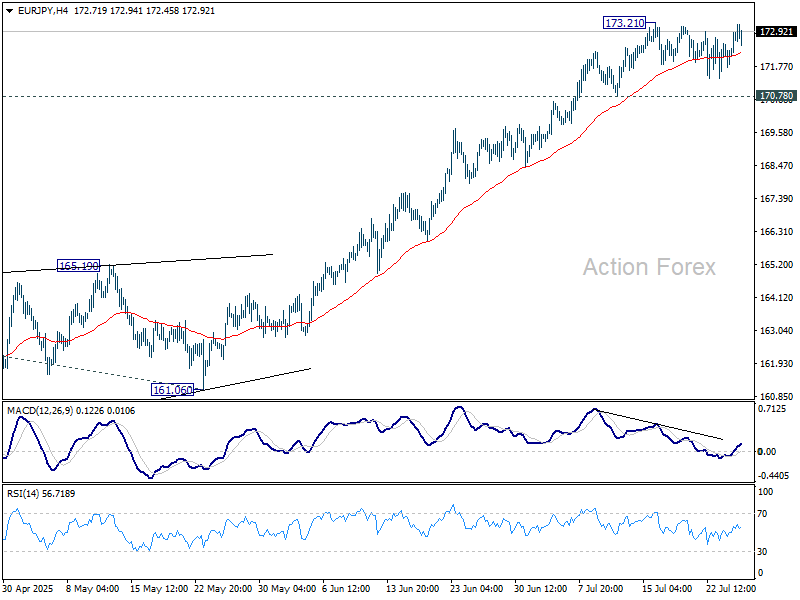
Intraday bias in EUR/JPY remains neutral for the moment. Consolidations from 173.21 could still extend with another falling leg. But overall, with 170.78 support intact, further rally is expected. On the upside, break of 173.21 will target 138.2% projection of 154.77 to 164.16 from 161.06 at 174.03. Break there will bring retest of 175.41 high. Nevertheless, considering bearish divergence condition in 4H MACD, break of 170.78 will indicate short term topping, and turn bias to the downside for deeper pullback.
In the bigger picture, price actions from 175.41 (2024 high) are seen as correction to up trend from 114.42 (2020 low). The pattern might still extend with another falling leg. But in that case, strong support should be seen from 38.2% retracement of 114.42 to 175.41 at 152.11 to contain downside. Meanwhile, decisive break of 175.41 will confirm long term up trend resumption.