Sample Category Title
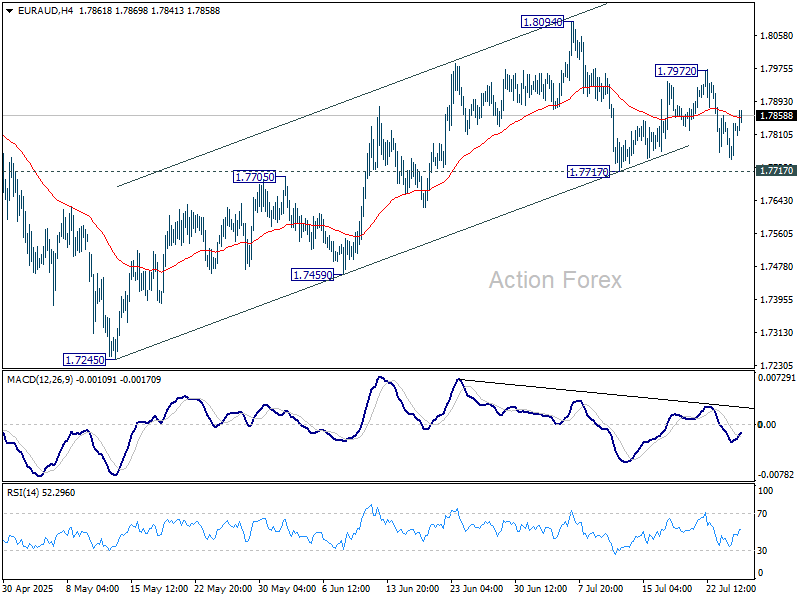
EUR/AUD Daily Outlook
Daily Pivots: (S1) 1.7774; (P) 1.7810; (R1) 1.7870; More...
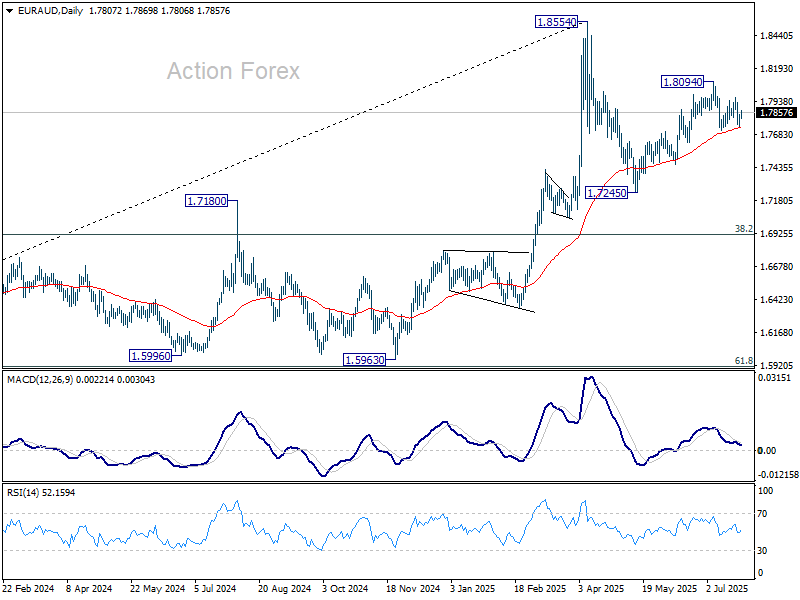
No change in EUR/AUD's outlook and intraday bias stays neutral. On the downside, break of 1.7717 support will revive the case that rise from 1.7245 has completed. Corrective pattern from 1.8554 should have then started the third leg. Intraday bias will be back on the downside for 1.7459 support next. On the upside, above 1.7972 will bring retest of 1.8094 resistance.
In the bigger picture, price actions from 1.8554 medium term top are seen as a corrective pattern. While deeper pullback might be seen, downside should be contained by 38.2% retracement of 1.4281 (2022 low) to 1.8554 at 1.6922 to bring rebound. Up trend from 1.4281 is expected to resume at a later stage.
Today’s Numbers Do Not Derail Our Expectations for Further BoJ Rate Hikes Later This Year
Markets
EMU yield curves bear flattened yesterday. A solid EMU PMI and the ECB reconfirming a data-dependent wait-and-see modus caused markets to reconsider expectations on additional ECB easing. The July EMU composite PMI at 51.0 suggests economic resilience despite still lingering trade uncertainty. The overall EMU figure was also still pressured by a poor French performance. Growth momentum in Germany improves. The rest of Europe continues a solid expansion. Cost inflation is easing and so are prices rises for consumers. The ECB basically subscribed the message from the PMI’s. Inflation has returned to the 2% target and is expected to hold near that level in the foreseeable future, admittedly given an exceptionally high degree of uncertainty. At the press conference, ECB’s Lagarde said the ECB is in a good place to assess developments. She saw growth mostly as expected, maybe even a bit better. In particular the latter remark triggered a further upleg in EMU yields. German yields rose between 8.8 bps (2-y) and 1.9 bps (30-y). The market focus, at least temporarily shifted from fiscal sustainability to monetary policy considerations. Money markets now only see about a 65% chance of a ‘final’ 25 bps ECB rate cut EoY 2025. US yields initially also showed similar gains, supported by low weekly jobless claims, but mixed US PMI’s (manufacturing unexpectedly falling from 52.9 to 49.5, but services beating at 54.6 from 52.9) slowed the upward momentum. The US 2-y yield added 3.6 bps. The 30-y finished unchanged. On other markets, equities apparently had discounted the good news of the US-Japan trade deal (and the anticipation of other ‘acceptable’ deals with other trading partners). The US S&P 500 (+0.1%) and the EuroStoxx 50 (+0.2%) closed off the intraday peak levels. On FX markets, the performance of the euro post PMI/ECB could have been stronger. A EUR/USD spike to the 1.1785/90 area could not be sustained. EUR/USD even closed modestly lower at 1.175. DXY gained modestly (97.38 from 97.2). Still the technical picture remains fragile. USD/JPY also rebound to close near 147. Sterling again underperformed after a disappointing UK PMI. EUR/GBP extensively tested the 0.87 barrier (close 0.8698).
Asian equity markets are falling prey to profit taking after recent trade-driven rally. The dollar gains marginally. Later today, US durable goods orders data and German IFO sentiment probably will only be of intraday significance. Markets will continue to look out for more trade deals between the US and major trading partners (including EU) as the August 1 deadline is nearing fast. This might cause some consolidation for equities and the dollar going into the weekend. At the short end of the EMU yield curve, a firm bottom now is probably in place. More good news might cause MM to further price out the probability of a final ECB rate cut. UK June retail sales rebounded a below consensus 0.6% M/M after a sharp 2.9% decline in May. EUR/GBP tried to extend gains beyond 0.87.
News & Views
Inflation in Japan’s capital Tokyo marginally eased and slightly more than expected in July to remain among the fastest paces in recent decades barring the post-pandemic surge. Both the headline and core (ex. food) gauge retreated from 3.1% to 2.9%. The conventional core measure (ex. food and energy) matched June’s 3.1% as did services inflation at 2.1%. The latter is key to the central bank to determine whether inflation is durable or not, via wage gains filtering through to this labour sensitive sector. This year’s shunto (spring labor wage negotiations) are likely to add upward pressure on (services) inflation. Today’s numbers do not derail our expectations for further BoJ rate hikes later this year, though the bank is likely to skip July despite the US and Japan having struck a trade deal. Japanese yields and the yen nevertheless edge a tad lower this morning. USD/JPY hovers north of 147.
UK GfK consumer confidence deteriorated from -18 to -19 in July. While slightly better than the -20 anticipated, it features some poor underlying details. GfK attributed this month’s drop to mounting job losses and rising inflation. It added that the savings intentions subseries rose to 34, the highest level since November 2007. GfK said households were building “contingency funds”, amongst others due to fears for further tax hikes in the next October budget. The weak consumer survey comes after yesterday’s poor PMI business confidence indicators and could spell trouble for the UK economy going forward. EUR/GBP extends gains to north of 0.87 to trade the highest since the April 2 market mayhem.
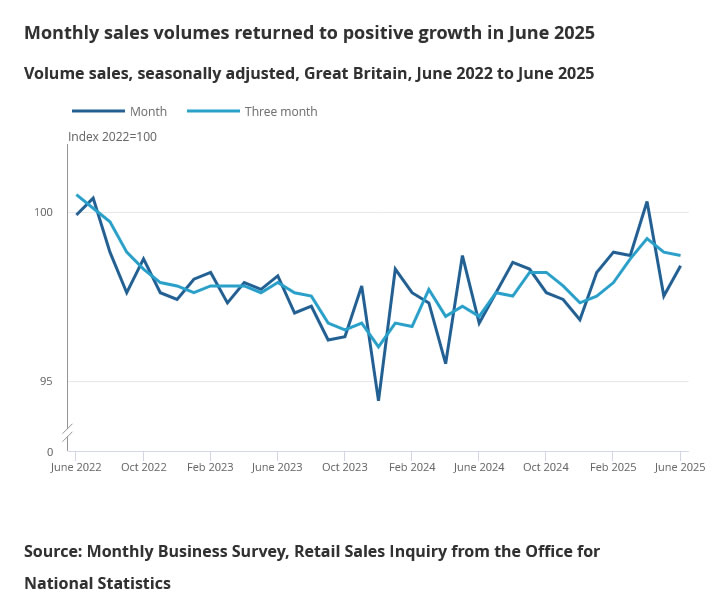
UK retail sales rise 0.9% mom in June, but miss forecasts
UK retail sales rose 0.9% mom in June, a solid rebound from May’s -2.8% mom drop, but shy of expectations for a 1.2% mom increase. On a quarterly basis, sales volumes grew 0.2% qoq in Q2, indicating modest underlying momentum.
Fuel sales jumped 2.8% mom—the strongest monthly gain in over a year—while food store volumes also posted a 0.7% mom rise. Online activity remained robust, with non-store sales volumes climbing 1.7% mom and reaching their highest level since February 2022.
EUR/GBP Daily Outlook
Daily Pivots: (S1) 0.8672; (P) 0.8691; (R1) 0.8716; More...
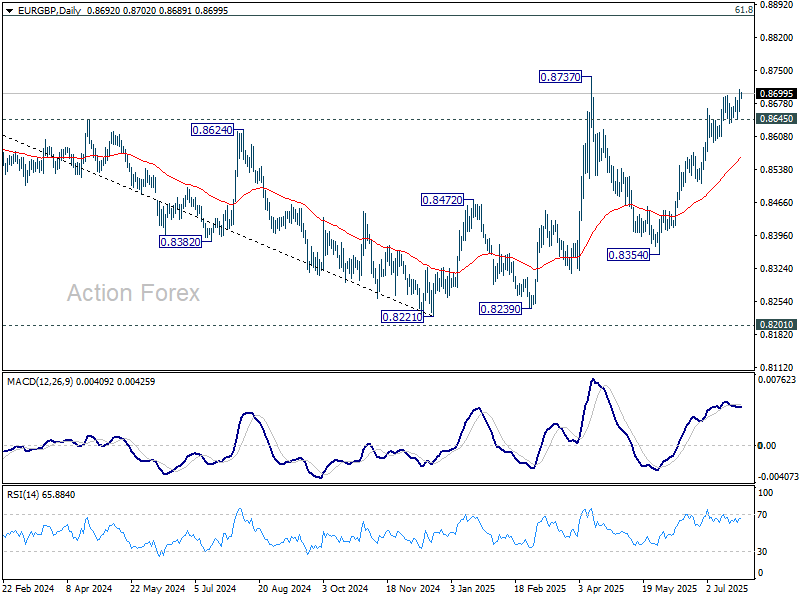
EUR/GBP's rise from 0.8354 resumed by breaking 0.8696 resistance and intraday bias is back on the upside. Further rally should be seen to retest 0.8737 high. Firm break there will extend the rise from 0.8221 towards 0.8867 fibonacci level. On the downside, however, break of 0.8645 will suggest short term topping, and turn bias to the downside for deeper pullback.
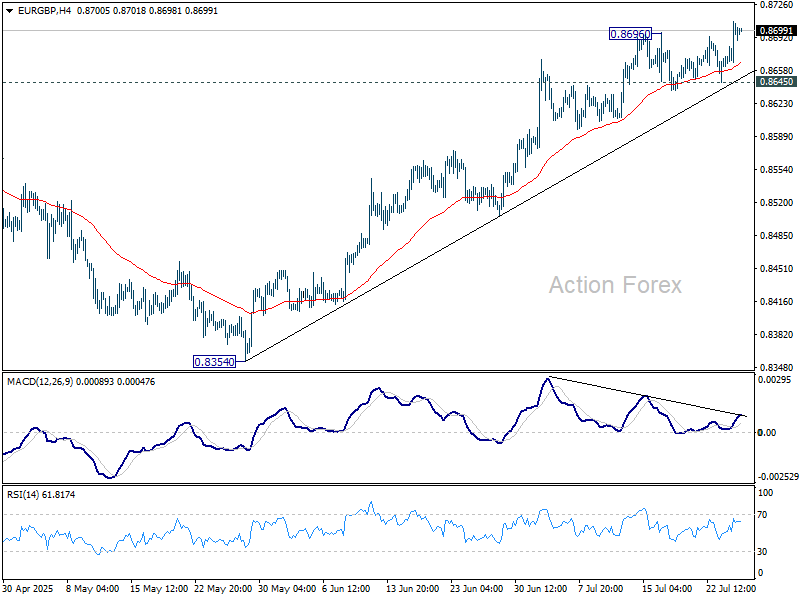
In the bigger picture, the structure from 0.8221 medium term bottom are not impulsive enough to suggest that it's reversing the down trend from 0.9267 (2022 high). But even if it's a correction, firm break of 0.8737 will still pave the way to 61.8% retracement of 0.9267 to 0.8221 at 0.8867. For now, further rise will remain in favor as long as 55 W EMA (now at 0.8474) holds.
Shifting ECB Cut Expectations Supports Euro; Trump Tones Down Powell Threat
Euro strengthened notably against Sterling and Swiss Franc as expectations for a September rate cut from the ECB began to fade. Some analysts now see October as a more likely timing, after President Christine Lagarde maintained an optimistic outlook during her post-decision press conference yesterday. Lagarde emphasized that June’s baseline forecasts remain valid, even amid US tariff threats. Latest improvement in July’s services PMI also reduced the urgency for another near-term cut.
In the US, Dollar clawed back modest ground following signs that Fed Chair Jerome Powell’s job is safe—at least for now. During a symbolic visit to the Fed, US President Donald Trump reiterated his frustration with Powell’s reluctance to cut rates but walked back threats of dismissal. Trump said that firing the chair would be “a big move” and likely unnecessary. The shift eases some institutional risk concerns that had weighed on the greenback.
Meanwhile, Australia’s decision to allow US beef imports marks another bright spot in global trade relations. Australian Agriculture Minister Julie Collins noted that biosecurity concerns have been addressed through improved US monitoring systems. Trump welcomed the move, touting it as a win for American ranchers and a sign of stronger US-Australia ties.
Overall for the week so far, Yen is currently the strongest one, followed by Kiwi, and then Euro. Dollar remains at the bottom, followed by Loonie, and then Sterling. Swiss Franc and Aussie are positioning in the middle. Risk-on sentiment appears to be receding.
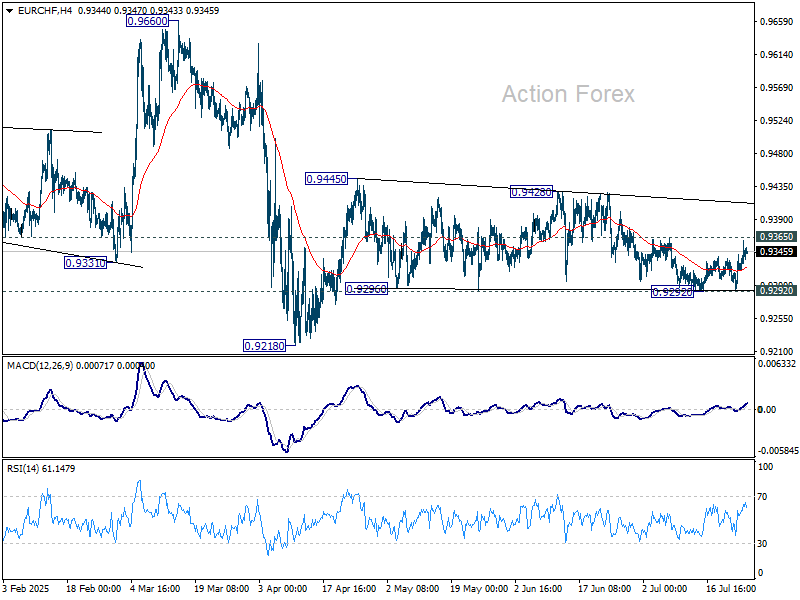
Technically, a focus today is on 0.9365 resistance in EUR/CHF as near term rebound extends. Firm break there will argue that corrective pattern from 0.9445 might have finally completed at 0.9292. Retest of 0.9428/9445 resistance zone should be seen next. Firm break there will resume the rebound from 0.9218.
In Asia, at the time of writing, Nikkei is down -0.87%. Hong Kong HSI is down -0.87%. China Shanghai SSE is down -0.25%. Singapore Strait Times is down -0.35%. Japan 10-year JGB yield is down -0.008 at 1.595. Overnight, DOW fell -0.70%. S&P 500 rose 0.07%. NASDAQ rose 0.18%. 10-year yield rose 0.02 to 4.408.
Tokyo CPI core slows to 2.9%, but stays elevated
Tokyo’s core CPI (ex-fresh food) eased slightly from 3.1% to 2.9% yoy in July, coming in just below expectations of 3.0% yoy, but still notably above the BoJ’s 2% target.
Headline inflation also slowed from 3.1% yoy to 2.9% yoy. Core-core measure—excluding fresh food and energy—held steady at 3.1%. The stickiness in core-core inflation highlights persistent underlying price pressures.
The figures will feed into the BoJ’s upcoming July 30–31 policy meeting, where the board is widely expected to upgrade its inflation forecast for the current fiscal year. While the data alone may not push the BoJ to act immediately, it strengthens the case for further normalization as inflation remains well above target.
EUR/GBP Daily Outlook
Daily Pivots: (S1) 0.8672; (P) 0.8691; (R1) 0.8716; More...
EUR/GBP's rise from 0.8354 resumed by breaking 0.8696 resistance and intraday bias is back on the upside. Further rally should be seen to retest 0.8737 high. Firm break there will extend the rise from 0.8221 towards 0.8867 fibonacci level. On the downside, however, break of 0.8645 will suggest short term topping, and turn bias to the downside for deeper pullback.
In the bigger picture, the structure from 0.8221 medium term bottom are not impulsive enough to suggest that it's reversing the down trend from 0.9267 (2022 high). But even if it's a correction, firm break of 0.8737 will still pave the way to 61.8% retracement of 0.9267 to 0.8221 at 0.8867. For now, further rise will remain in favor as long as 55 W EMA (now at 0.8474) holds.
Cliff Notes: Resting on Data Dependency
Key insights from the week that was.
In Australia, the RBA’s July Minutes provided more colour around the Board’s diverse set of views on the balance of risks and the subsequent split decision. The case to cut the cash rate rested on the opinion that the current forecasts for inflation to settle around the mid-point of the target band and the recovery in economic growth may be too optimistic. This risk, particularly as it relates to a potentially slower pick-up in consumer spending, is clearly evident in recent card activity data.
While a minority of Board members favoured this view, the majority saw a small degree of upside inflation risk in the recent run of partial data, and hence sought to remain patient until the full quarterly reading can be assessed. The ultimate decision to keep policy unchanged underscores the majority’s preference to move policy in a ‘cautious and predictable’ manner. Provided the quarterly inflation data continues to indicate that inflation is on track to return to the mid-point of the target range, as we anticipate, August remains the most likely timing for the next rate cut.
Later in the week, Governor Bullock delivered a speech that largely reiterated the messaging from the decision statement and the minutes, but explored more detail in other areas. In this week’s essay, Chief Economist Luci Ellis delves into the RBA’s current thinking on the interaction between the supply and demand-sides of the economy and its implications for productivity.
Before moving offshore, our latest industry report puts the spotlight on Australian agriculture, assessing current trends for production and costs, the outlook for selected key commodities, and how well the industry is placed to weather the impact from US tariffs.
Globally, market participants continue to focus on US trade policy rumours and announcements. To date this week, the Trump administration has announced a 19% tariff on the Philippines and 15% for Japan, the former a touch higher than Liberation Day, the latter modestly below. Notably the 15% tariff rate for Japan applies to automobiles instead of the standard 25% rate, putting Japanese vehicle manufacturers at a significant advantage to those from South Korea and Europe who are yet to come to terms with the US on a deal.
Securing Japan’s improved terms was a commitment by the nation to invest USD550bn in the US economy through a fund that will reportedly provide equity financing, loans and other support to manufacturing plants, infrastructure and other investments in the US, according to Commerce Secretary Howard Lutnick. The significance of the deal for Japan was evident in the strong equity rally for Japanese automotive producers over the week.
Also of significance for Japan, ahead of the trade agreement announcement, the LDP–Komeito coalition experienced a historic loss, winning just 47 of the 50 seats required in Japan’s upper house election to maintain a majority. This comes after the coalition lost its majority in the lower house last year. The outcome reflects voter frustration amid compounding cost-of-living pressures, including a doubling of rice prices, and perceived government mismanagement. A multi-party coalition to unseat the LDP–Komeito alliance remains unlikely, but the resulting split government will make it more difficult for Japan to implement reforms aimed at boosting domestic demand and stabilising inflation at target.
For monetary policy and data, Europe was the focus this week. The ECB's Governing Council kept its policy rates unchanged at the July meeting. In the statement, they highlighted that "Domestic price pressures have continued to ease, with wages growing more slowly" while "the economy has so far proven resilient overall in a challenging global environment". On the outlook for policy, President Lagarde continued to emphasise that the Council is "well positioned" and "will follow a data-dependent and meeting-by-meeting approach to determining the appropriate monetary policy stance".
"Risks to economic growth remain tilted to the downside. Among the main risks are a further escalation in global trade tensions and associated uncertainties, which could dampen exports and drag down investment and consumption.” Moreover, a " stronger euro could bring inflation down further than expected…. [and] inflation could turn out to be lower if higher tariffs lead to lower demand for euro area exports and induce countries with overcapacity to reroute their exports to the euro area”. This skew in risks leads us to believe the ECB will likely deliver another 25bp cut at the September policy meeting and thereafter remain on hold at the lower-end of its neutral range, absent a material shock to activity or inflation.
The ECB bank lending survey for Q2 2025 also favours further easing, reporting "broadly unchanged credit standards for loans to firms amid geopolitical uncertainty and trade tensions" while "Credit standards tightened slightly for housing loans and more markedly for consumer credit". "Firms’ demand for loans increased slightly in net terms but remained weak overall.” Meanwhile, “Demand for housing loans continued to increase substantially... [but] demand for consumer credit increased only slightly". In sum, uncertainty over the outlook continues to limit the benefit of policy easing to economic growth.
Silver Maintains Around 2011 Levels
Silver has had quite a run this month, up 7.40% only since the 10th of July.
Today we'll take a quick look at an update of a multi-timeframe Silver analysis to spot the ongoing trends and see if the trend has still some juice.
This article is a continuation of the article posted on the 15th of July where we only looked at intraday timeframes.
Now let's take a step back.
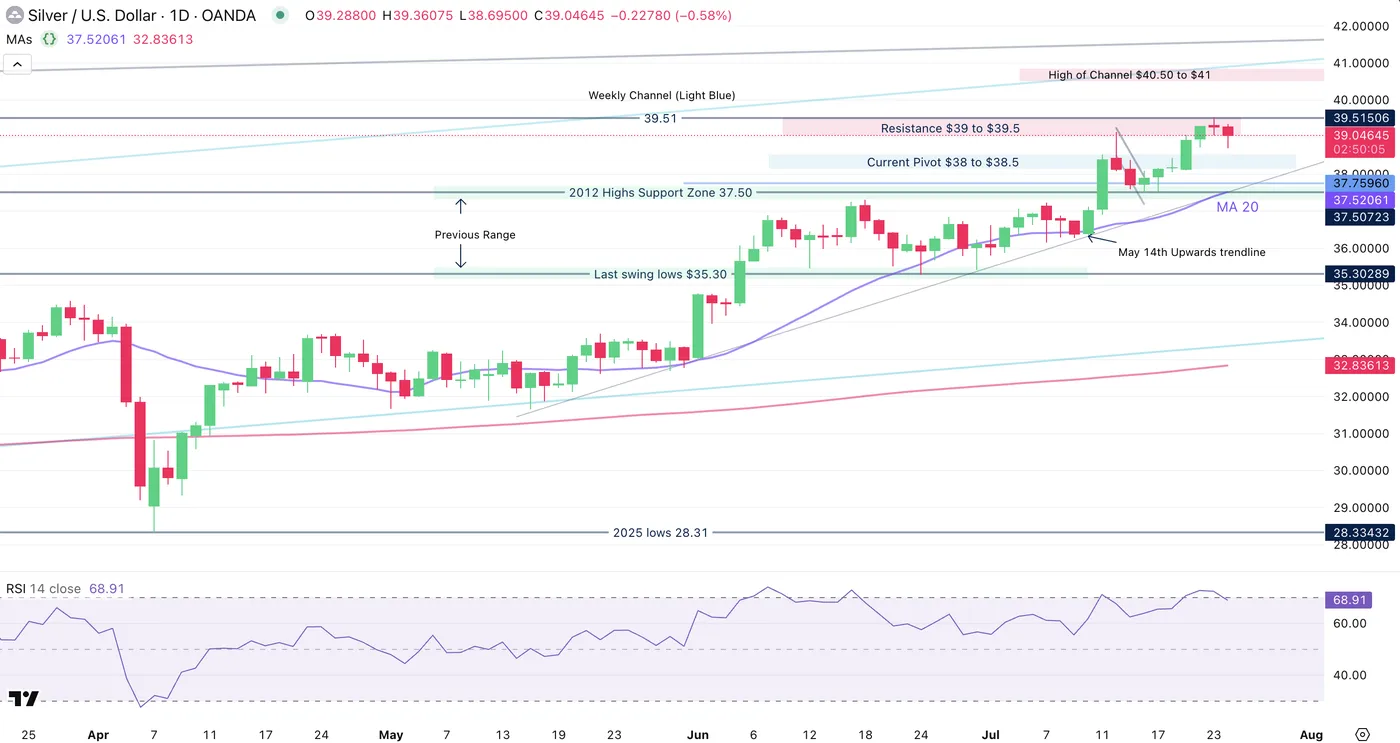
Silver Weekly Chart
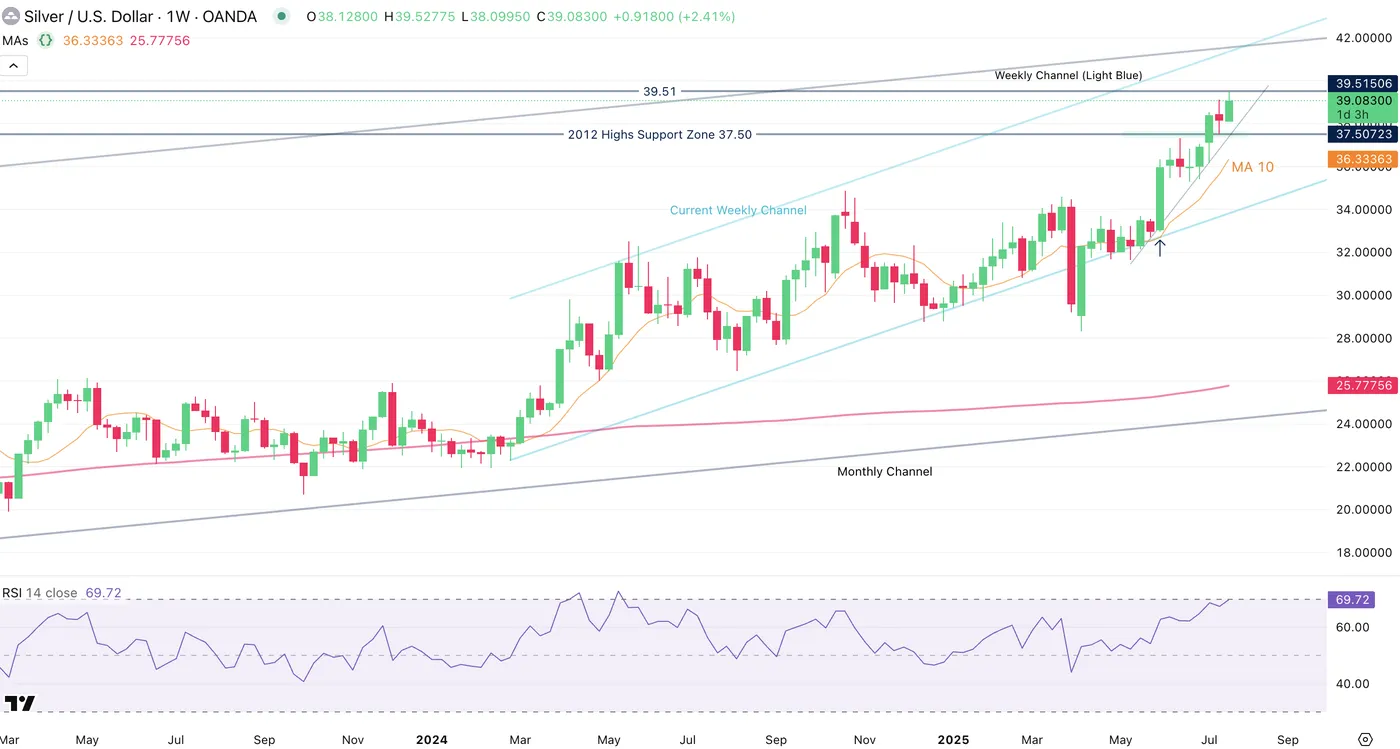
Silver Weekly Chart, July 24 2025 – Source: TradingView
Momentum is strong for the metal but starting to test the upper bound of the RSI with around $2 to $3 missing towards the highs of the ongoing light blue weekly channel.
This is a good drawing to keep on your charts to maintain a good view of where we are in the current trend.
Silver Daily Chart
Silver Daily Chart, July 24 2025 – Source: TradingView
The precious metal has made an impulsive move higher reaching the $39 to $39.50 Resistance we observed last week.
There is still work to do to test the high of the weekly channel, but the overbought conditions in the metal will make it difficult for an immediate move to happen.
The 20 Day Moving Average is slowly catching up to the current prices, currently at $37.50.
The two last impulsive moves (black arrows on the chart) have happened at around 20 days after the 20-Day MA rejoined the growing prices, after momentum retracted back to neutral.
The higher probabilities are pointing towards a consolidation/small retracements to the trendline rather than an immediate break higher. Of course, anything can happen.
Silver 4H Chart
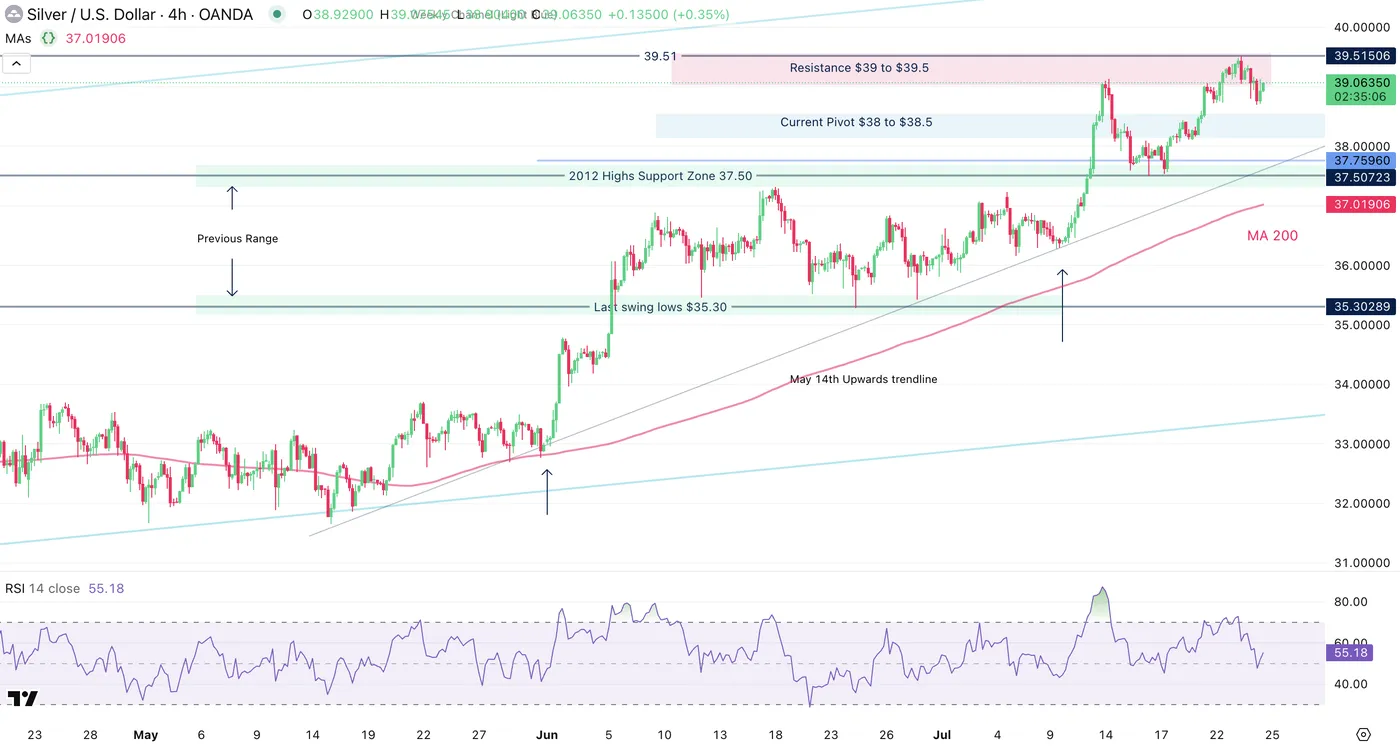
Silver Daily Chart, July 24 2025 – Source: TradingView
Looking at the immediate price action, there are still some probabilities of an upside breakout, however a strong move higher on good volume with a daily close above the 39.51 previous highs would be necessary to up these odds (a simple retest won't do it for now).
If a retracement lower happens, the consolidation has a high chance to hold between 37.50 (2012 Support) and 39.50 (Current resistance), particularly as these levels coincide with the May upwards trendline.
If buyers maintain the prices above $39 throughout the end of the week, the odds of an upside breakout increase strongly
Support Levels:
- Immediate intraday support 146.37 and 30m MA 50
- 146.00 Pivot Zone (+/- 100 pips)
- Overnight lows 145.85
- Main Daily Support 142.00 region
Resistance Levels:
- Resistance $39 to $39.5
- 39.51 last swing highs
- $40.50 to $41 potential Resistance at ATH and top of Rising Channel
A look back to the 2011 Silver chart
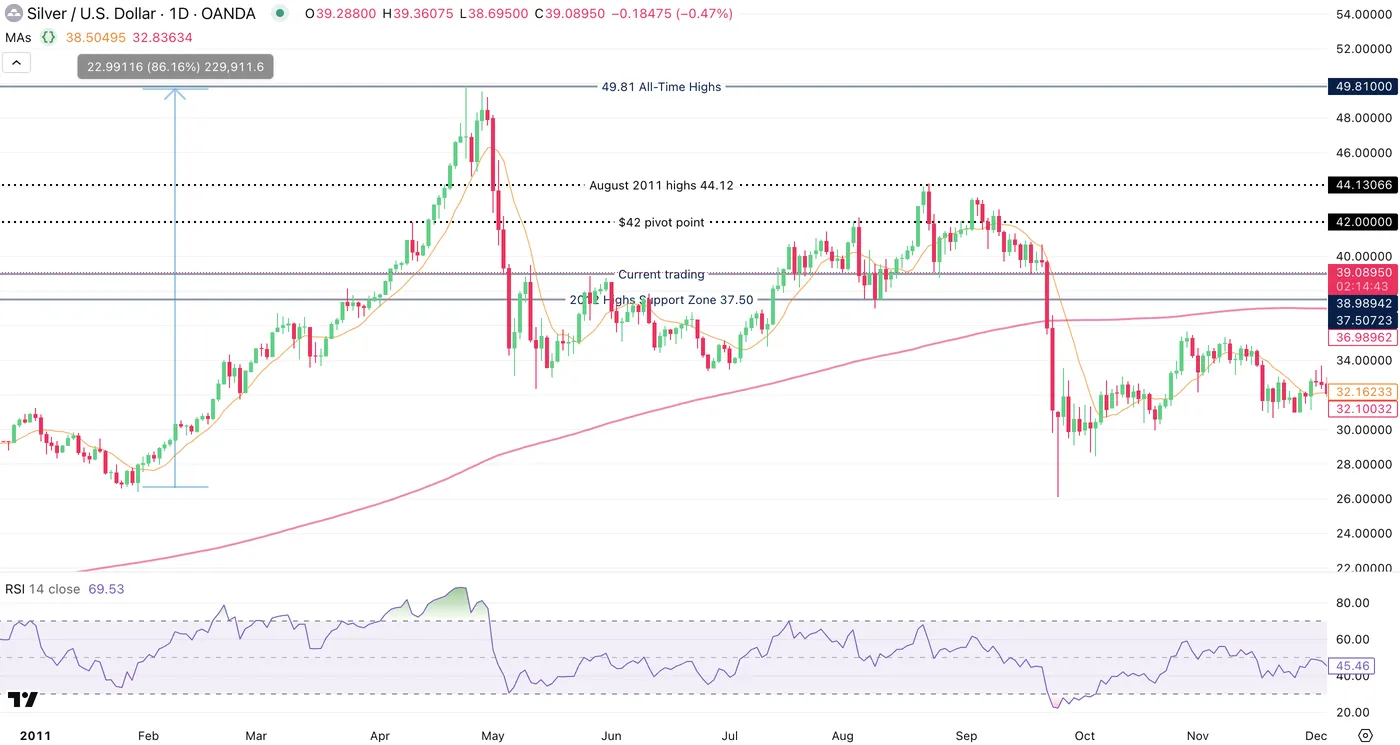
Silver 2011 Daily Chart (all-year) – Source: TradingView
It's interesting to look back at past performances especially when assets or financial products come back to previous historic levels.
Spot the levels of major reactions on this chart, this could be interesting to watch if Silver reaches similar prices
Most commonly traded Metals performance since May 2025
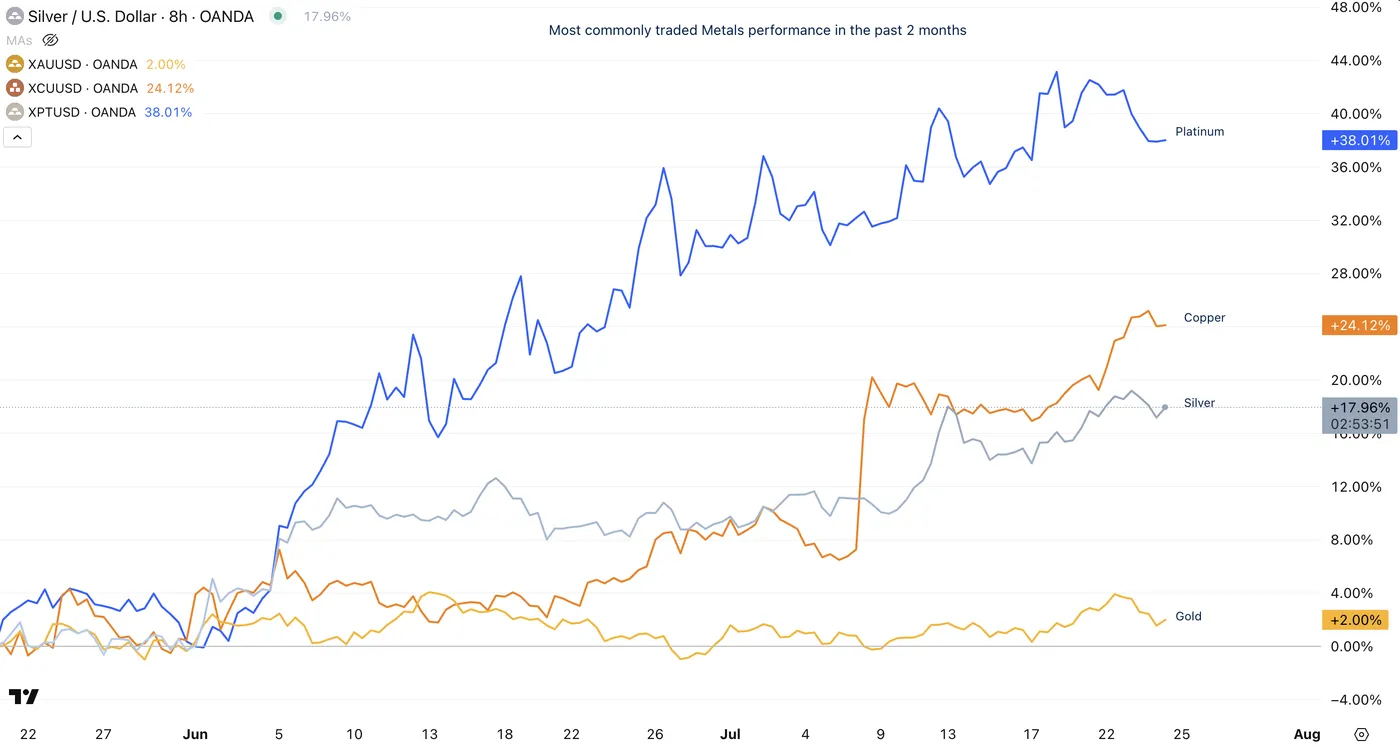
Metals comparative performance since the past 2 months, July 2025 – Source: TradingView
Metals are ongoing a mighty move higher, similar to what happened between 2008 and 2011.
Higher deficits seem not to have an end, and except for surprising rate hikes (unexpected for now), there doesn’t seem to be many reasons for metals to retrace essentially
(except for a sudden cancelling of tariffs, substantially low odds of this happening.)
Safe Trades!
Tokyo CPI core slows to 2.9%, but stays elevated
Tokyo’s core CPI (ex-fresh food) eased slightly from 3.1% to 2.9% yoy in July, coming in just below expectations of 3.0% yoy, but still notably above the BoJ’s 2% target.
Headline inflation also slowed from 3.1% yoy to 2.9% yoy. Core-core measure—excluding fresh food and energy—held steady at 3.1%. The stickiness in core-core inflation highlights persistent underlying price pressures.
The figures will feed into the BoJ’s upcoming July 30–31 policy meeting, where the board is widely expected to upgrade its inflation forecast for the current fiscal year. While the data alone may not push the BoJ to act immediately, it strengthens the case for further normalization as inflation remains well above target.
Narrow Path-Dependence
RBA minutes and Governor’s Anika speech clarify forward view. But the near-term forward path again seems to come down to small differences in outcomes for trimmed mean inflation versus expectations.
- RBA Monetary Policy Board (MPB) minutes and Governor’s Anika Foundation speech this week provide additional colour on the MPB’s split decision to keep rates on hold. The minutes gave the views of both members who voted to hold and members who voted to cut a good airing.
- The RBA’s view of productivity and supply-side issues is evolving and likely to continue to do so, with more internal work going on ahead of the August meeting and Statement on Monetary Policy. There are some important nuances and intellectual traps in this debate, though. Path-dependence can become a factor: tight labour markets might draw more workers in, making them more integrated into the labour market and boosting labour supply in the longer run.
- Since no single MPB member can front-run the decision of the whole Board, future inter-meeting communication is unlikely to endorse or push back against market pricing. This implies that markets will be surprised more often than in countries like the United States, where the central bank puts more weight on avoiding surprising the market. This approach should not, however, rule out making the RBA’s own interpretation of the data or its analytical models clearer when misconceptions arise.
This week’s minutes and Anika Foundation speech provided plenty to consider about how the RBA is seeing the economy. Inflation has come down significantly, which was welcomed. Unlike many other economies, this has not been at the expense of significantly higher unemployment. (For the technically minded, this means the ‘sacrifice ratio’ has been low.) While the Governor stopped short of claiming vindication, the contrast with other peer economics such as Canada and New Zealand did highlight the role of the RBA Board’s strategy to raise the policy rate by a bit less than in those other countries. Still, the MPB clearly remains nervous about inflation and some members want to see actual data to support their expectation that it is still declining towards 2½%, the midpoint of the RBA’s 2–3% target range. For this reason, we cannot lock in the cash rate cut in August just yet. We do, however, think it is the most likely outcome, especially if the quarterly inflation numbers come in as we expect.
Supply, productivity and path-dependence: the plot thickens
Unsurprisingly given the government’s upcoming roundtable, productivity received plenty of attention in the minutes, speech and Q&A. The minutes acknowledged that the expansion of the non-market sector and declining mining sector output had contributed to developments recently. The Governor noted that the staff are doing more work on productivity ahead of the August SMP. It is not clear which way this will go. We know that much of Australia’s living standards challenge stems from the fact that the free kick from rising minerals prices is no longer occurring. This would be true even if productivity growth were robust: when one factor is no longer boosting living standards, something else must adjust to make up the difference.
Concerns about productivity relate to the supply side of the economy. The Governor’s speech acknowledged that much of the surge in inflation following the pandemic stemmed from supply shocks. This is, incidentally, quite an evolution from the RBA’s assessment in late 2023 that inflation was becoming ‘increasingly homegrown and demand driven’. While these supply shocks were more drawn out than some observers initially expected, they did eventually subside. Monetary policy can mostly look through this kind of inflation as long as inflation expectations remain anchored.
But strong demand was also a factor. This was especially an issue in the United States, where fiscal policy remained very expansionary even after the disruptions of the pandemic had passed. The issue was less pronounced in Australia, but the exceptional stimulus during the pandemic and the surge in population when the borders reopened did play a role. (The RBA also today released some interesting findings on the latter.) The differing experiences of economies stemming from different fiscal responses highlights why it is so important that the methods central banks use to disentangle supply and demand shocks are appropriate, and do not fall foul of the ‘other fruit problem’.
More broadly, in the speech Q&A, the Governor acknowledged that weak productivity and weak supply did not necessarily imply anything for demand and so monetary policy. While that clears up any misconceptions that weak productivity growth is necessarily a reason to keep monetary policy tight – a welcome realisation – there are some important nuances here.
In particular, the Governor floated the idea that slow demand growth had less to do with tight policy than with supply being weak. We should not make too much of an off-the-cuff answer in a post-speech Q&A: it’s hard to get all the nuances into a short answer when there is a queue of other people wanting to ask questions. But this does raise the question of which way causation runs, and whether strong demand might in fact induce greater supply or weak demand weigh on supply. If so, tight monetary policy when both demand and supply are weak looks even less defensible.
The difficulty with this line of argument becomes clearer when comparing this discussion with the Governor’s answer to another question, about the labour market. There, Governor Bullock referenced a Bulletin article published the same day showing that the increase in labour force participation since the pandemic had not been a drag on productivity. The additional workers were not so new and green that they reduced the overall quality of the workforce. (This should not be a surprise: much of the increase in participation came from older workers just not retiring, and women returning to the paid workforce after stints demonstrating the executive management skills involved in wrangling small children.) It was a good thing, the Governor said, that a tight labour market had drawn more workers into employment. In this way, a tight labour market begat its own loosening by drawing in more supply. This kind of path dependence – known as ‘hysteresis’ to economists – is central to the understanding of why unemployment was so high in decades past but declined right across developed economies in the 2000s without spurring inflation. (This is the same mechanism that caused people to worry that the pandemic would cause ‘scarring’ in the labour market. There is a growing academic literature on this mechanism.)
In other words, the Governor was allowing for the possibility of some path-dependence in the labour market but had not quite translated this into an implication for the broader economy.
Communicating in many voices
In response to a question from another market economist, the Governor reiterated the point she made after the meeting: that these speeches cannot front-run the MPB meeting, because each member is just one member and does not speak for all. Explicitly taking issue with market pricing of future RBA moves is therefore not something we should expect to happen in future. In response to a media question, the Governor argued that surprising the market was neither a reason to do something or not do something. Put another way, the MPB will put no weight on whether its decision surprises the market. The Board will just try to do what it considers to be the right thing. (That ‘it considers’ language is a relatively recent addition to the final sentence of the media release and minutes, first included in the media release following the May meeting.)
That should not preclude, however, inter-meeting communication that hosed down a misconception in the market about how data is being interpreted. For example, the minutes clarified that models of the so-called ‘neutral rate’ were uncertain and not too much weight should be put on them or recent changes to some of them. It would not have been front-running the other MPB members to say in a speech, as the minutes did, that ‘public discussion of the stance of monetary policy had possibly overemphasised the inferences that could be drawn from these alternative models, especially for the near term’. (Looking back at my own note on the subject, I could have been blunter in my language, too, in my efforts to hose down this view.)
As we noted earlier in the week, though, the view of neutral becomes even more important – and fraught – the closer you get to where you think it is. MPB members who are still nervous about supply constraints and tight labour markets will want to tread slowly. As the Governor said in her speech, ‘[t]he Board continues to judge that a measured and gradual approach to monetary policy easing is appropriate’. That ‘measured and gradual’ language is a bit of an evolution from the ‘cautious and gradual’ language used in the minutes when discussing the views of the members who voted to hold rates in July, and the ‘move cautiously and predictably’ language of the May minutes. These small wording changes are likely to be simply different ways of saying the same thing: this is not a central bank that will rush policy easing
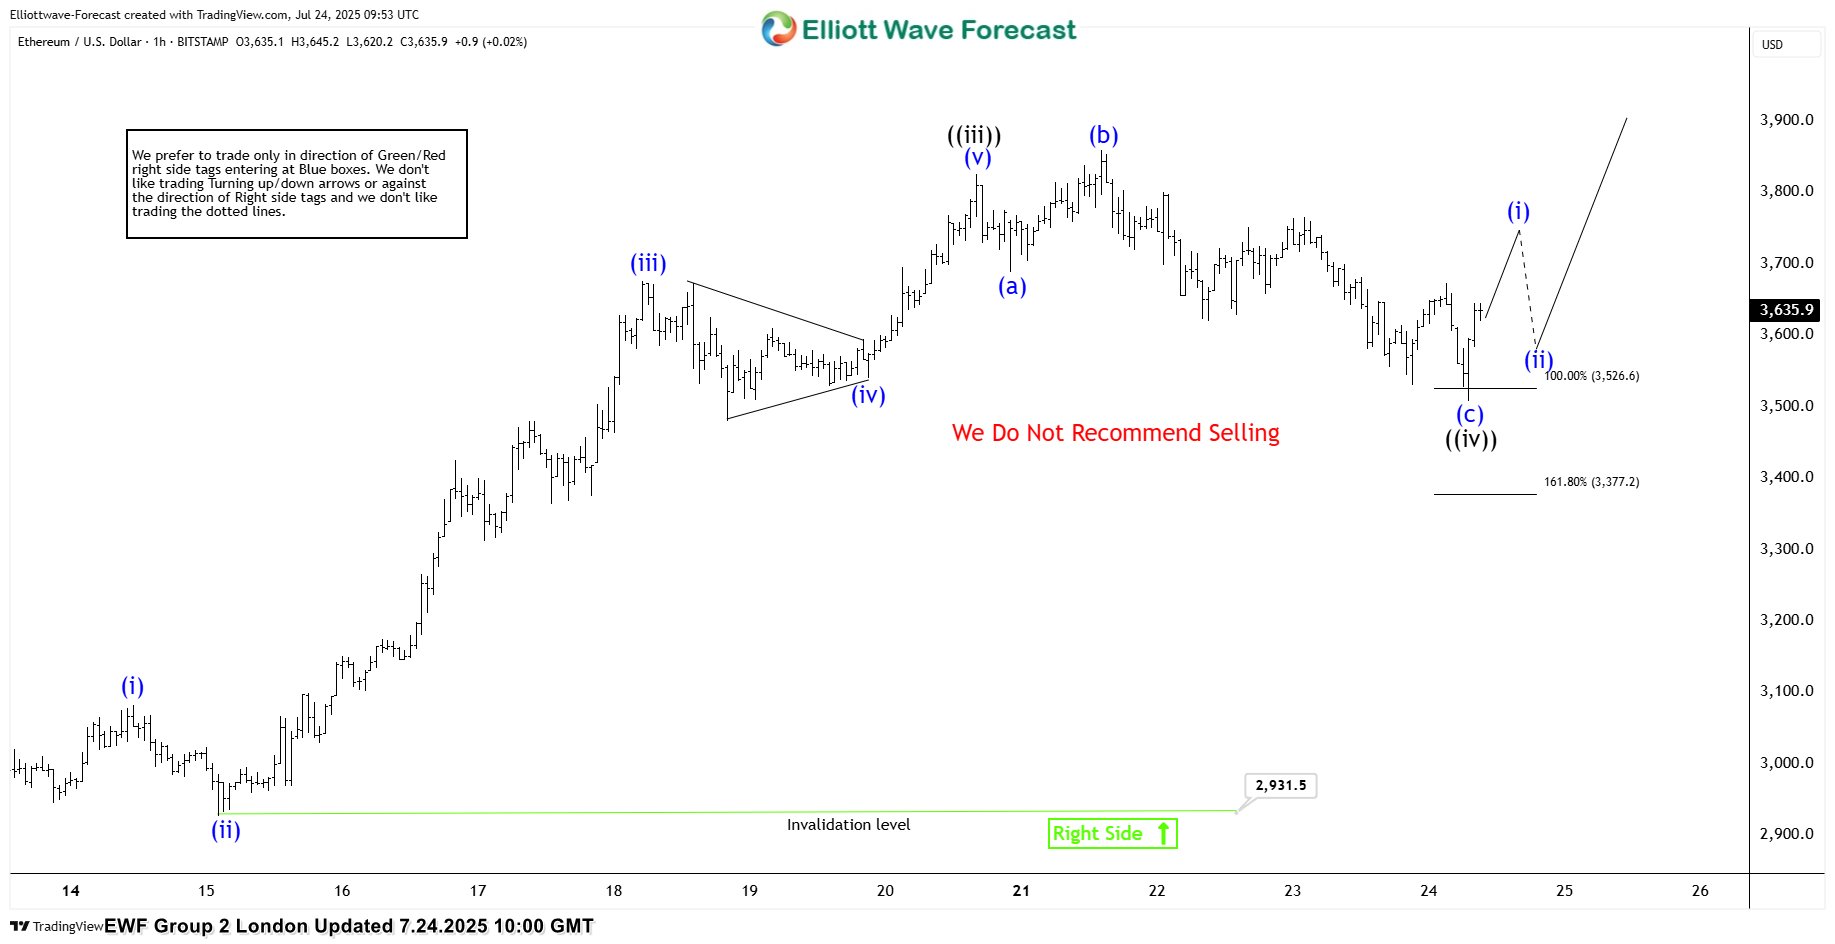
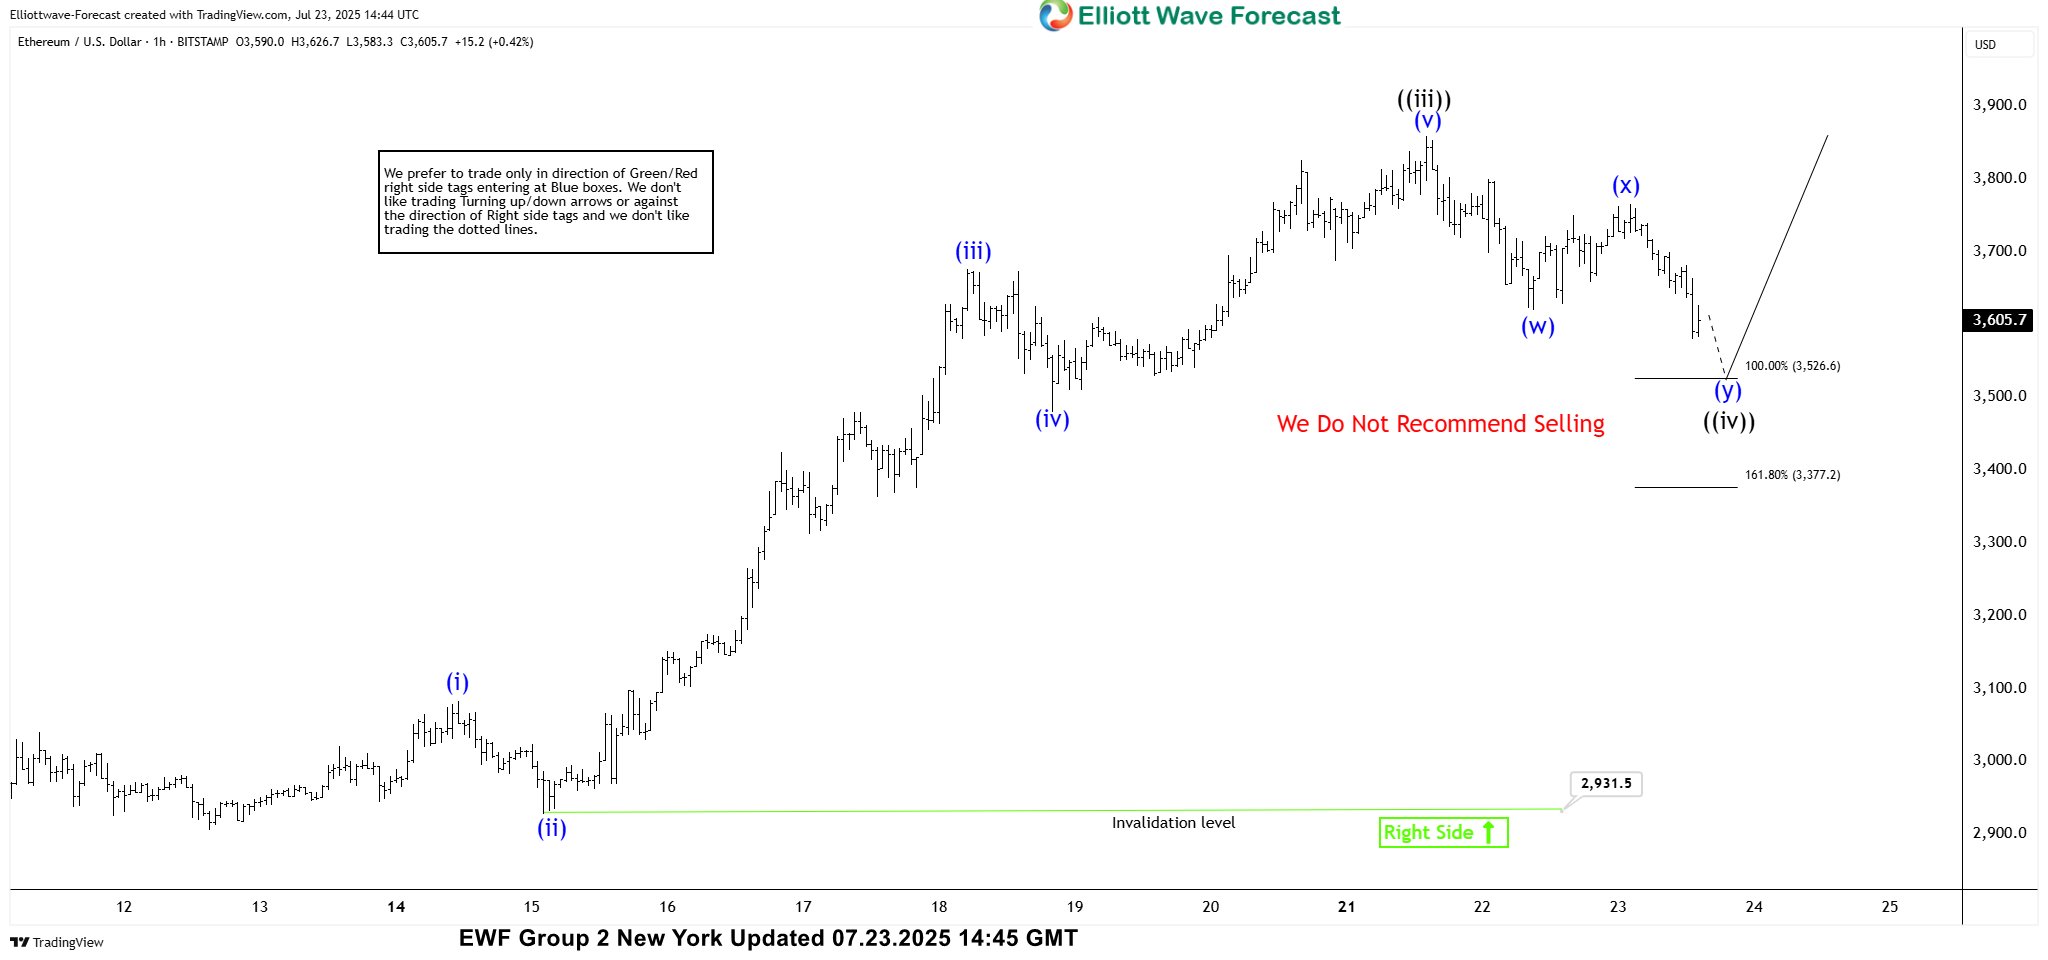
Ethereum (ETHUSD) Elliott Wave : Forecasting the Rally From Equal Legs Zone
Hello fellow traders. In this technical article, we are going to present Elliott Wave charts of Ethereum ETHUSD . As our members know, ETHUSD has been showing impulsive bullish sequences in the cycle from the 2,118.6 low, pointing to further strength ahead. We have been calling for a rally in ETHUSD since the beginning of July, based on the higher high bullish sequences the crypto was forming. Recently we got an intraday pullback labeled wave ((iv)), which landed right in the equal‑legs zone. In the following section, we’ll explain our Elliott Wave count and present the target area for wave ((v))
ETHUSD Elliott Wave 1 Hour Chart 07.23.2025
ETHUSD is currently doing wave ((iv)) black pull back. The correction appears incomplete at this stage. We anticipate further short-term weakness toward the Equal Legs area at 3,526.6-3,377.2. In that zone, we expect buyers to emerge and initiate another rally toward new highs. Therefore, we recommend avoiding short positions within this area.
 ETHUSD Elliott Wave 1 Hour Chart 07.24.2025
The price extended downward into the marked equal legs area, where ETHUSD found buyers as expected and has already shown a reaction. At this stage, we count the pullback as wave ((iv)), completed at the 3,510 low. As long as price remains above that level, we are likely in wave ((v)), targeting the 3,943–4,077 zone. Alternatively, if the 3,510 low is broken before a new high is made, we’ll likely see a deeper pullback. In that case, we’ll measure a new equal‑legs zone to identify the next buying area.