Sample Category Title
UK PMI composite falls to 51, BoE cut pressure builds
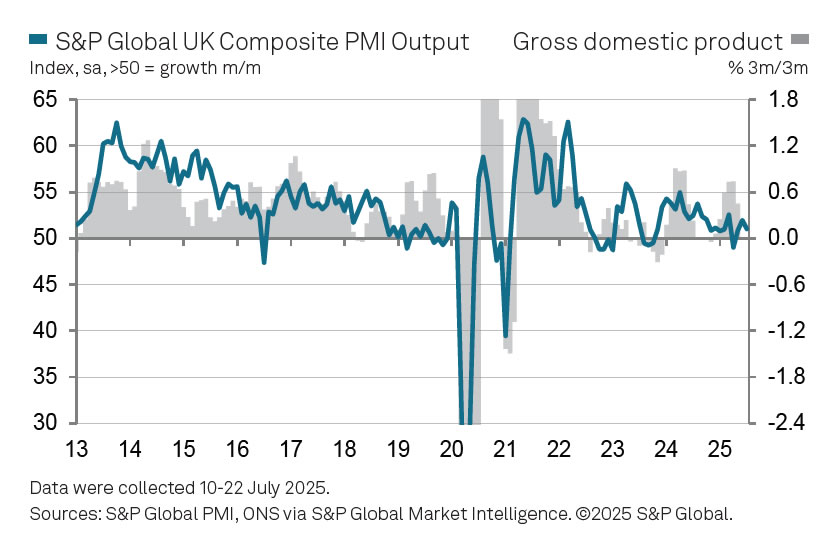
The UK economy showed signs of losing momentum in July, with Composite PMI falling from 52.0 to 51.0. A modest rise in Manufacturing PMI to 48.2 from 47.7 failed to offset a sharp slowdown in services activity, which dropped from 52.8 to 51.2. Overall, the data point to a fragile expansion at the start of Q3.
Chris Williamson at S&P Global Market Intelligence warned that output growth is now consistent with just a 0.1% quarterly GDP gain, and that “risks are tilted to the downside.” Persistent job shedding across sectors underscores the underlying weakness, raising concerns about near-term demand conditions.
With growth stalling and the labor market softening, Williamson said that will add pressure to the BoE to deliver another rate cut in August. While recent inflation data surprised to the upside, the BoE could “look through” those pressures and prioritize support for a struggling economy.
Pound Strengthens: Trade Tariffs and Economic Data Boost GBP/USD
The GBP/USD pair climbed to a two-week high on Thursday, holding near 1.3578, bolstered by improved global risk sentiment following the US-Japan trade agreement.
The deal, which replaces previously proposed 25% tariffs with a 15% levy, also includes the creation of a $550 billion investment fund to support the US economy. President Donald Trump hailed the agreement as mutually beneficial, further lifting market confidence.
Investors are now turning their attention to key UK economic indicators. PMI forecasts suggest the smallest contraction in manufacturing activity in six months, accompanied by the sharpest rise in services sector growth in nearly a year. Retail sales are also expected to rebound, aided by recent warm weather.
However, concerns linger after the UK reported a June budget deficit of £20.7 billion – the second-highest June figure since 1993. Rising inflation-linked bond repayments pushed debt servicing costs to £16.4 billion, adding pressure on public finances.
Amid these developments, speculation is mounting that Chancellor Rachel Reeves could announce tax increases as early as the autumn to address fiscal challenges.
Technical Analysis: GBP/USD
H4 Chart:
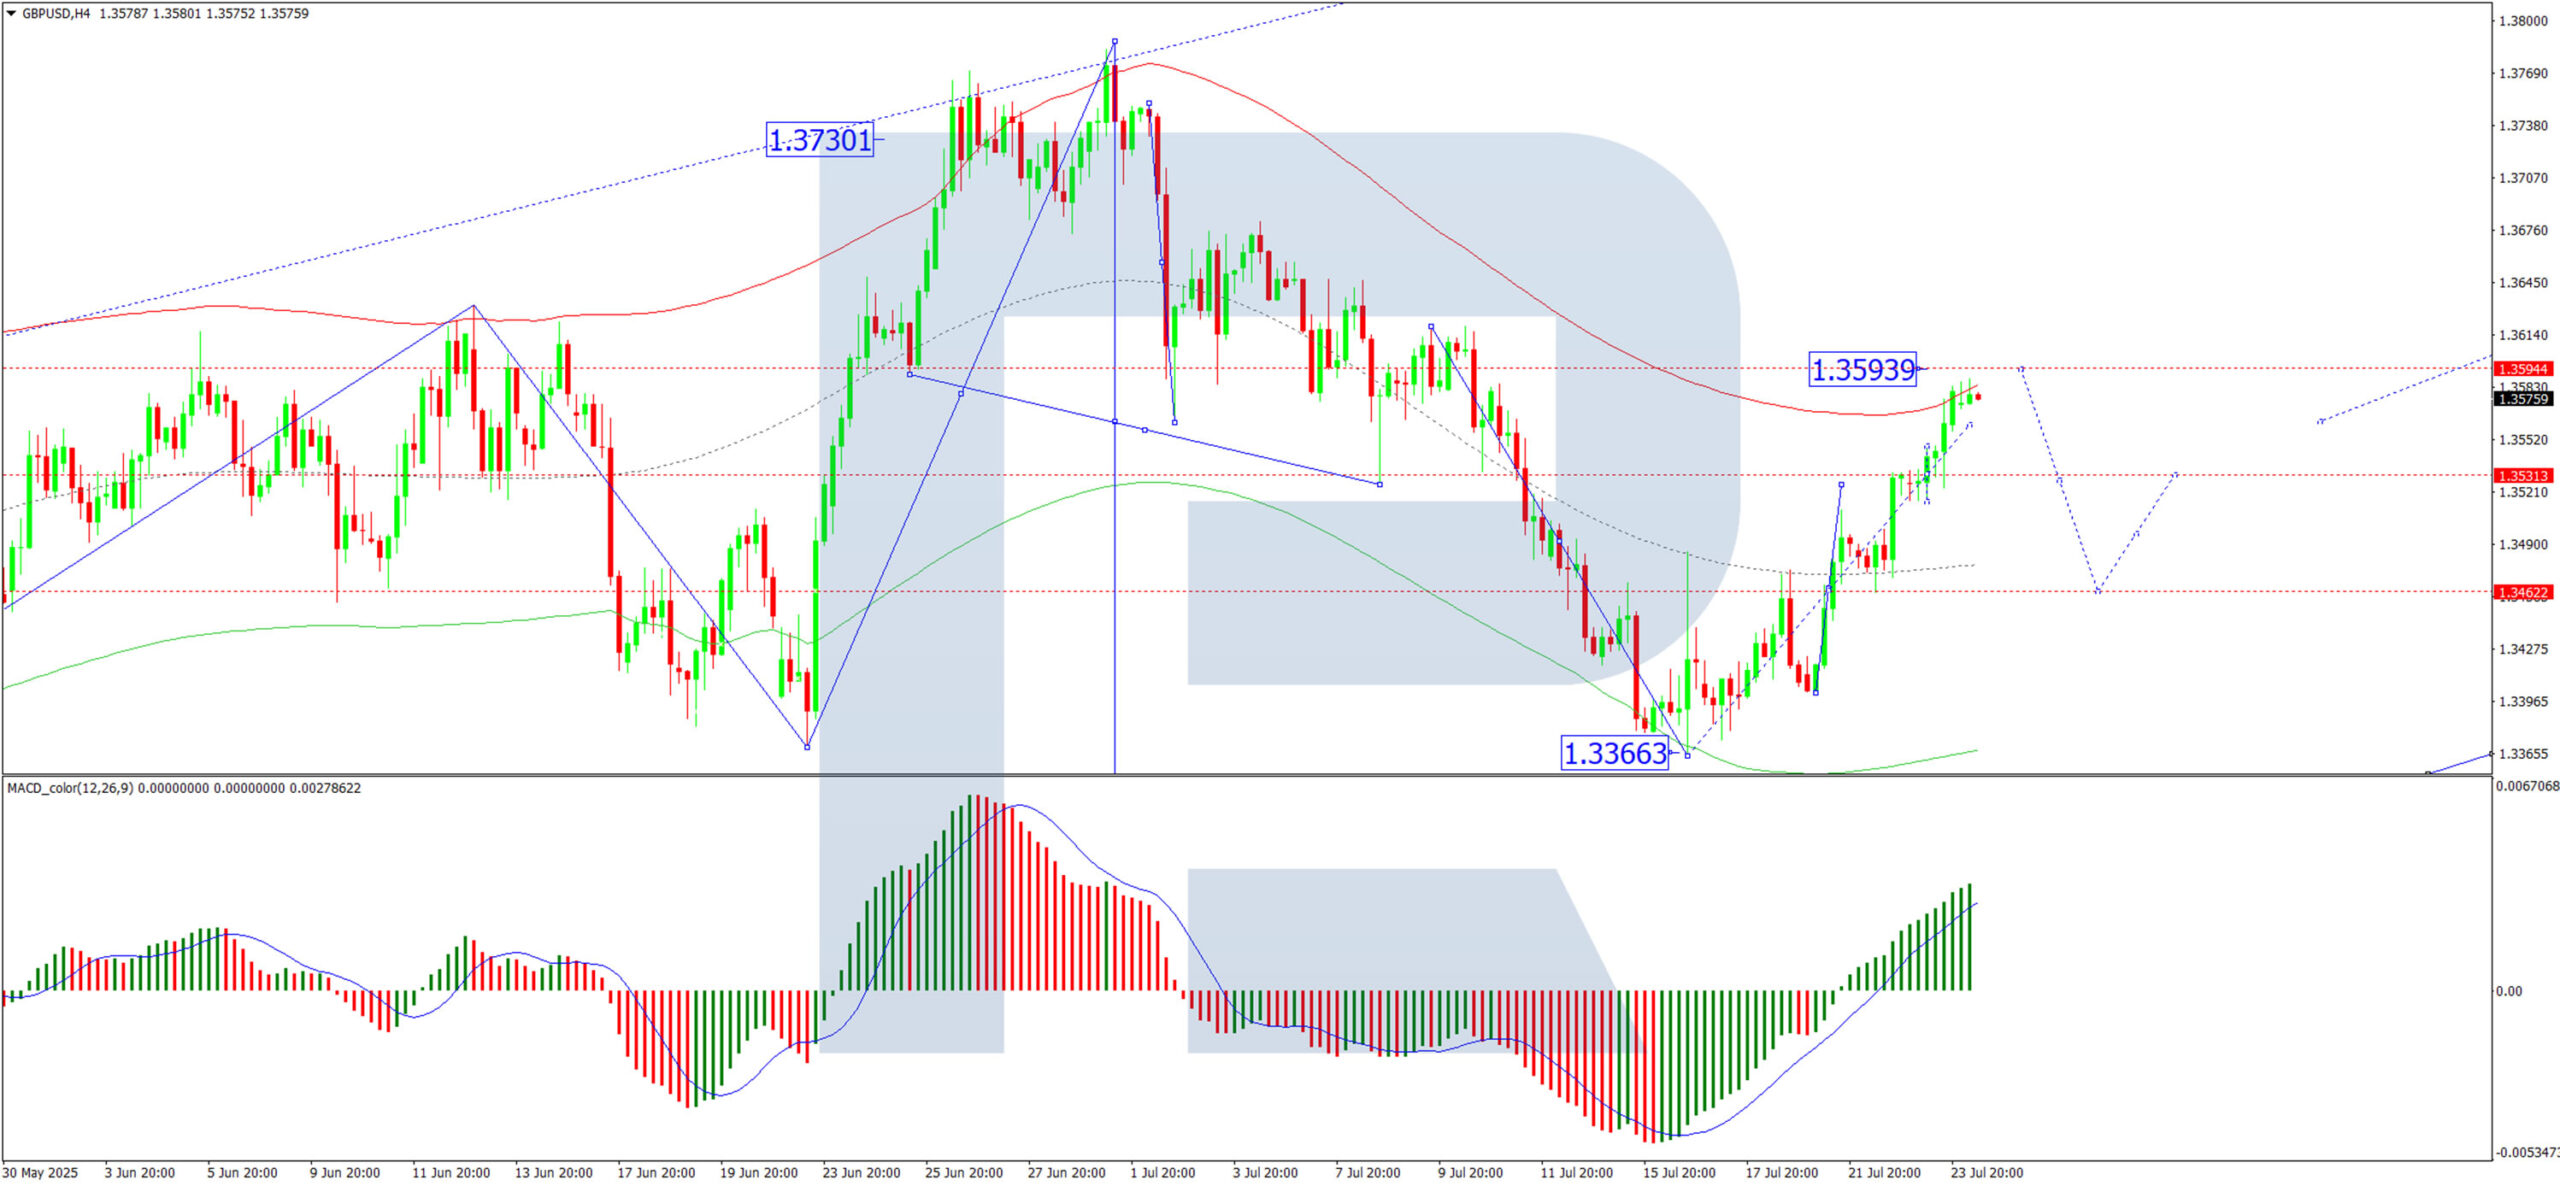
On the H4 chart, GBP/USD completed an upward wave to 1.3535, forming a consolidation range around this level. A breakout above this range could extend gains towards 1.3593. However, a subsequent correction downwards to 1.3530 remains possible. This scenario is supported by the MACD indicator, where the signal line sits above zero and is pointing firmly upward.
H1 Chart:
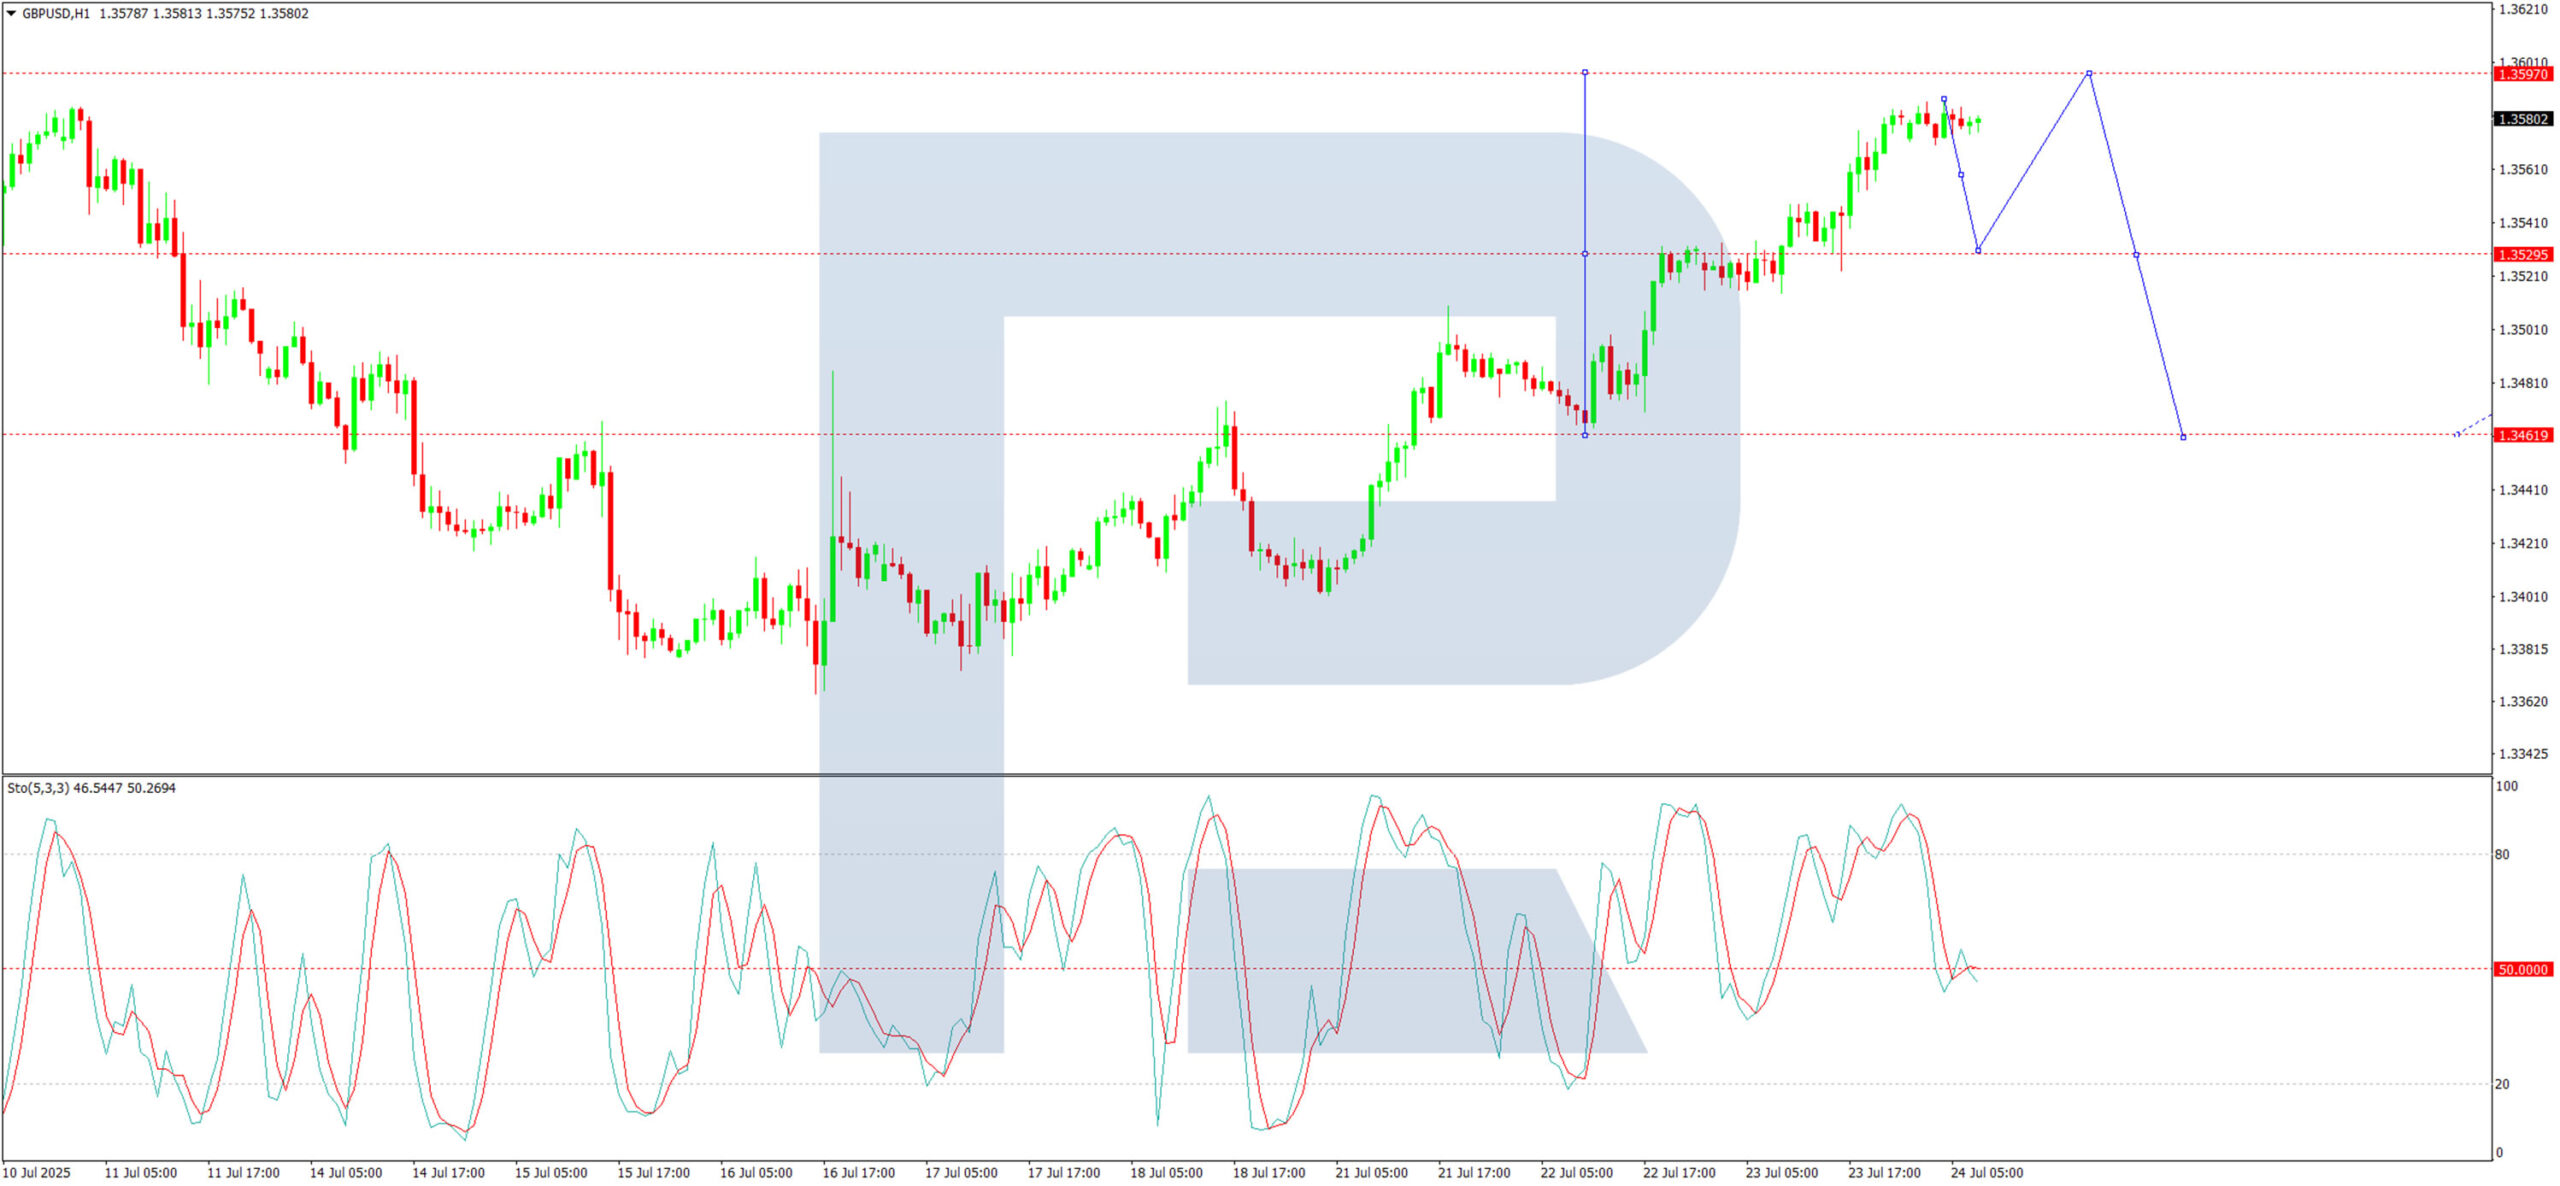
The H1 chart shows the pair finding support at 1.3462, with the current growth wave reaching its initial target of 1.3585. A short-term pullback to 1.3530 may occur before another upward move towards 1.3593. The Stochastic oscillator aligns with this outlook, as its signal line hovers below 5 and is trending downward towards 20.
Conclusion
The GBP/USD rally reflects an improvement in risk sentiment and anticipation of stronger UK economic data. However, fiscal concerns and technical indicators suggest potential volatility ahead. Traders should monitor PMI releases and fiscal policy announcements for further direction.
EUR/USD Rises to 2.5-Week High Ahead of ECB Meeting
Today at 15:15 GMT+3, the European Central Bank (ECB) will announce its interest rate decision, followed by a press conference at 15:45 GMT+3. According to Forex Factory, the main refinancing rate is expected to remain unchanged at 2.15% after seven consecutive cuts.
In anticipation of these events, the EUR/USD exchange rate has risen above the 1.1770 level for the first time since 7 July. Bullish sentiment is also being supported by expectations of a potential trade agreement between the United States and the European Union. According to Reuters, both sides are reportedly moving towards a deal that may include a 15% base tariff on EU goods entering the US, with certain exemptions.
Technical Analysis of the EUR/USD Chart
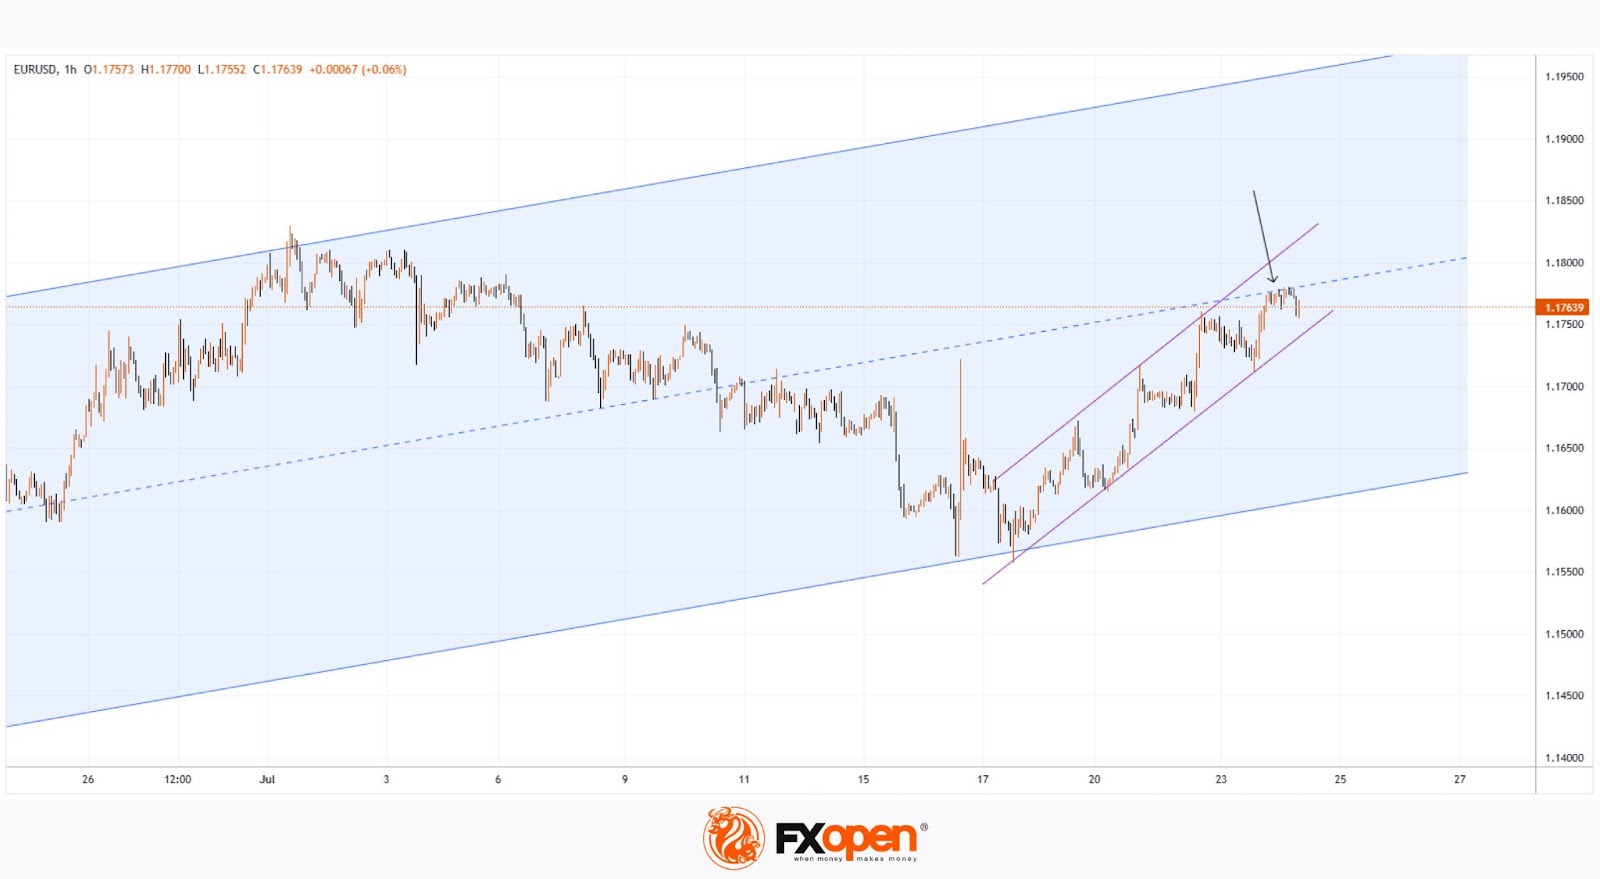
From a technical perspective, the EUR/USD pair has shown bullish momentum since June, resulting in the formation of an ascending channel (marked in blue).
Within this channel, the price has rebounded from the lower boundary (highlighted in purple), although the midline of the blue channel appears to be acting as resistance (as indicated by the arrow), slowing further upward movement.
It is reasonable to assume that EUR/USD may attempt to stabilise around the midline—where demand and supply typically reach equilibrium. However, today’s market is unlikely to remain calm. In addition to the ECB’s statements, volatility could be heightened by news surrounding Donald Trump’s unexpected visit to the Federal Reserve.
Trade over 50 forex markets 24 hours a day with FXOpen. Take advantage of low commissions, deep liquidity, and spreads from 0.0 pips. Open your FXOpen account now or learn more about trading forex with FXOpen.
This article represents the opinion of the Companies operating under the FXOpen brand only. It is not to be construed as an offer, solicitation, or recommendation with respect to products and services provided by the Companies operating under the FXOpen brand, nor is it to be considered financial advice.
Pound Strengthens After Testing Key Support Levels, Retail Sales Data in Focus
The British currency continues its recovery following a test of key technical support levels. GBP/USD and GBP/CAD have risen amid moderate US dollar weakness and mixed Canadian macroeconomic data. Investor attention remains focused on upcoming economic indicators, which are due to be released over the next trading sessions. Today, the market is closely watching a batch of data from the US and Canada, including updated statistics on initial jobless claims, total continuing claims, and the Chicago Fed National Activity Index. On Friday morning, markets await the release of June retail sales figures from the UK. Against this backdrop, the pound remains highly sensitive to economic data and monetary policy signals. Should UK data prove neutral or stronger than expected, the current upward momentum may persist.
GBP/USD
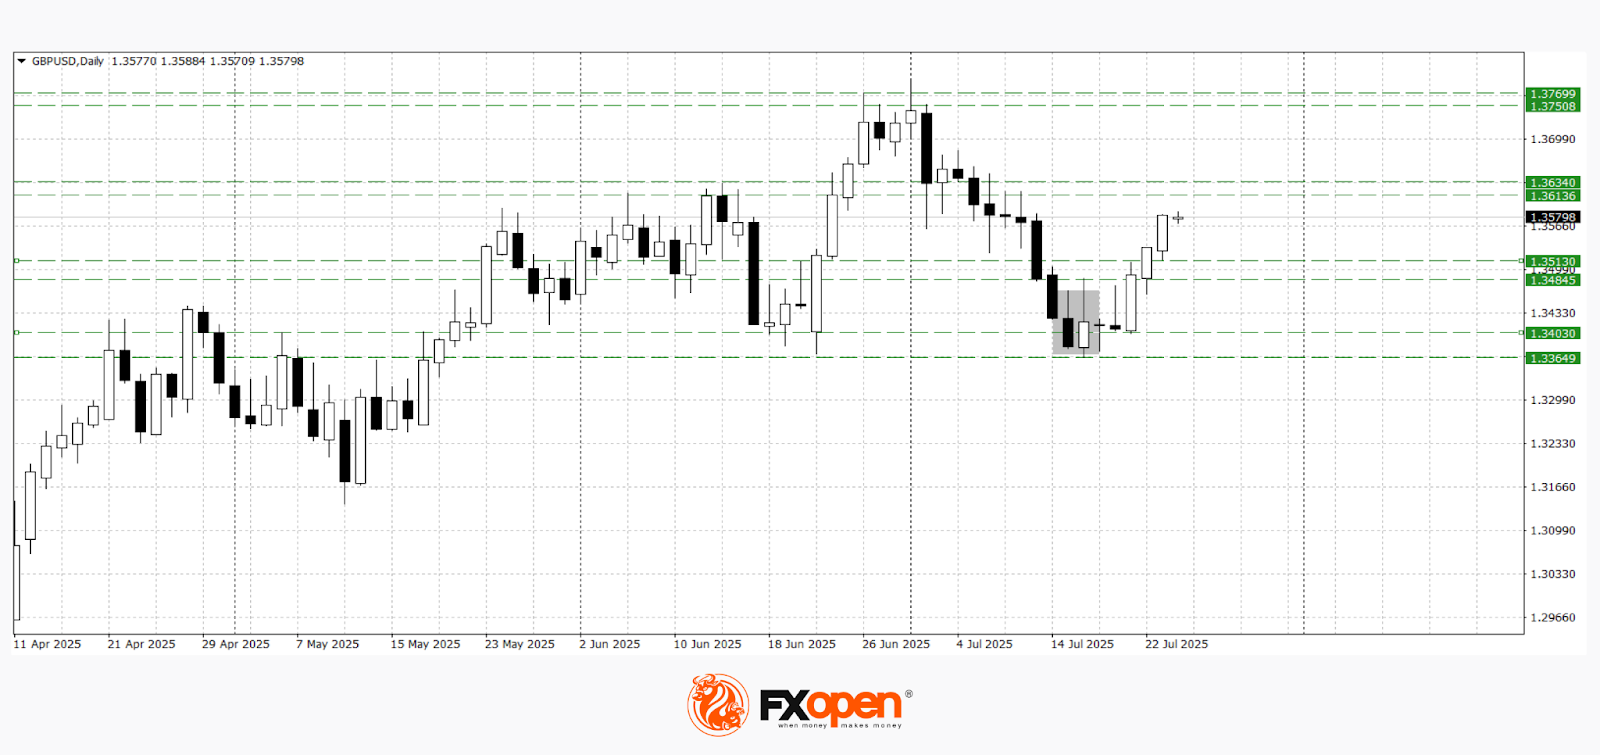
Following a test of the key support range at 1.3370–1.3400, GBP/USD formed a bullish piercing line pattern. Technical analysis suggests the potential for further upside towards the 1.3610–1.3640 area. However, in the event of weak UK macroeconomic data, the pair may retreat towards 1.3480–1.3510.
Key events likely to influence GBP/USD movement:
- Today at 11:30 (GMT+3): UK Services PMI
- Today at 11:30 (GMT+3): UK CBI Industrial Order Expectations
- Today at 16:45 (GMT+3): US Manufacturing PMI
GBP/CAD
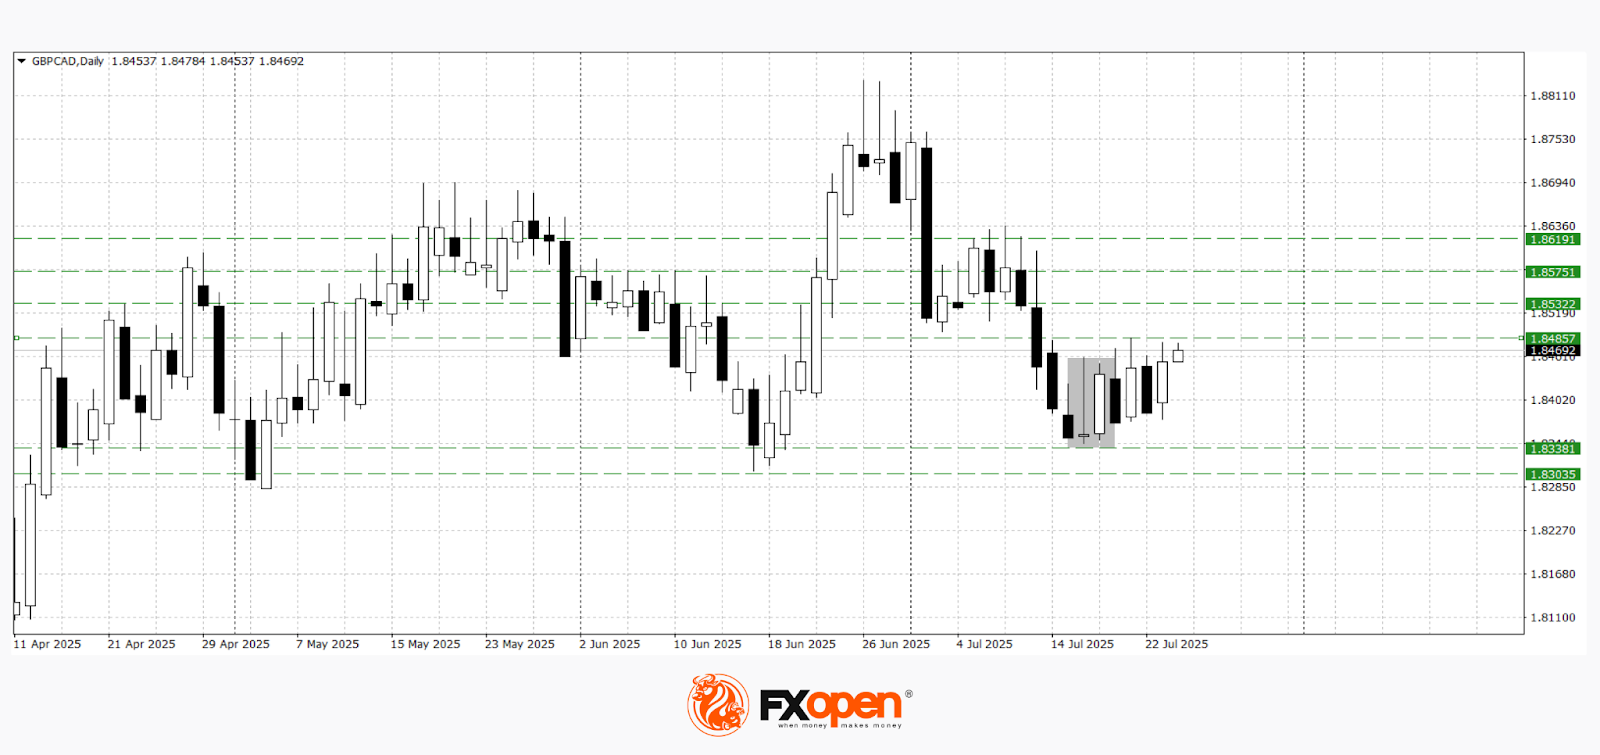
GBP/CAD has been consolidating within the 1.8340–1.8490 range for several days. A breakout above the upper boundary could see the pair test resistance at 1.8540–1.8570. However, if Canadian data proves strong or UK figures disappoint, a pullback towards 1.8300–1.8340 cannot be ruled out.
Key events likely to influence GBP/CAD pricing:
- Today at 15:30 (GMT+3): Canada Core Retail Sales
- Tomorrow at 09:00 (GMT+3): UK Core Retail Sales
- Tomorrow at 18:00 (GMT+3): Canada Federal Budget Balance
Trade over 50 forex markets 24 hours a day with FXOpen. Take advantage of low commissions, deep liquidity, and spreads from 0.0 pips. Open your FXOpen account now or learn more about trading forex with FXOpen.
This article represents the opinion of the Companies operating under the FXOpen brand only. It is not to be construed as an offer, solicitation, or recommendation with respect to products and services provided by the Companies operating under the FXOpen brand, nor is it to be considered financial advice.
Asian Stocks Rise on AI Optimism, US-EU Trade Hopes, EUR/GBP Bullish Trend Intact as ECB Looms
S&P 500 and Nasdaq 100 E-mini futures continued to edge higher in Asia’s Thursday session, up 0.1% and 0.3% respectively. Gains were supported by upbeat sentiment from Wednesday’s US session, despite mixed Q2 results from Tesla and Alphabet. Investor optimism was further boosted by President Trump’s new executive orders to bolster US artificial intelligence capabilities and improve prospects for a US-EU trade agreement.
Tesla drops on earnings miss, while Alphabet rises on AI demand
Tesla shares tumbled 4.4% in after-hours trading as Q2 earnings fell short of expectations ($0.40 EPS vs. $0.48 consensus). CEO Elon Musk’s cautious outlook—citing the phase-out of EV incentives and slow driverless tech deployment—added to the negative sentiment. In contrast, Alphabet shares rose 1.7% after beating earnings forecasts ($2.31 EPS vs. $2.16), buoyed by strong AI-driven sales growth.
US stocks rally to fresh highs, led by Dow and tech giants
The S&P 500 climbed 0.8% to a new all-time high, while the Nasdaq 100 gained 0.4%, led by Nvidia (+2.3%). The Dow Jones Industrial Average outperformed with a 1.1% jump to 45,010—just shy of its record high from December 2024. All major US indices remain in strong short-to-medium-term uptrends.
Asia markets track Wall Street gains as US-EU Trade talks advance
Asia-Pacific equities mirrored the US rally amid growing optimism that the 1 August US-EU trade deadline may yield a breakthrough. Media reports suggest progress toward a 15% tariff on most EU imports, replacing prior sticking points in negotiations.
Nikkei nears record high; STI and Hang Seng extend gains
Japan’s Nikkei 225 surged 1.7% to 41,870, closing in on its all-time high of 42,427. Hong Kong’s Hang Seng Index added 0.4%, marking its fifth straight daily gain. Meanwhile, Singapore’s Straits Times Index rose 0.8%, poised to log a 14th consecutive record close,up 11% from its 23 June low.
Japanese yen leads FX moves ahead of ECB, Gold slides toward support
The US dollar weakened further during Asia hours, with the Japanese yen outperforming major peers, gaining 0.4%. The Australian dollar also advanced by 0.3%.
The euro and sterling traded almost unchanged from Wednesday’s US session close as traders await the European Central Bank (ECB) monetary policy decision out later today, where the consensus has priced in no rate cut to maintain its key deposit rate at 2% after eight consecutive cuts.
ECB President Lagarde’s press conference will be pivotal as market participants look out for more hints to indicate ECB is at the end of its interest rate cut cycle. If such hawkish hold guidance materialises, the EUR/USD is likely to have more impetus to maintain its recent minor short-term bullish uptrend phase that kickstarted last Wednesday, 17 July.
Meanwhile, gold (XAU/USD) extended its decline, shedding 0.3% intraday after a 1.3% drop yesterday. The precious metal is now nearing a key short-term support at US$3,260, where buyers may return.
Economic data releases
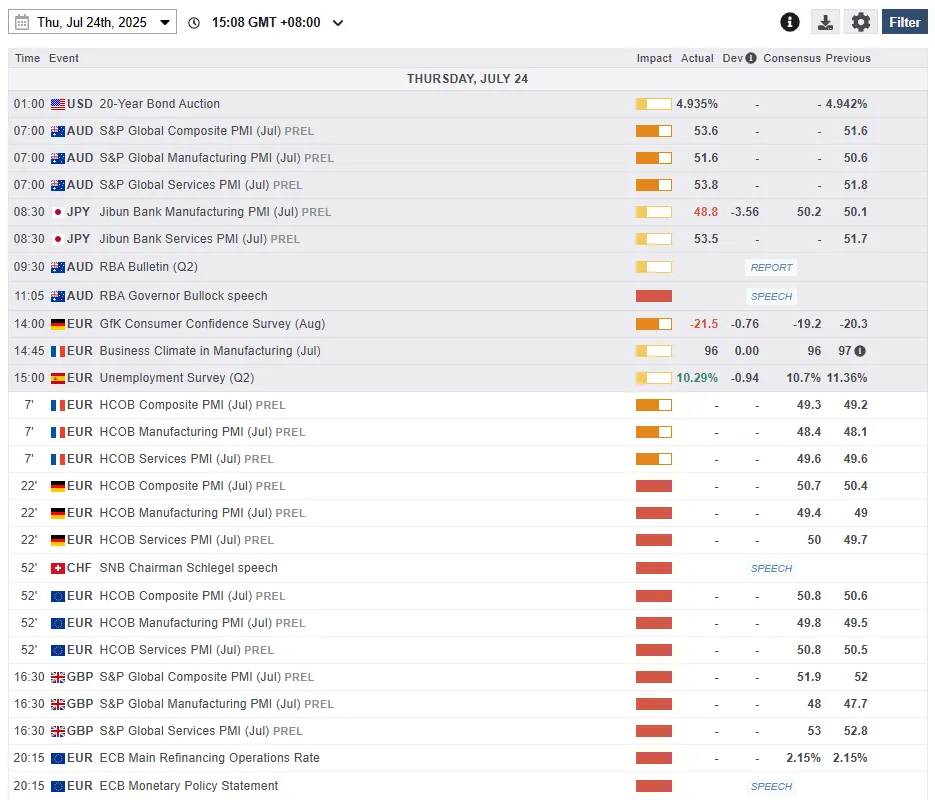
Fig 1: Key data for today’s Asia mid-session (Source: MarketPulse)
Chart of the day – EUR/GBP looks set to resume its bullish move as ECB looms
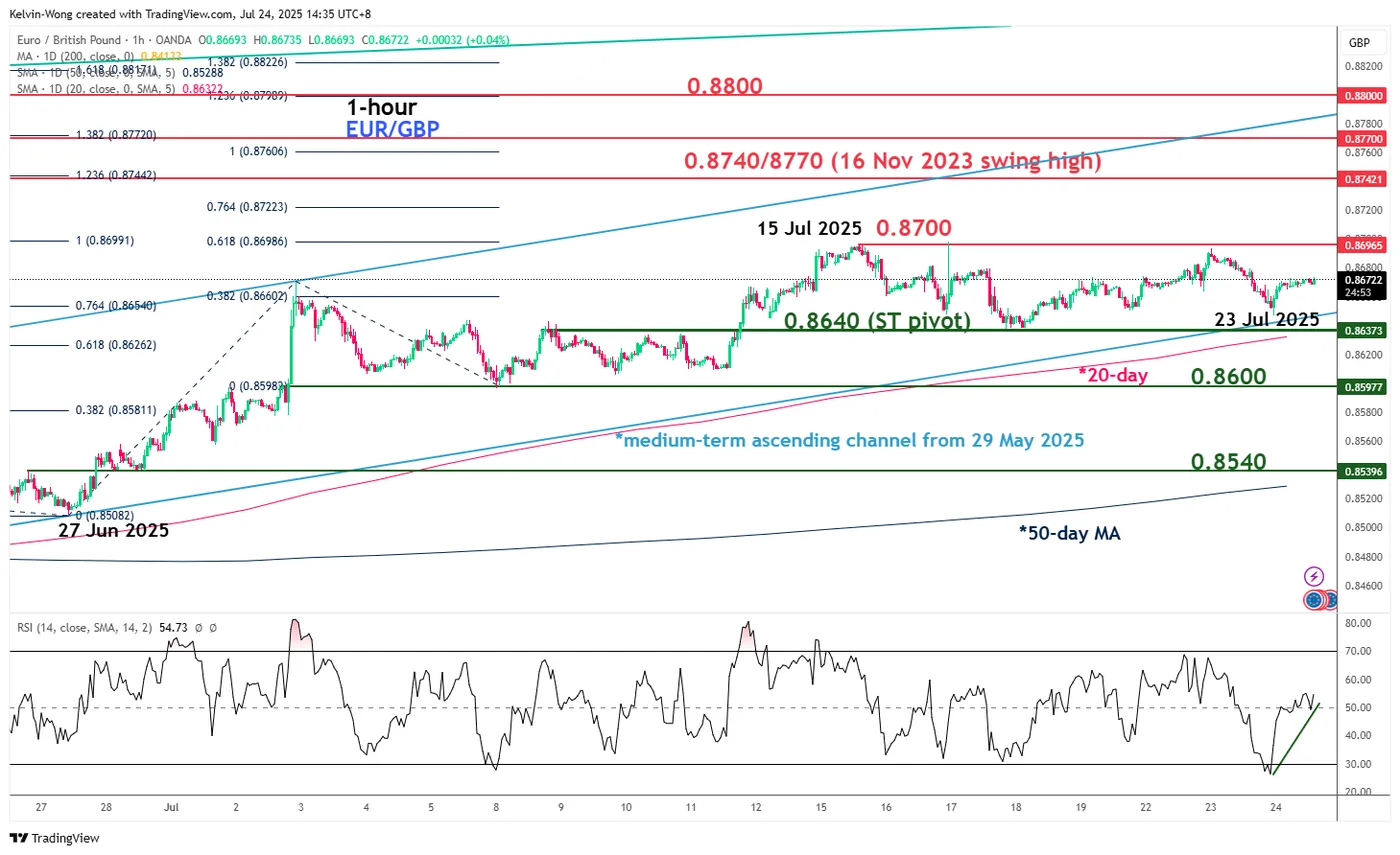
Fig 2: EUR/GBP minor & medium-term trends as of 24 July 2025 (Source: TradingView)
The recent slide of 58 pips seen on the EUR/GBP cross pair from its 15 July swing high area of 0.8700 has hit a key inflection point for the bulls to resume a potential bullish impulsive up move sequence with its short-term minor uptrend phase in place since 27 June 2025 low.
Firstly, the price action of EUR/GBP has staged a bounce right above the lower boundary of its medium-term ascending channel from 29 May 2025 low, and its rising 20-day moving average.
Secondly, the hourly RSI momentum indicator has formed a “higher low” after it hit a recent oversold reading on 23 July, which suggests a potential short-term bullish momentum revival.
Watch the 0.8640 short-term key pivotal support, and a clearance above 0.8700 increases the odds of a fresh bullish impulsive up move sequence to see the next intermediate resistances coming in at 0.8740/8770 and 0.8800 (see Fig 2).
However, a break below 0.8640 invalidates the bullish scenario for a minor corrective decline to expose the next intermediate supports at 0.8600 and 0.8540 (also the 50-day moving average).
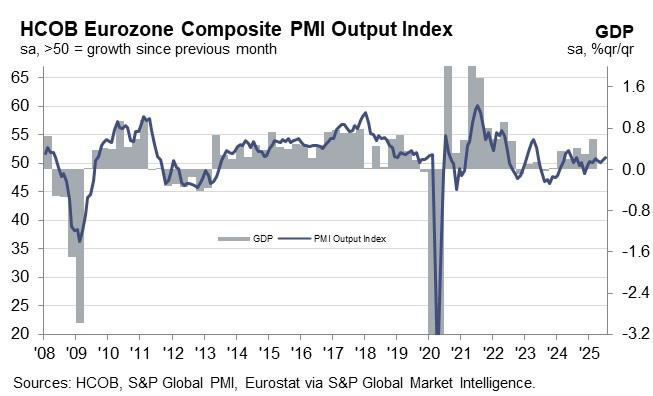
Eurozone PMI composite hit 11-month high, gradually regaining momentum
Eurozone private sector activity accelerated in July, with Composite PMI rising from 50.6 to 51.0—its highest level in 11 months. Manufacturing PMI improved slightly from 49.5 to 49.8, a 36-month high, edging closer to the 50-mark that separates expansion from contraction. Services PMI climbed to a six-month high of 51.2, from 50.5, pointing to broad-based improvement across sectors.
Cyrus de la Rubia, Chief Economist at Hamburg Commercial Bank, said the data suggests the Eurozone economy is "gradually regaining momentum." The manufacturing recession is "coming to an end," while services growth has picked up. Their GDP Nowcast model indicates the region is on track for “robust economic growth” in Q3, with Germany likely to show slight expansion while France may post a mild contraction, partly due to its domestic political uncertainty.
For the ECB, the data offers some relief. Services inflation—a key focus for policymakers—continued to ease in July. While goods prices stabilized, a stronger Euro and ongoing US tariffs are expected to put downward pressure on price levels in the months ahead.
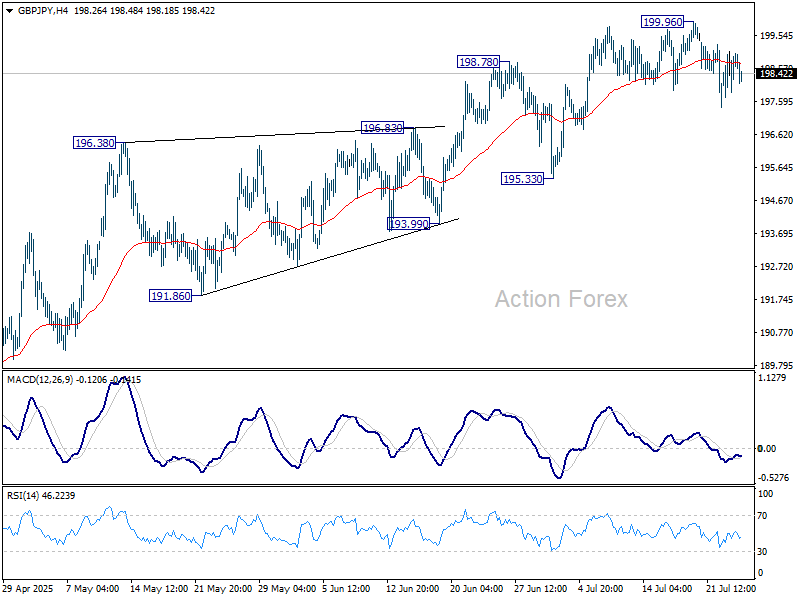
GBP/JPY Daily Outlook
Daily Pivots: (S1) 198.14; (P) 198.61; (R1) 199.48; More...
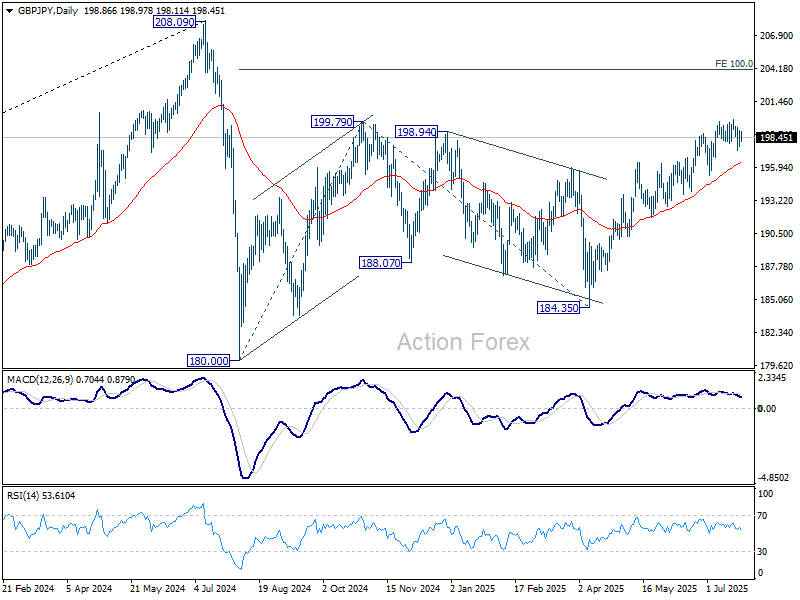
GBP/JPY is still bounded in consolidations below 199.96 and intraday bias stays neutral. While deeper pullback cannot be ruled out, further rally will remain in favor as long as 195.33 support holds. Above 199.96 will resume the rise from 184.35 to 100% projection of 180.00 to 199.79 from 184.35 at 204.14.
In the bigger picture, price actions from 208.09 (2024 high) are seen as a correction to rally from 123.94 (2020 low). The pattern might still extend with another falling leg. But in that case, strong support should be seen from 38.2% retracement of 123.94 to 208.09 at 175.94 to contain downside. Meanwhile, decisive break of 208.09 will confirm long term up trend resumption.
EUR/JPY Daily Outlook
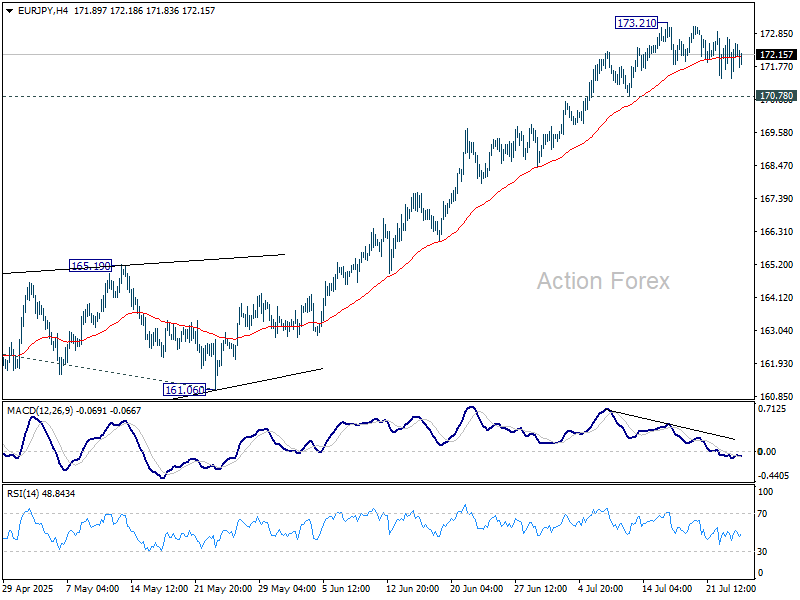
Daily Pivots: (S1) 171.71; (P) 172.22; (R1) 173.08; More...
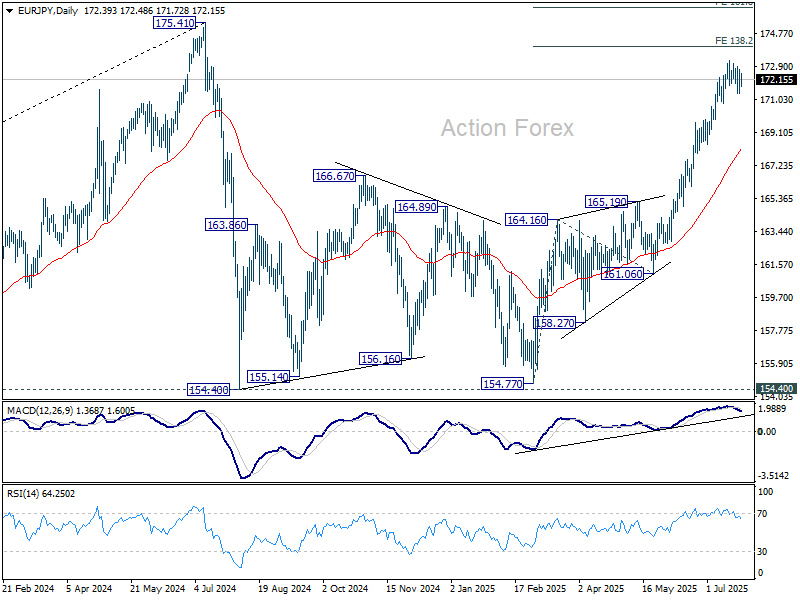
Intraday bias in EUR/JPY remains neutral as consolidations continue below 173.21. With 170.78 support intact, further rally is expected. On the upside, break of 173.21 will target 138.2% projection of 154.77 to 164.16 from 161.06 at 174.03. Break there will bring retest of 175.41 high. Nevertheless, considering bearish divergence condition in 4H MACD, break of 170.78 will indicate short term topping, and turn bias to the downside for deeper pullback.
In the bigger picture, price actions from 175.41 (2024 high) are seen as correction to up trend from 114.42 (2020 low). The pattern might still extend with another falling leg. But in that case, strong support should be seen from 38.2% retracement of 114.42 to 175.41 at 152.11 to contain downside. Meanwhile, decisive break of 175.41 will confirm long term up trend resumption.
EUR/GBP Daily Outlook
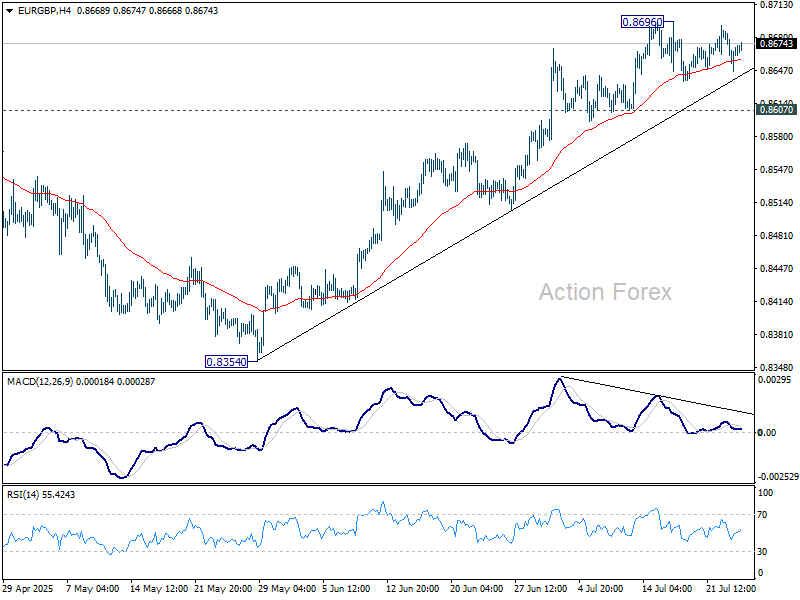
Daily Pivots: (S1) 0.8647; (P) 0.8669; (R1) 0.8690; More...
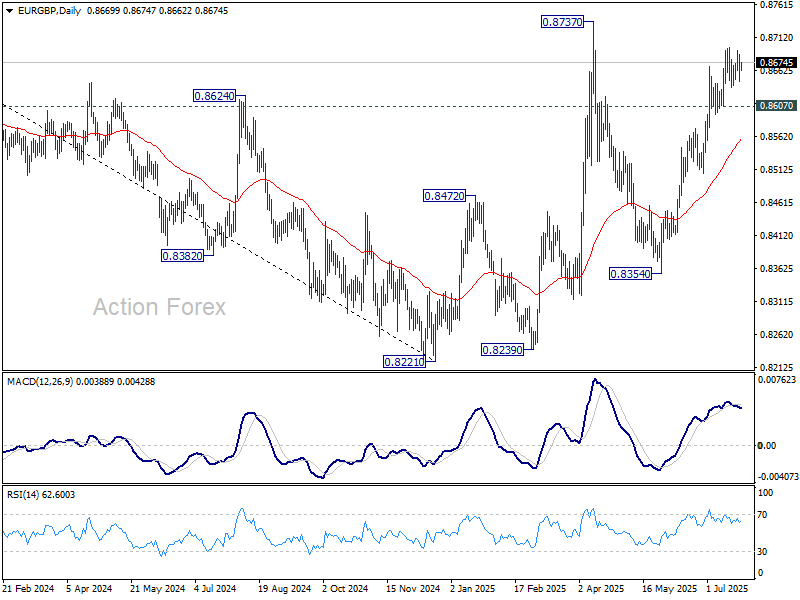
Intraday bias in EUR/GBP remains neutral as sideway consolidations continue below 0.8696. Further rally is expected with 0.8607 support intact. On the upside, above 0.8696 will bring retest of 0.8737 high. However, firm break of 0.8607 will confirm short term topping, on bearish divergence condition in 4H MACD. Deeper fall should be seen back to 55 D EMA (now at 0.8559).
In the bigger picture, the structure from 0.8221 medium term bottom are not impulsive enough to suggest that it's reversing the down trend from 0.9267 (2022 high). But even if it's a correction, firm break of 0.8737 will still pave the way to 61.8% retracement of 0.9267 to 0.8221 at 0.8867. For now, further rise will remain in favor as long as 55 W EMA (now at 0.8474) holds.
EUR/AUD Daily Outlook
Daily Pivots: (S1) 1.7745; (P) 1.7852; (R1) 1.7937; More...
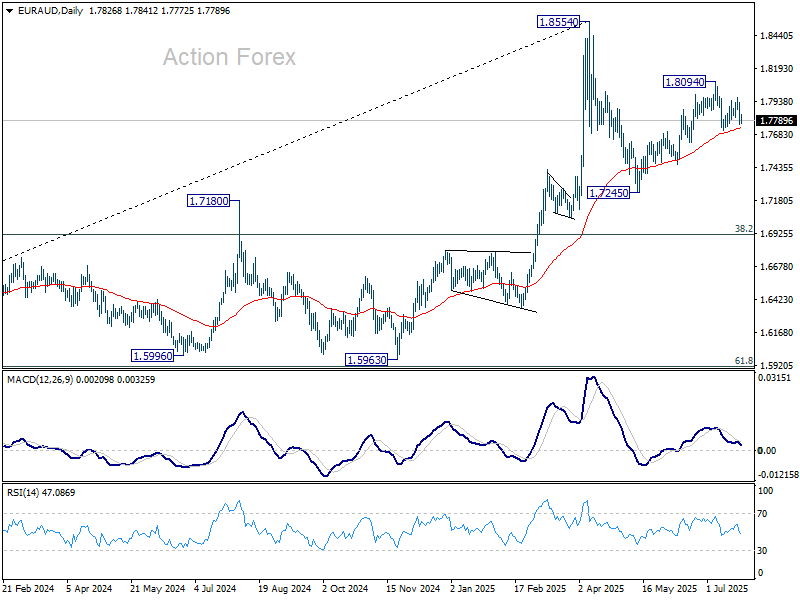
Intraday bias in EUR/AUD remains neutral first. on the downside, break of 1.7717 support will revive the case that rise from 1.7245 has completed. Corrective pattern from 1.8554 should have then started the third leg. Intraday bias will be back on the downside for 1.7459 support next. On the upside, above 1.7972 will bring retest of 1.8094 resistance.
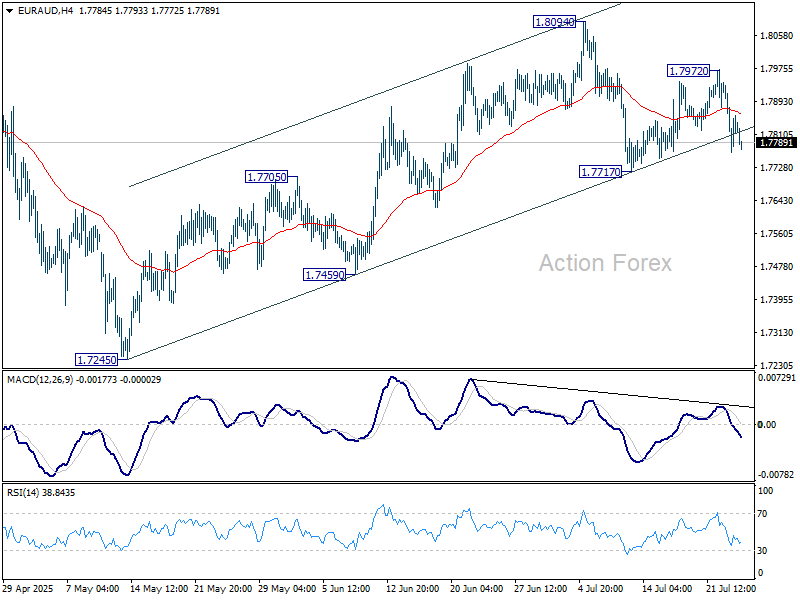
In the bigger picture, price actions from 1.8554 medium term top are seen as a corrective pattern. While deeper pullback might be seen, downside should be contained by 38.2% retracement of 1.4281 (2022 low) to 1.8554 at 1.6922 to bring rebound. Up trend from 1.4281 is expected to resume at a later stage.