Sample Category Title
AUDUSD Elliott Wave Outlook: Impulse Pattern Approaching To End
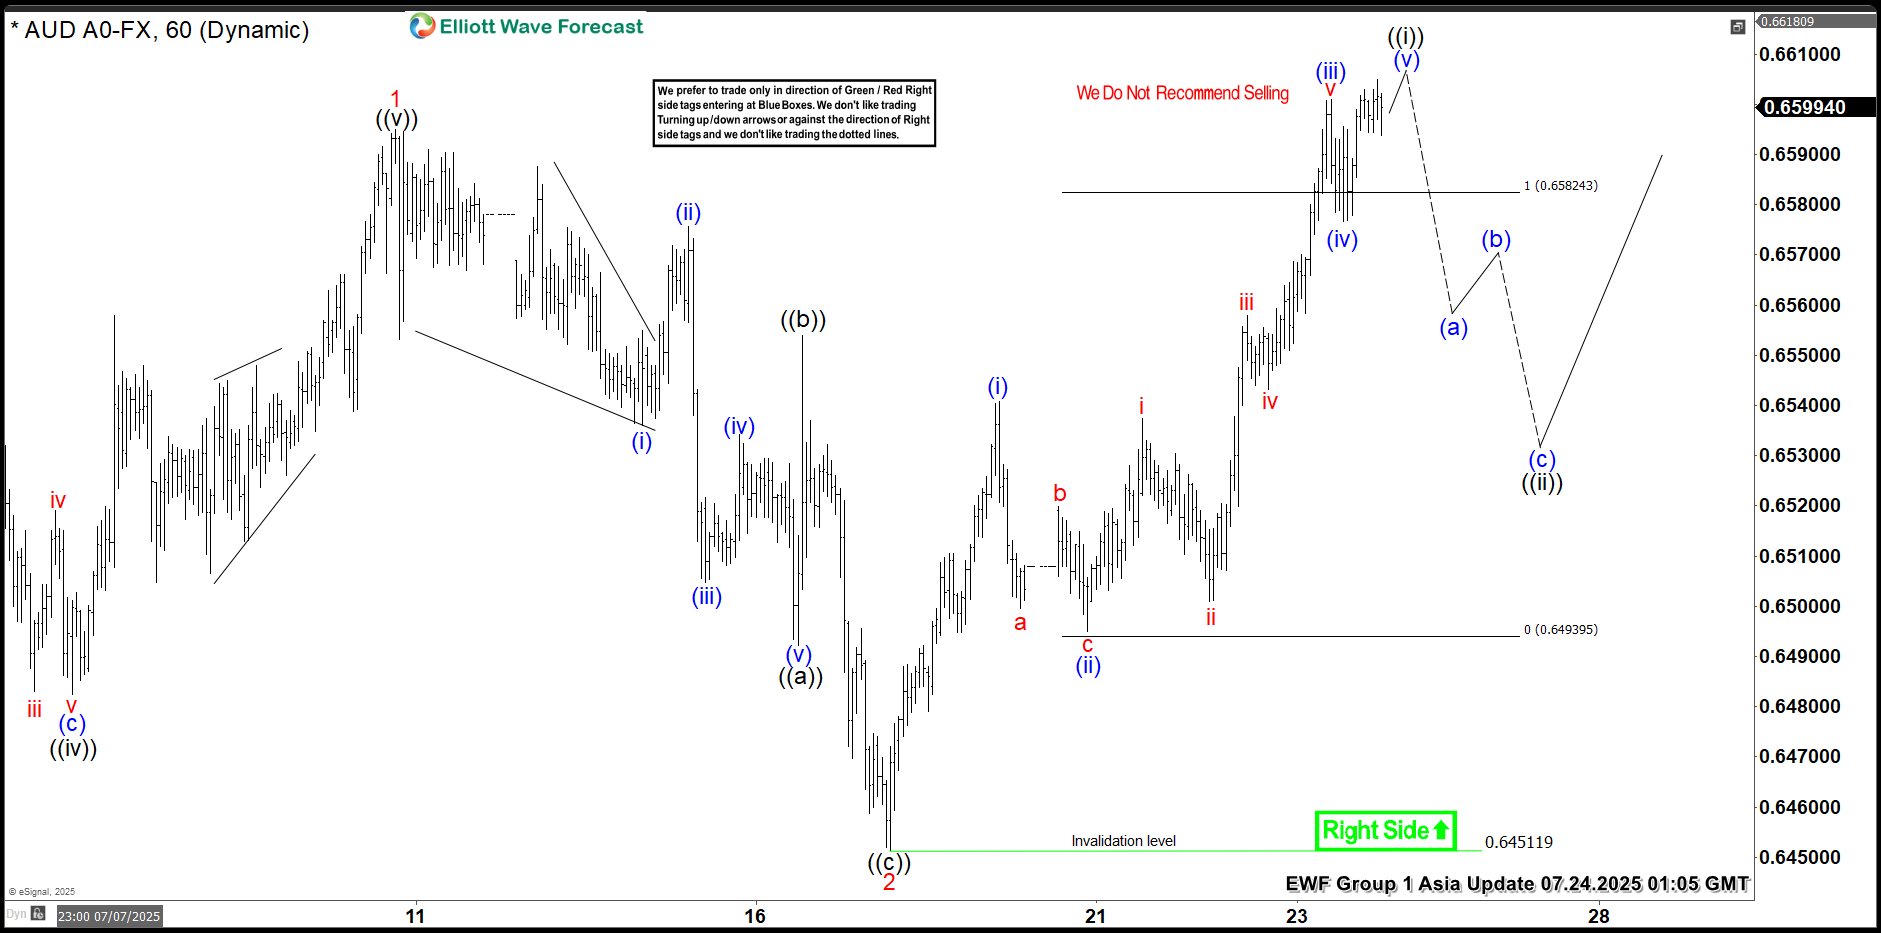
The AUDUSD pair is showing higher high from 4.09.2025 low, expecting rally to continue from 5.12.2025 low. It favors zigzag corrective bounce from April-2025 low & should continue rally against 0.6451 low. In daily, it started corrective bounce from 4.09.2025 low & may extend towards 0.6720 – 0.6955 area in next few weeks. Above 4.09.2025 low, it ended (A) at 0.6515 high of 5.06.2025, (B) at 0.6354 low of 5.12.2025 & favors upside in (C). Ideally, (C) can extend towards 0.6955 or higher levels, while pullback holds above 5.12.2025 low. Within (C), it placed 1 at 0.6595 high, 2 at 0.6451 low in corrective pullback & favors upside in 3. Within 1, it ended ((i)) at 0.6552 high, ((ii)) at 0.6369 low, ((iii)) at 0.6590 high, ((iv)) at 0.6451 low & ((v)) at 0.6595 high in overlapping diagonal. Below 1 high, it ended 2 in zigzag correction at extreme area before resume rally in 3.
It placed ((a)) of 2 at 0.6492 low in 5 swings, ((b)) at 0.6554 high & ((c)) at 0.6451 low in 5 swings. Wave 2 pullback ended at 0.618 Fibonacci retracement of 1. Within 3, it favors impulse in ((i)) started from 7.17.2025 low. It placed (i) of ((i)) at 0.6540 high, (ii) at 0.6495 low, (iii) at 0.6601 high, (iv) at 0.6576 low & favor upside in (v) targeting in to 0.6606 – 0.6637 area to finish it. It already reached minimum area, but can see more upside above 0.6593 low. Alternatively, the current move even can be (iii) of ((i)) followed by small pullback in (iv) & higher in (v). Later, it expects ((ii)) to correct in 3, 7 or 11 swings against 7.17.2025 low & find support from extreme area to continue rally. Wave 3 should extend in to 0.6692 – 0.6841 area in 5 swings before correcting in 4 of (C). We like to buy the pullback in 3, 7 or 11 swings at extreme area against 7.17.2025 low.
AUDUSD – 60-Minute Elliott Wave Technical Chart:
AUDUSD Elliott Wave Technical Video:
https://www.youtube.com/watch?v=S0Yb29upmlM
RBA’s Bullock flags slower disinflation, sticks with gradual easing bias
RBA Governor Michele Bullock signaled in a speech caution over the inflation outlook, warning that the fall in trimmed mean inflation in Q2 "may not be quite as much as we forecast". While headline CPI is expected to dip into the lower half of the 2–3% target range, Bullock stressed that temporary cost-of-living relief is playing a role, and underlying pressures may prove more persistent. The RBA still anticipates inflation drifting toward 2.5%, but Bullock emphasized "we are looking for data to support this expectation".
On the labor market, Bullock dismissed surprise around the recent rise in unemployment to 4.3%, saying the outcome was in line with RBA’s May forecasts. Although the June monthly figure saw a noticeable uptick, vacancy rates remain stable and leading indicators "are not pointing to further significant increases in the unemployment rate in the near term."
Overall, she reaffirmed that a “measured and gradual” policy approach remains appropriate, especially with global risks—such as the trade war—showing signs of easing. Her remarks suggest the RBA remains on track for further easing, but will move cautiously, with the pace largely dictated by data flow—particularly the upcoming Q2 CPI print.
Ethereum Cools After Rally, But Bulls Eye $4K in Post-Pullback Surge
Key Highlights
- Ethereum gained over 25% and tested the $3,850 resistance zone.
- ETH is now well above a connecting bullish trend line with support at $3,150 on the daily chart.
- Bitcoin price is consolidating gains below the $120,000 resistance.
- XRP rallied toward the $3.65 resistance before trimming some gains.
Ethereum Technical Analysis
Ethereum started a major increase above the $2,650 and $2,800 resistance levels. ETH cleared the $3,000 barrier and rallied above $3,500 before facing hurdles.
Looking at the daily chart, the price settled above the $3,500 level and the 100-day simple moving average (red). A high was formed at $3,856 and the price is now consolidating gains. On the downside, Ethereum might find support near the $3,500 level.
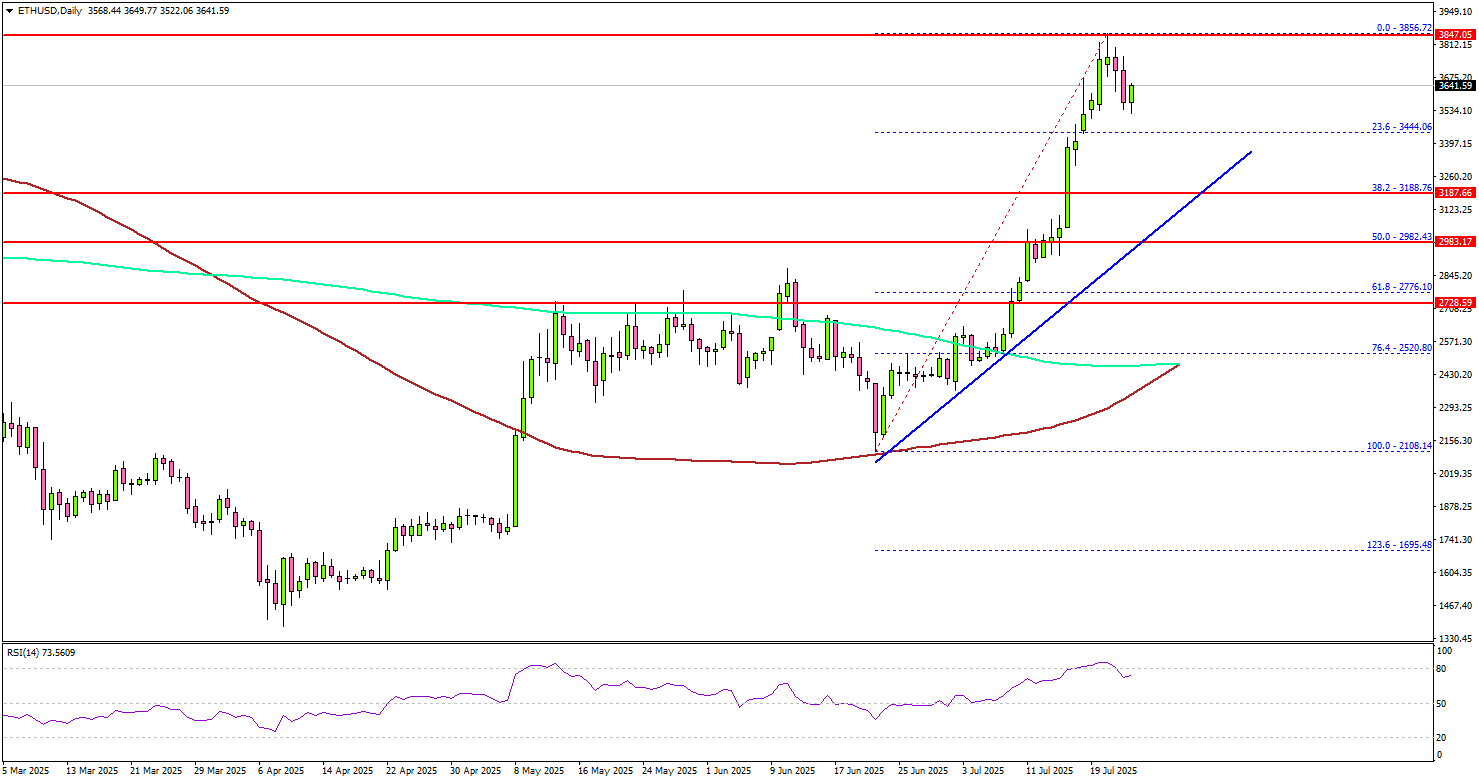
The next major support is $3,450 or the 23.6% Fib retracement level of the upward move from the $2,108 swing low to the $3,856 high, below which the price could slide toward $3,200.
There is also a connecting bullish trend line forming with support at $3,150 on the same chart. Any more losses might call for a move toward the $3,000 level or the 50% Fib retracement level of the upward move from the $2,108 swing low to the $3,856 high.
On the upside, the price is facing hurdles near the $3,800 level. The next major resistance is near the $3,850 level. A daily close above the $3,850 resistance zone could start another steady increase. In the stated case, the price may perhaps rise toward the $4,000 level. The next stop for the bulls may perhaps be $4,200.
Looking at Bitcoin, there was a steady increase above the $118,000 level but the bulls struggled to keep the price above the $120,500 level.
Economic Releases
- US Manufacturing PMI for July 2025 (Preliminary) – Forecast 52.5, versus 52.0 previous.
- US Services PMI for July 2025 (Preliminary) – Forecast 53.0, versus 52.9 previous.
- US Initial Jobless Claims - Forecast 227K, versus 221K previous.
RBNZ’s Conway: Tariff fallout to cool NZ inflation
Speaking today, RBNZ Chief Economist Paul Conway said rising global tariffs and economic uncertainty are likely to "reduce medium-term inflation pressures" in New Zealand, and drag on the country’s economic rebound through mid-2026. While the US faces rising costs from tariff-induced supply chain disruptions, Conway said New Zealand is more likely to experience disinflation due to lower global growth and falling import prices.
He highlighted that strong export prices—particularly for dairy and beef—alongside lower domestic interest rates are supporting the economy for now. But widespread uncertainty is causing both consumers and firms to take a wait-and-see approach, which is curbing spending and delaying investment decisions.
Given this backdrop, Conway confirmed that the RBNZ retains a dovish tilt. If inflation continues to ease as expected, there is "scope to lower the OCR further".
Japan’s PMI composite unchanged at 51.5, inflation to ease over the summer
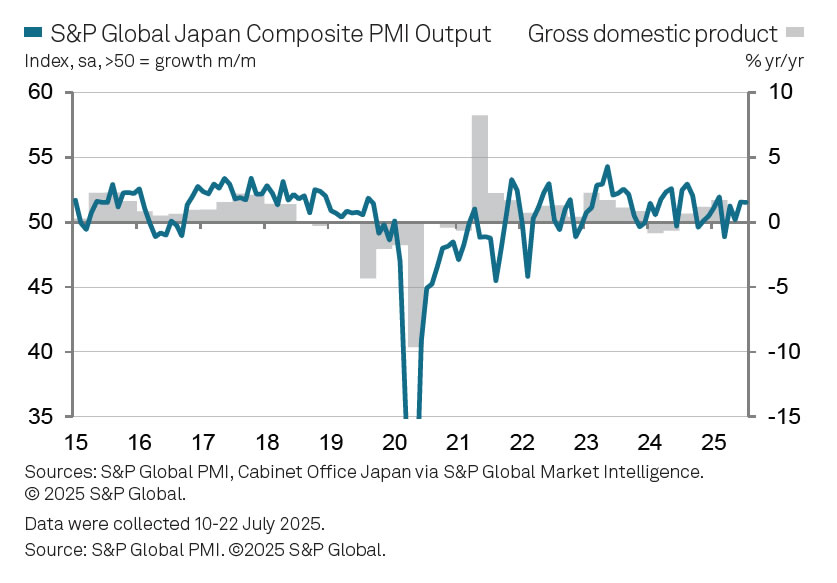
Japan’s Composite PMI was unchanged at 51.5 in July. Services drove growth, rising from 51.7 to 53.5, while Manufacturing slipped into contraction at 48.8, down from 50.1.
S&P Global noted that manufacturers saw weaker output and new orders, weighed down by tariff uncertainty and cautious customer behavior. Confidence weakened across the board, with optimism falling to the second-lowest level since August 2020. Firms responded by slowing hiring to the weakest pace in 18 months.
On the positive side, cost pressures eased, with input inflation at a four-year low—suggesting headline "inflation may ease further over the summer".
Australia PMI composite surges to 53.6, but inflation concerns linger
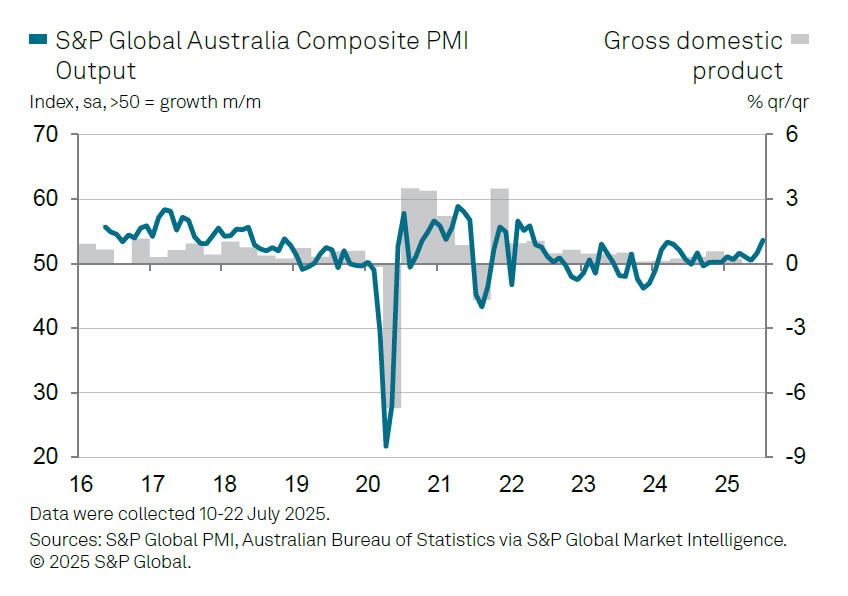
Australia’s private sector expanded more strongly in July, with the S&P Global Composite PMI rising from 51.6 to 53.6. Services led the way with a sharp rise from 51.8 to 53.8. Manufacturing returned to firmer growth at 51.6, up from 50.6.
S&P Global noted that business activity growth "hastened" at the start of Q3, supported by one of the fastest paces of new manufacturing orders in over two-and-a-half years.
However, the upbeat data came with warning signs. Business confidence slipped to an eight-month low, while manufacturers cut back on purchasing and slowed hiring. More critically, price pressures "intensified" during the month, pointing to renewed upside risks for inflation and "adding to the uncertainty for the interest rate outlook."
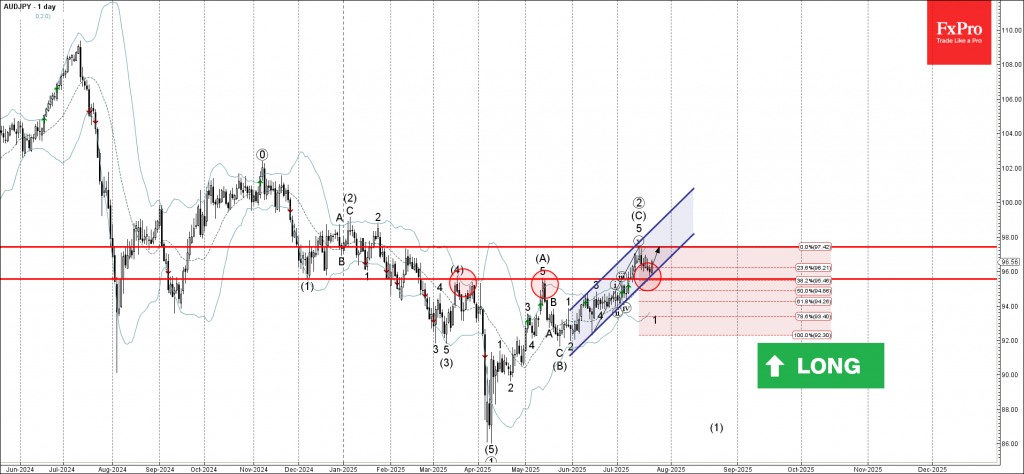
AUDJPY Wave Analysis
AUDJPY: ⬆️ Buy
- AUDJPY reversed from support zone
- Likely to rise to resistance level 97.40
AUDJPY currency pair recently reversed up from the support zone located between the pivotal support level 95.55 (former monthly high from March and May), 20-day moving average and support trendline of the daily up channel from May.
This support zone was further strengthened by the 38.2% Fibonacci correction of the upward impulse from June.
AUDJPY currency pair can be expected to rise to the next resistance level 97.40, former monthly high from February, which also stopped the earlier impulse wave earlier this month.
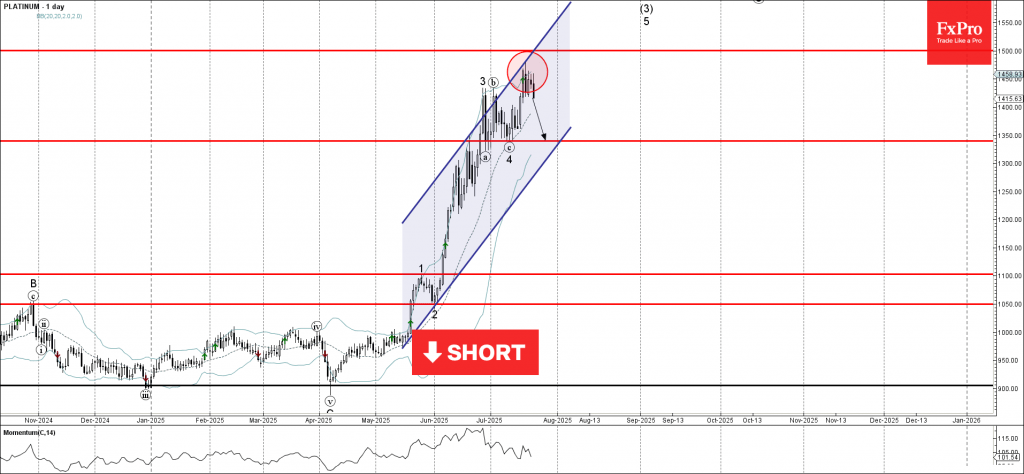
Platinum Wave Analysis
Platinum: ⬇️ Sell
- Platinum reversed from resistance zone
- Likely to fall to support level 1350.00
Platinum recently reversed down from the resistance zone located between the round resistance level 1500.00, upper daily Bollinger Band and the resistance trendline of the daily up channel from May.
The downward reversal from this resistance created the daily Japanese candlesticks reversal pattern Bearish Engulfing.
Given the weakening daily Momentum (showing bearish divergence), Platinum can be expected to fall to the next support level 1350.00 (low of the previous correction 4).
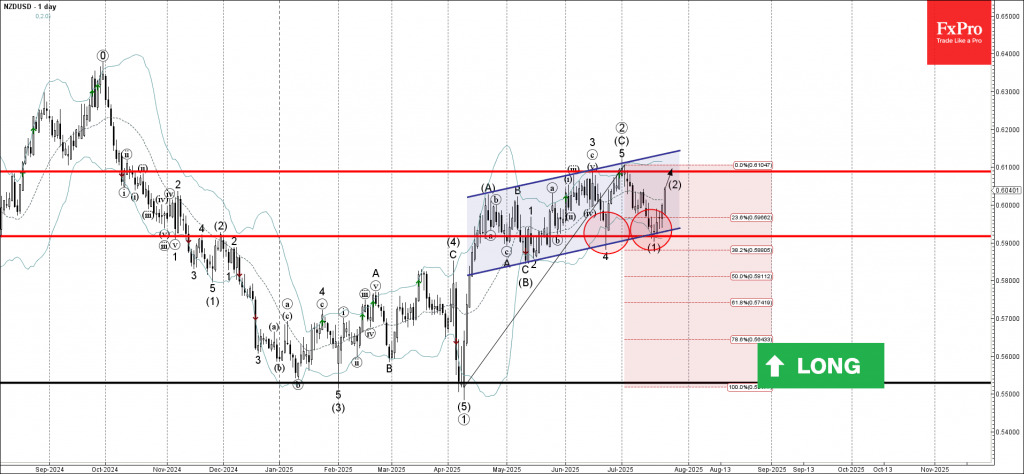
NZDUSD Wave Analysis
NZDUSD: ⬆️ Buy
- NZDUSD reversed from support zone
- Likely to rise to resistance level 0.6100
NZDUSD recently reversed up from the support zone located between the key support level 0.5920 (which stopped wave 4in the middle of June), lower daily Bollinger Band and the support trendline of the daily up channel from April.
The upward reversal from this support zone started the active intermediate correction (2).
Given the clear daily uptrend, NZDUSD can be expected to rise to the next resistance level 0.6100, target price for the completion of the active correction (2) (which has been reversing the price from June).
FTSE 100 Wave Analysis
FTSE 100: ⬆️ Buy
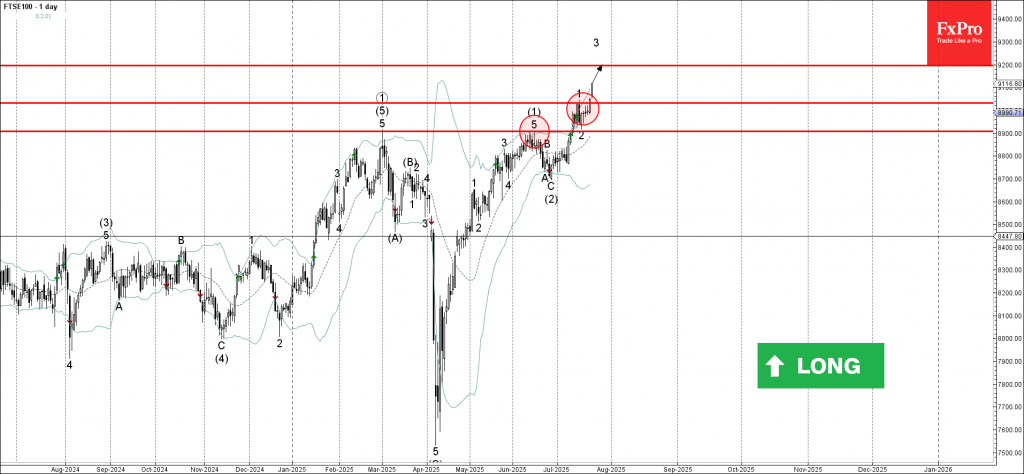
- FTSE 100 broke resistance level 9030.00
- Likely to rise to resistance level 9200.00
FTSE 100 Index recently broke above the resistance level 9030.00, which stopped the previous minor impulse wave 1 at the start of July.
The breakout of the resistance level 9030.00 continues the active minor impulse wave 3 – which belongs to the intermediate impulse wave (3) from the end of July.
Given the clear daily uptrend, FTSE 100 Index can be expected to rise to the next resistance level 9200.00 (target price for the completion of the active impulse wave 3).