Sample Category Title
FTSE 100 Hits Record High Amid European Market Surge, Tesla & Alphabet Earnings Ahead
European Open - US/EU Trade Deal Hopes Rise
European stocks rose over 1% on Wednesday, driven by gains in carmaker shares, after US President Trump raised hopes for a trade deal with the EU following an agreement with Japan.
The STOXX 600 index climbed 1.1% to 550.14 after three days of losses, while the UK’s FTSE 100 hit a record high, rising 0.5%. France’s CAC 40 led the gains, jumping 1.3%.
OAU-PRS-236-MarketPulse-variant2-Square
Automobile stocks surged 3.6%, with companies like Mercedes-Benz, Volkswagen, and Porsche seeing increases of 5.1% to 7.4%, boosted by strong performance in Asia.
Trump’s trade deal with Japan reduced U.S. auto import tariffs from 25% to 15% and included $550 billion in US-bound investments and loans. This also improved the chances of an EU-US trade deal, as EU representatives were set to begin negotiations on Wednesday.
In the STOXX 600, Temenos saw the biggest gain, jumping 18.1% after raising its full-year earnings forecast.
UniCredit rose 3.4% as the Italian bank reported better-than-expected profits and improved its yearly outlook. Swiss company Lonza also gained 6.3% after beating profit expectations.
On the downside, Nokia dropped 7.7% after lowering its 2025 profit forecast, putting pressure on media stocks. ASM International fell 9.3%, the biggest drop in the index, due to disappointing second-quarter bookings.
SAP slipped 2.5% despite reporting higher profits, helped by cost cuts and strong demand.
Overall, European corporate earnings forecasts showed slight improvement on Tuesday.
On the FX front, the yen initially strengthened to 146.20 per dollar, its highest since July 11, after trade news. However, it later fell following reports that Ishiba plans to step down next month after losing an upper house election, something Ishiba has since denied.
The US dollar has been weak since Trump announced tariffs in April but has stabilized somewhat this month as those tariffs were paused for negotiations.
The euro dipped 0.1% to 1.1744 but stayed close to its four-year high from earlier this month. The British pound rose slightly to 1.1354.
The Australian dollar gained 0.4% to $0.6581, helped by optimism from the trade deal and higher metal prices, though caution remains.
Currency Power Balance
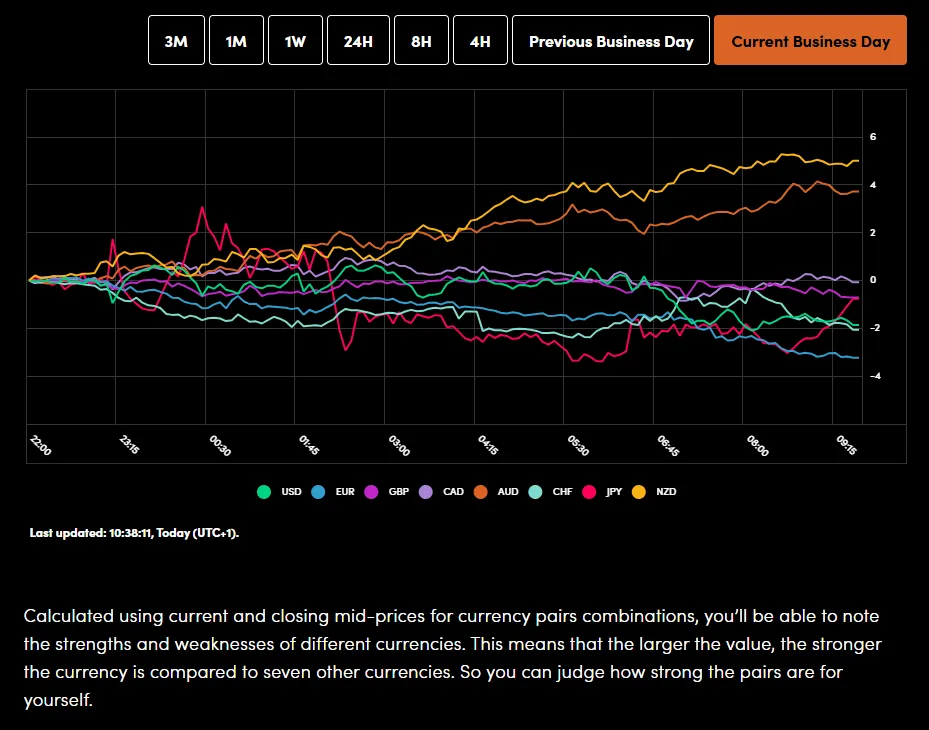
Source: OANDA Labs
Gold prices have continued their rise this morning despite the improvement in sentiment. Another factor highlighting the ongoing concerns from market participants around potential trade deals yet to be announced. Gold was last trading around around the $3330/oz handle.
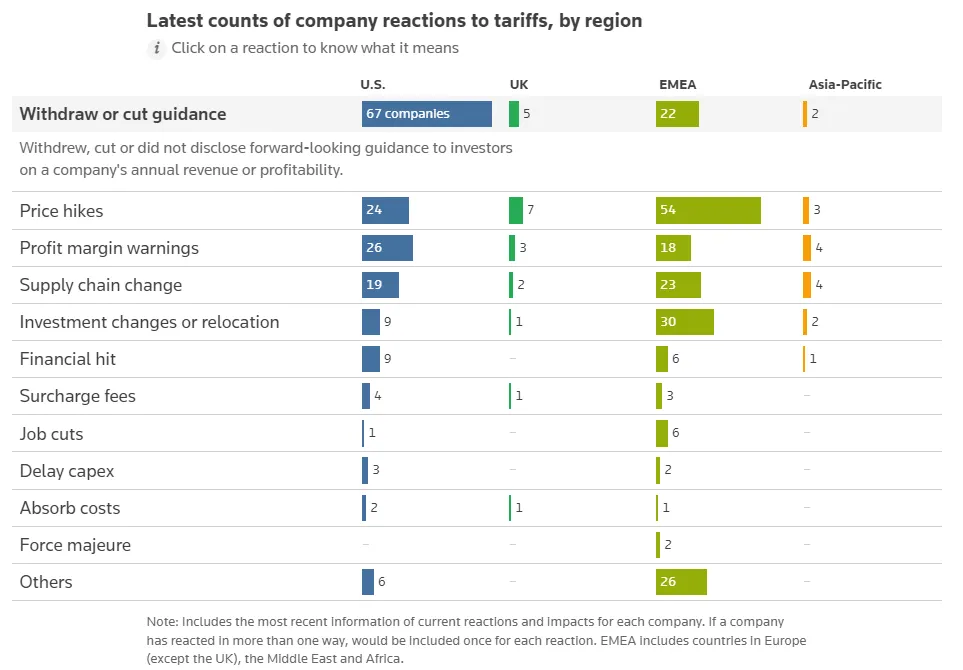
How are Companies Responding to US Tariffs?
Given that Earnings season is now in full flow, Reuters have been tracking company responses to tariffs. As of July 23, Reuters has counted around 279 companies worldwide that have reacted to tariffs in some way or form.
The estimated costs to the companies stood at over $34 billion dollars as of the end of May. The tally by Reuters is based on various sources and statements from company officials and includes analysis of financial reports and interviews as well.
Source: LSEG
Central Banks have been cautious and have no doubt been keeping an eye on these increases as the idea is that this will be passed down to consumers once the August deadline has passed. This in turn could have implications for inflation moving forward and increase the cost of living for citizens across the globe.
Economic Data Releases and Final Thoughts
Looking at the economic calendar, it is a quiet day in terms of data releases with EU consumer confidence flash data due later in the day.
However, earnings season brings some big names after the market closes today. Among the big names reporting will be Alphabet (Google), Tesla, T-Mobile and IBM.
This will be the first glance for market participants from the mag 7 stocks which could stoke some interesting market reactions depending on the release.
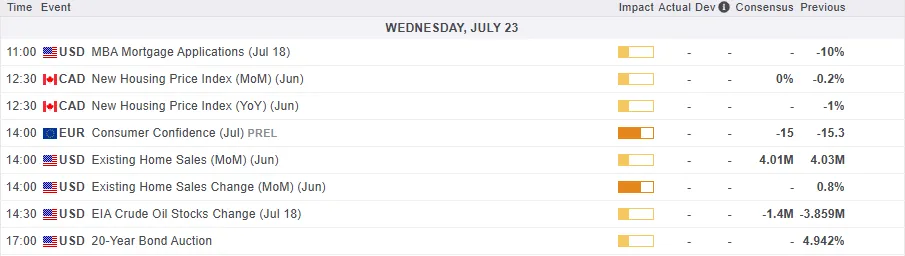
For all market-moving economic releases and events, see the MarketPulse Economic Calendar. (click to enlarge)
Chart of the Day - FTSE 100 Index
From a technical standpoint, the FTSE 100 index is pushing higher now within touching distance of the 9100 handle.
Improved trade deal sentiment and the impressive rally on Wall Street could be the driving force.
The FTSE is now in overbought territory and this may be something worth monitoring moving forward.
Immediate support rests at 9048 before the 9000 handle comes into focus.
The upside does not have any historical data to focus on and thus i will look toward psychological numbers like 9250 and potentially 9500.
FTSE 100 Daily Chart, July 23. 2025
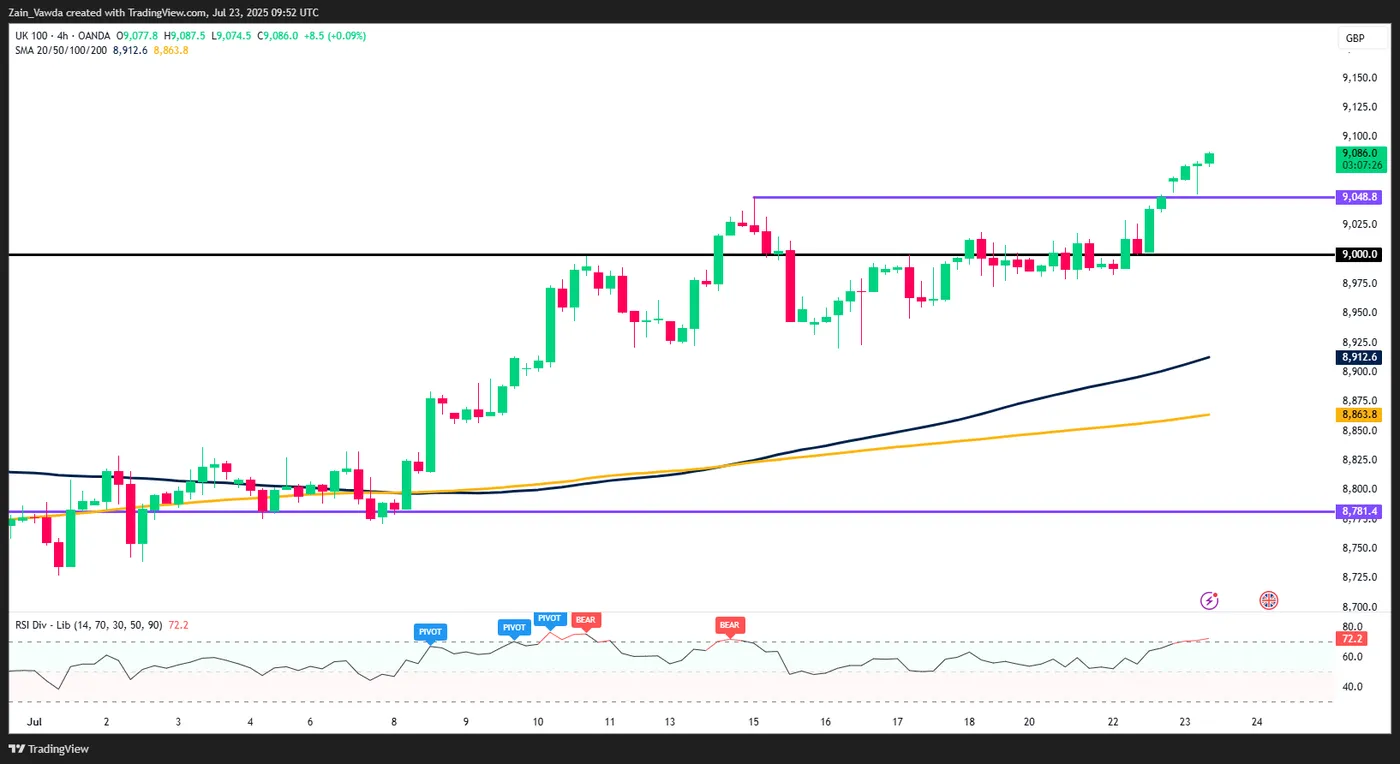
Source: TradingView.com (click to enlarge)
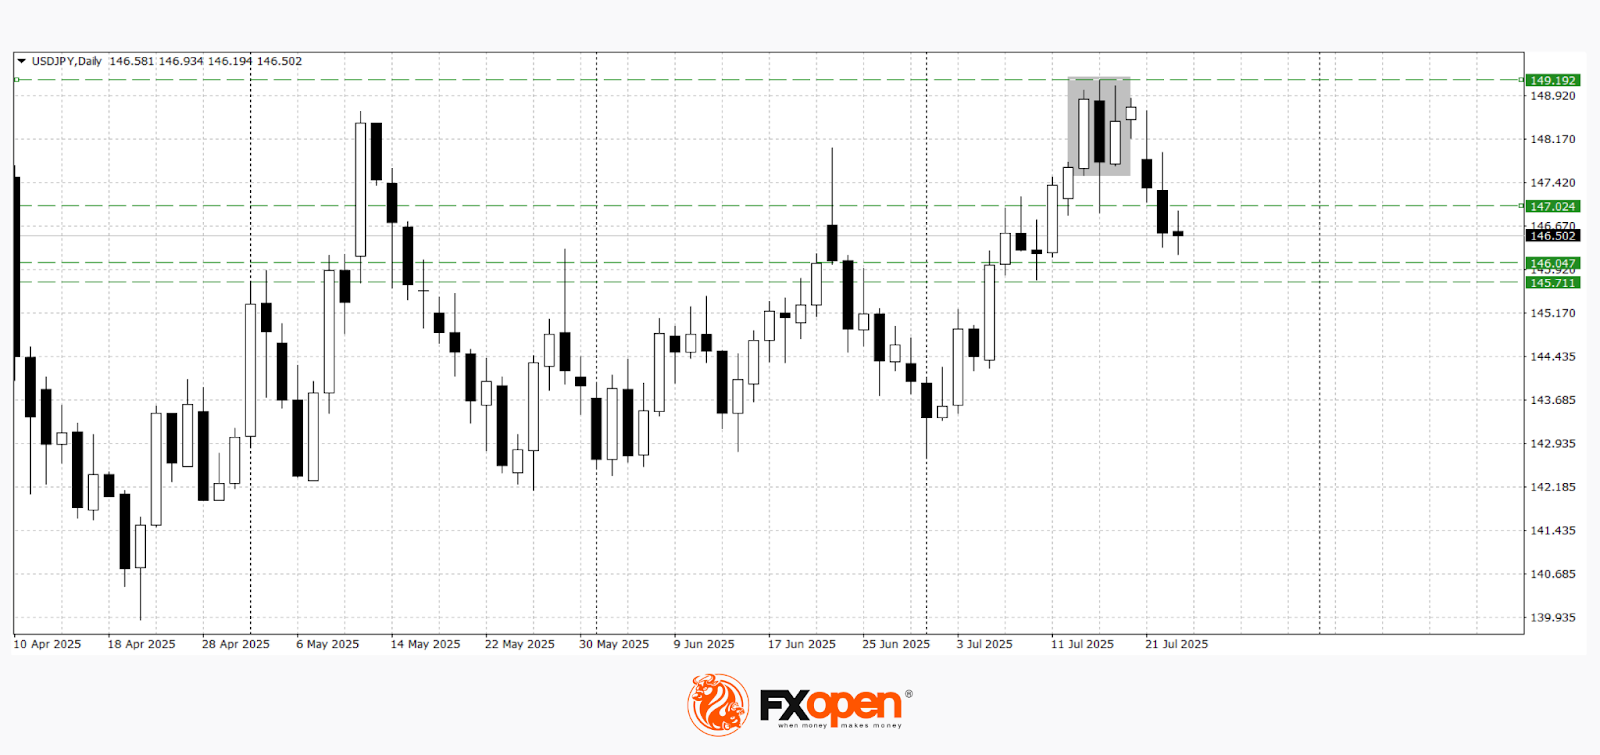
USD/JPY Falls as Japan and US Reach Trade Agreement
The USD/JPY pair dropped to 146.91 on Wednesday, marking a one-week low, following news that the US and Japan have finalised a trade deal.
US President Donald Trump announced that the agreement will impose a 15% tariff on Japanese exports to the US. Additionally, Japan has committed to investing $550 billion into the US economy while granting American goods greater access to key sectors of its domestic market.
Japanese Prime Minister Shigeru Ishiba confirmed his awareness of the negotiations but refrained from disclosing specifics, stressing his commitment to protecting "national interests." Japanese media reports suggest Ishiba may consider resigning depending on the outcome of the tariff discussions.
Political uncertainty in Japan has intensified after the ruling coalition lost its majority in the upper house of parliament last weekend. This comes amid mounting pressure from US trade policy, further destabilising the yen’s position.
The combination of domestic political instability and external economic pressures has disrupted the yen’s typical role as a safe-haven asset, leaving the currency vulnerable to further fluctuations.
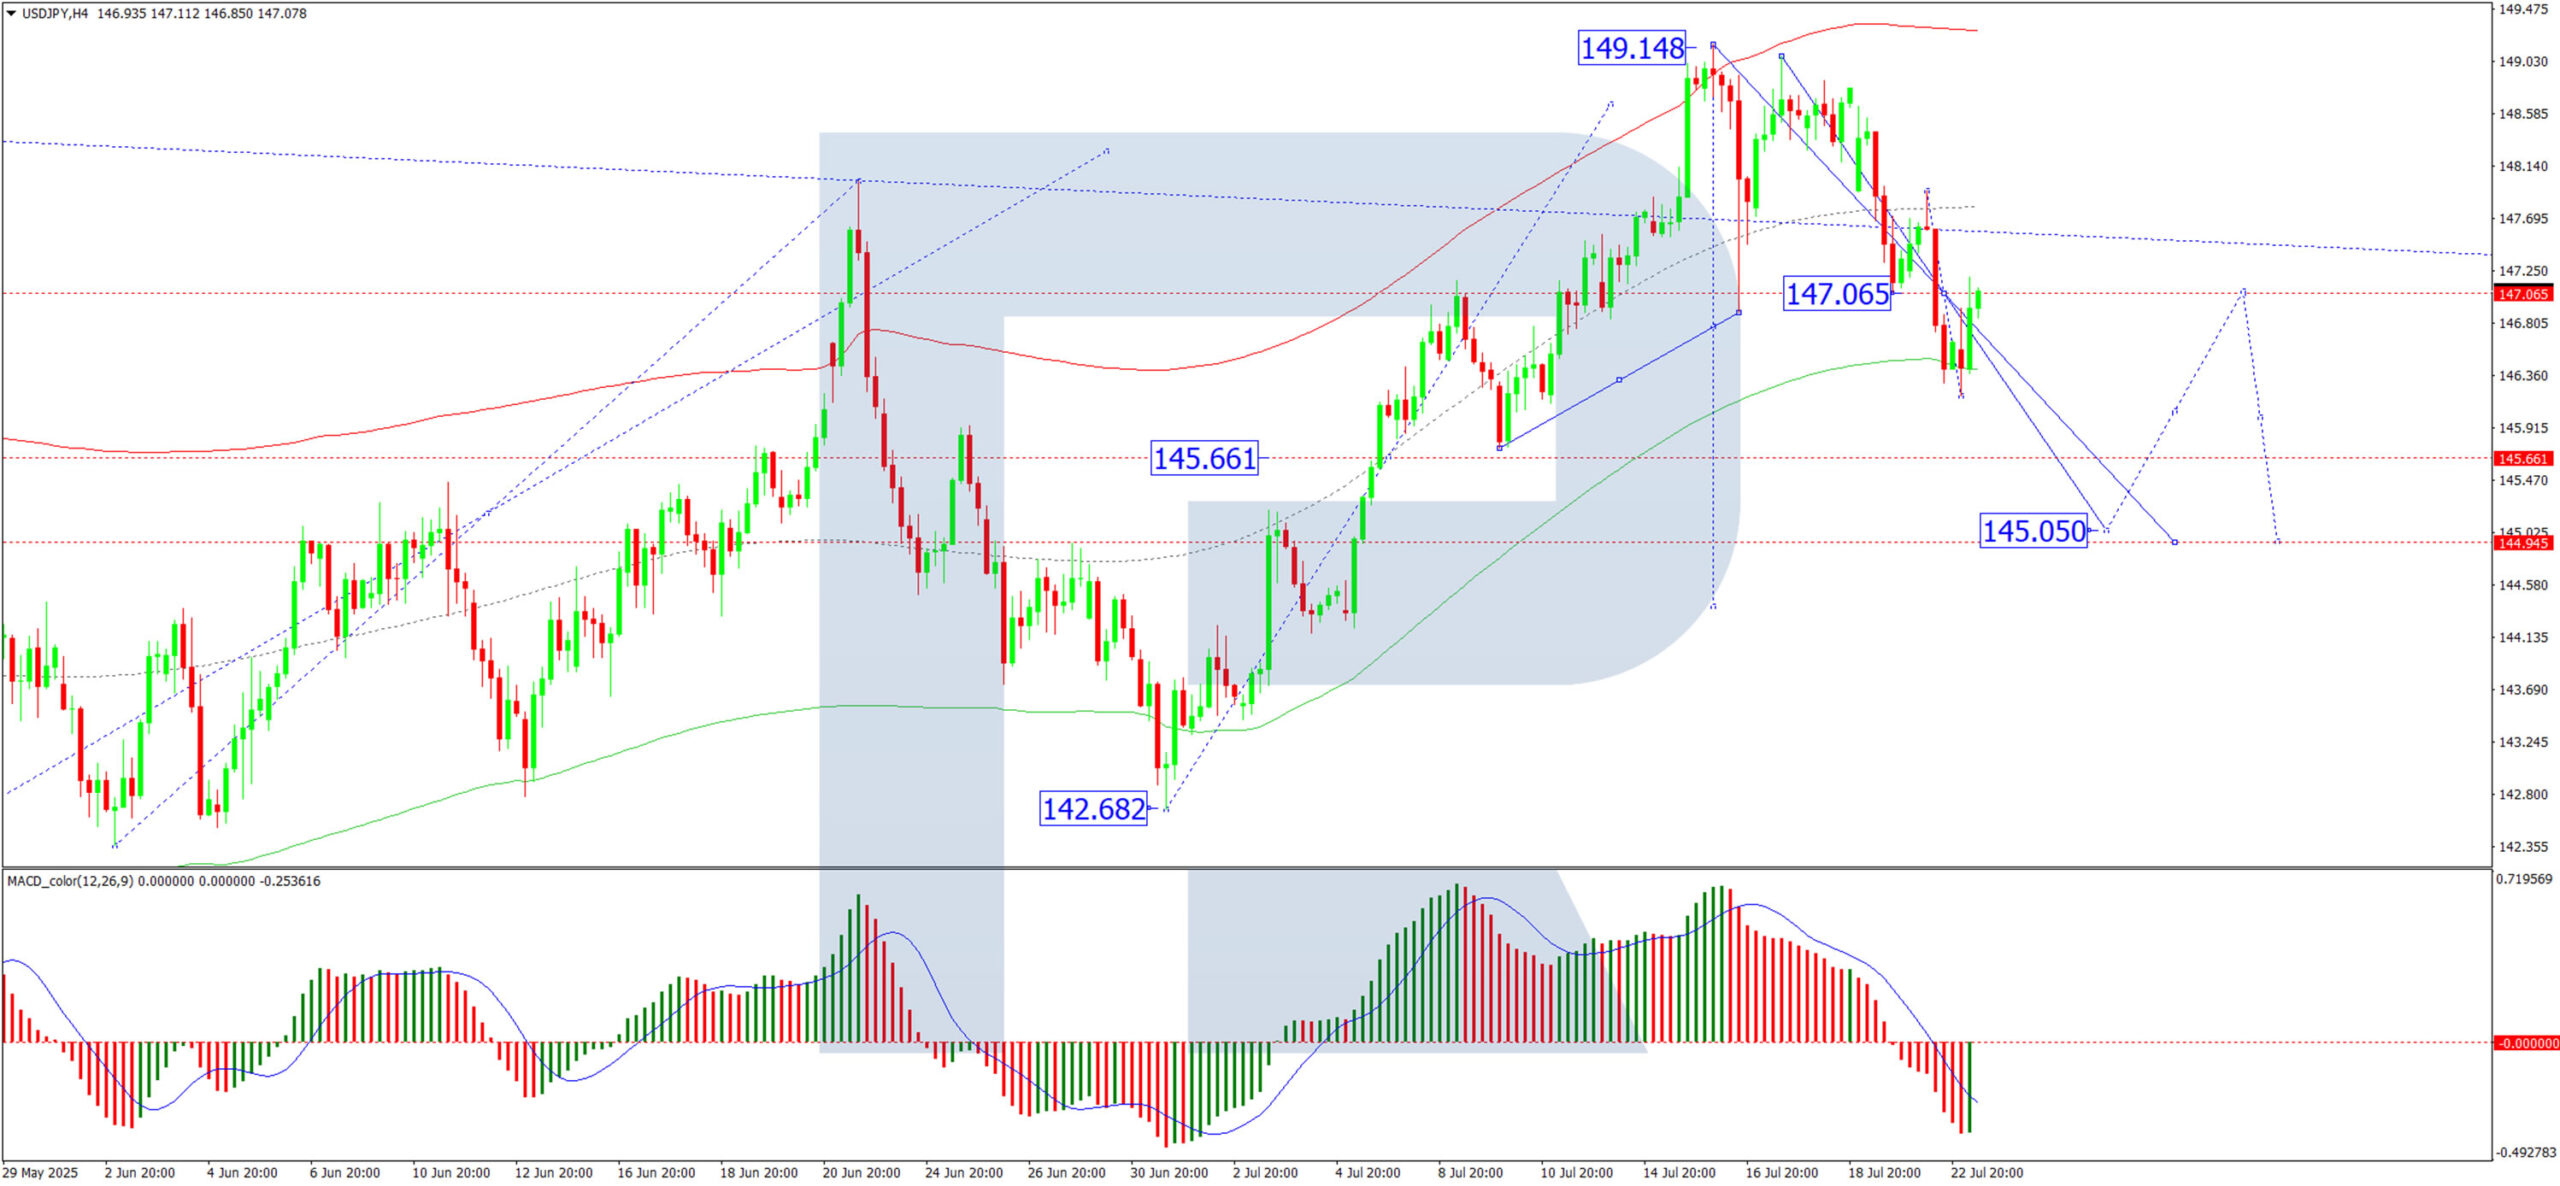
Technical Analysis: USD/JPY
H4 Chart:
On the H4 chart, USD/JPY continues to consolidate around 147.07, with the range now extending downward to 146.20. The pair has retested 147.07 from above today, and we anticipate another potential decline toward 145.05, with a further downside target at 144.60. This bearish scenario is supported by the MACD indicator, where the signal line remains below zero and points firmly downward.
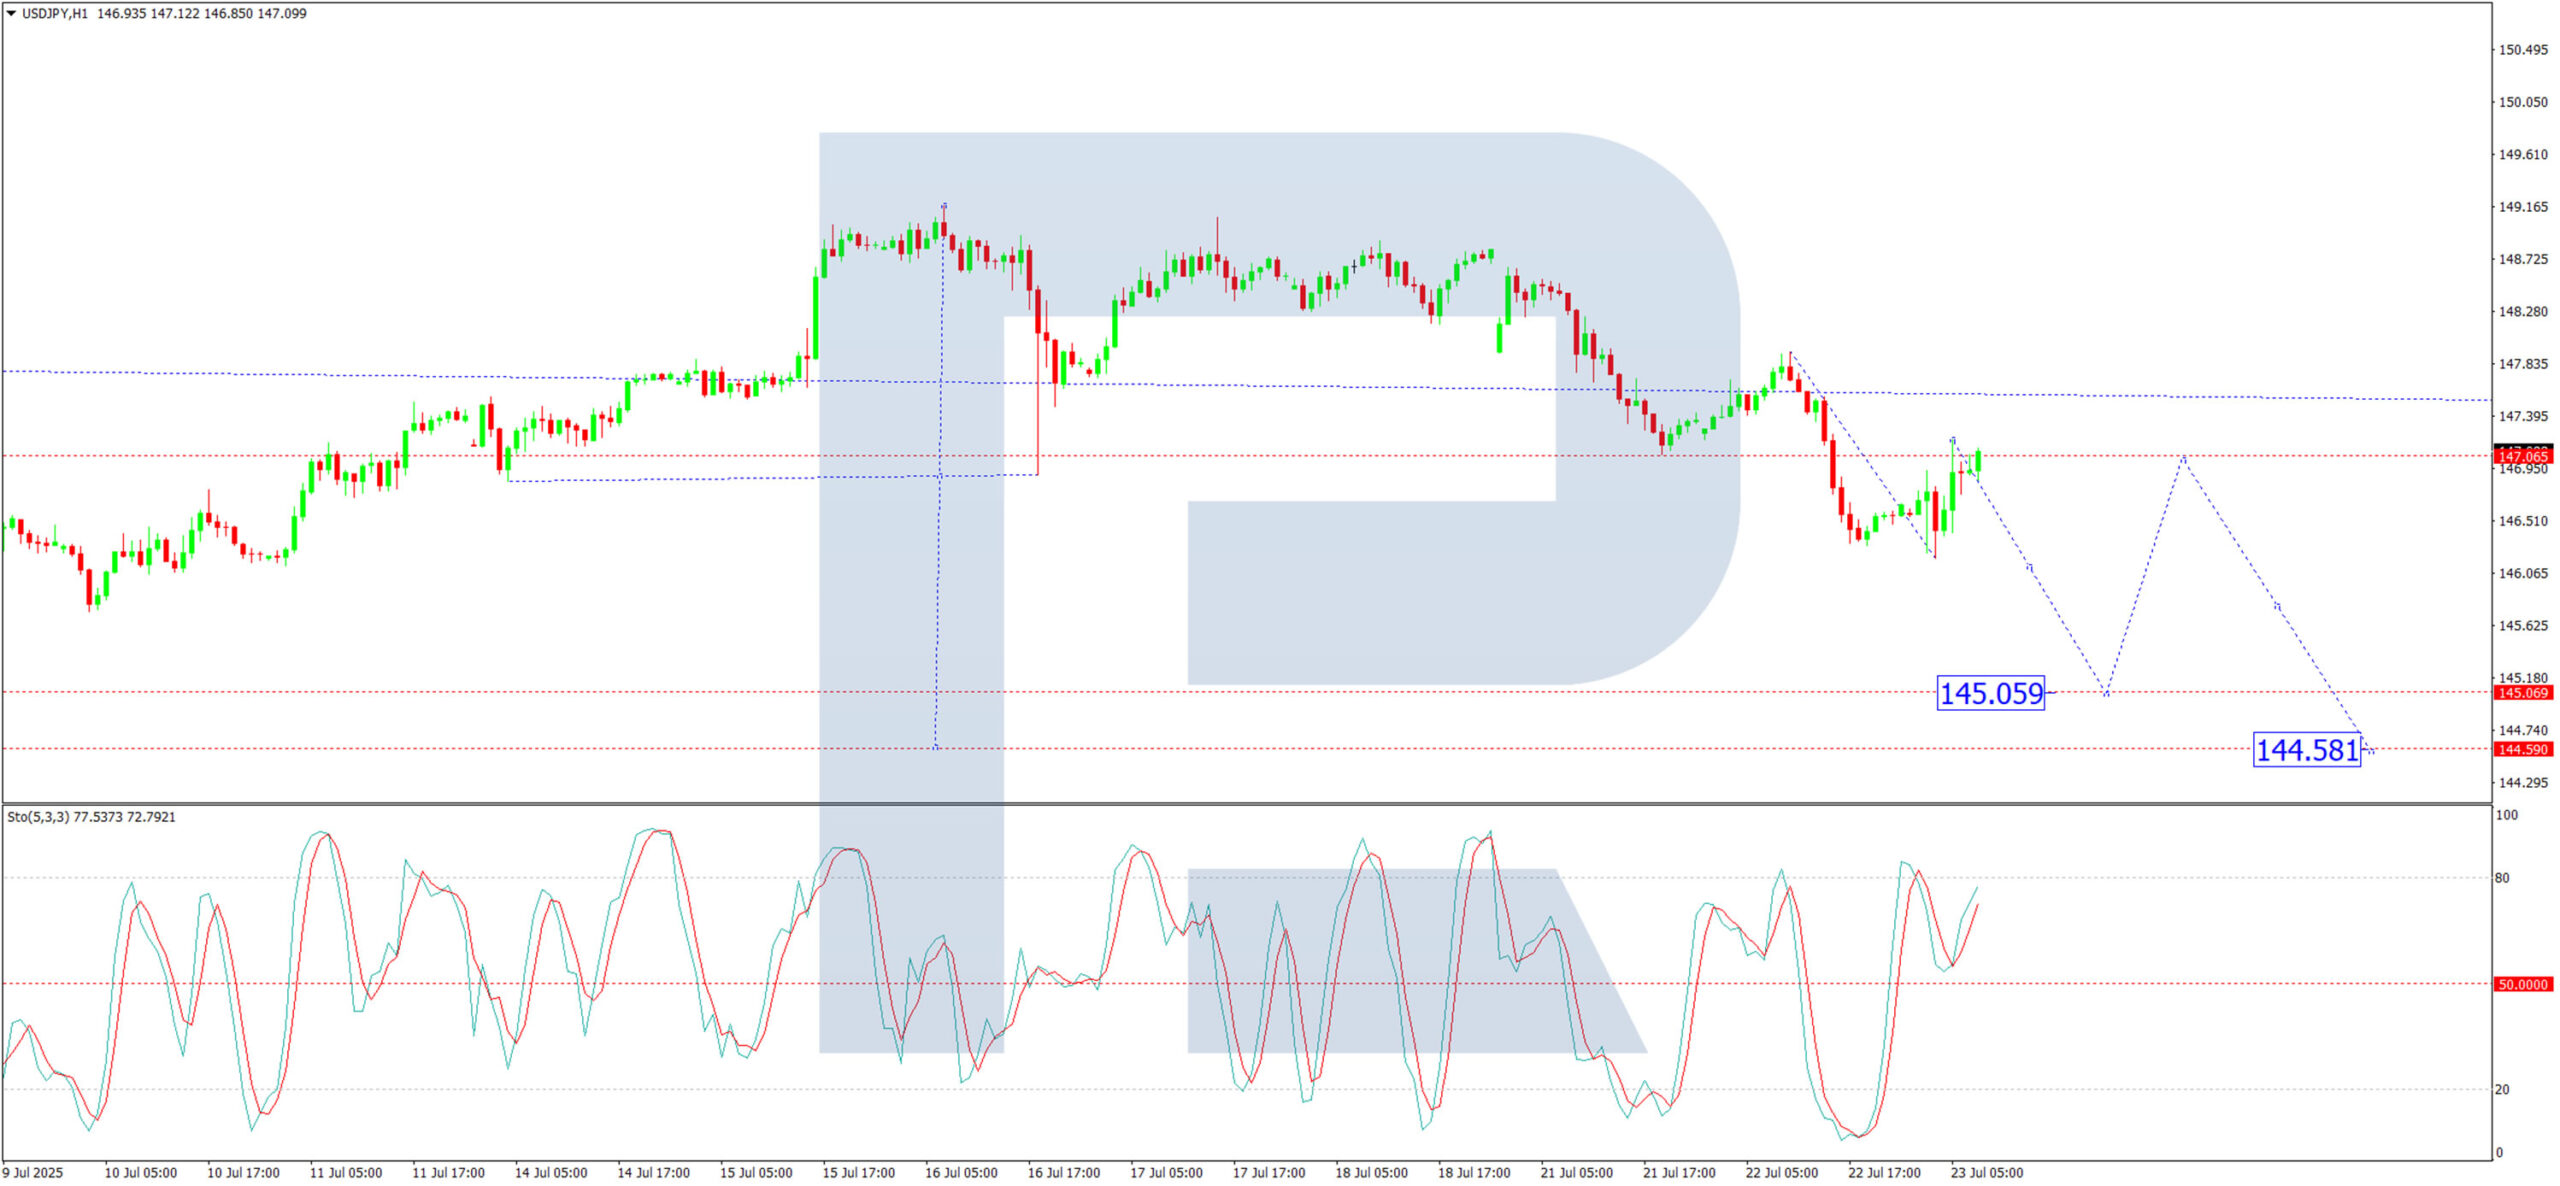
H1 Chart:
On the H1 chart, USD/JPY is forming a consolidation range near 147.07. We expect a possible upward extension to 147.37 before another drop toward 146.30. A downward breakout from this range could open the path for a deeper decline to 145.05. This outlook is reinforced by the Stochastic oscillator, with its signal line below 80 and trending downward.
Conclusion
The USD/JPY pair remains under pressure amid trade-related developments and political uncertainty in Japan. Traders should monitor key support levels (145.05, 144.60) for potential bearish continuation, while any recovery above 147.37 could signal a short-term rebound.
Euro May Extend Gains; Yen Strengthens, but Market Reversal Risks Persist
The foreign exchange market remains under pressure from prevailing uncertainty, although corrective movements in major currency pairs appear to be nearing completion.
EUR/USD
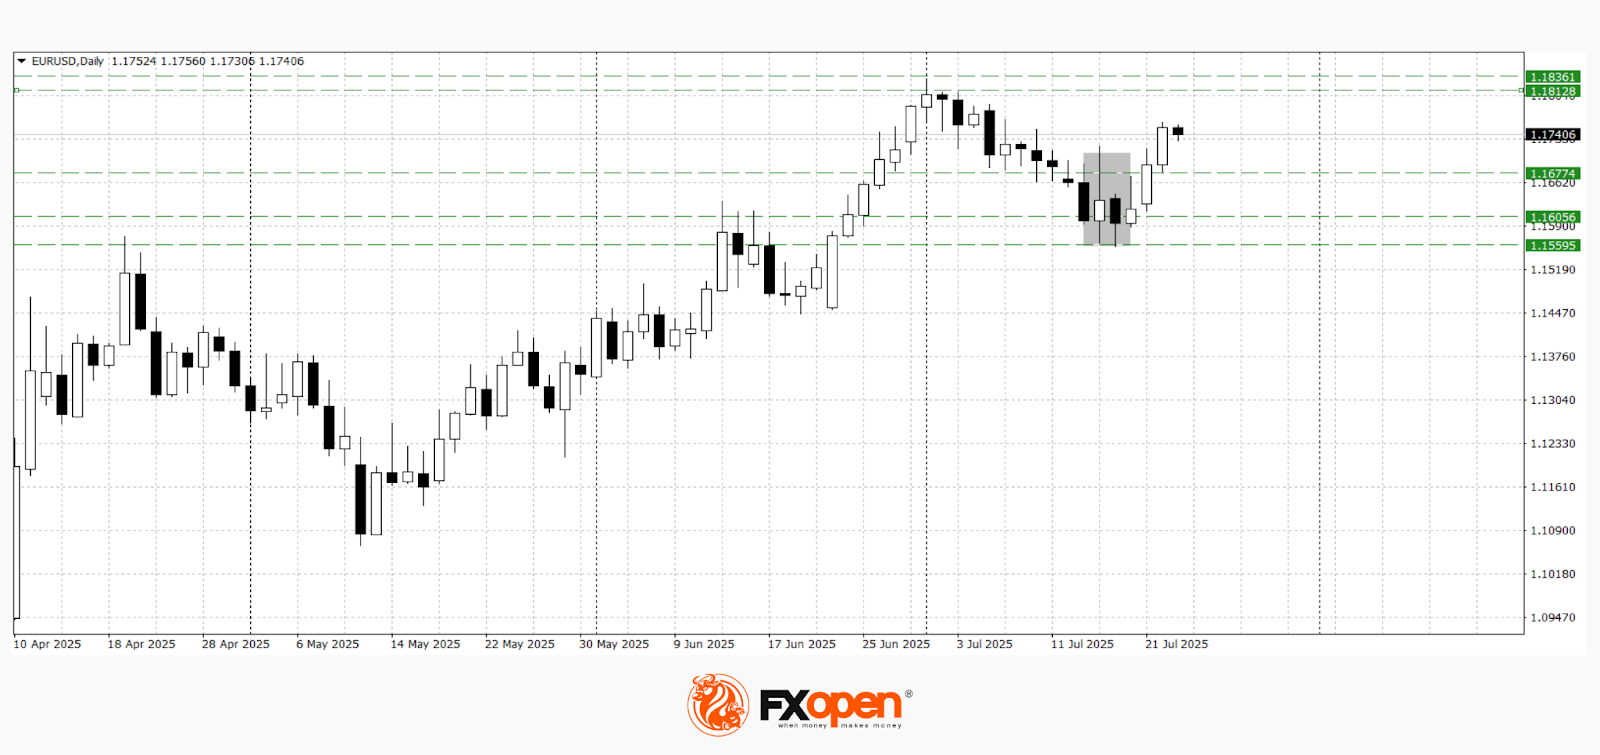
The EUR/USD pair is trading above 1.1700, showing resilience following a pullback from local highs. The pair is supported by falling US Treasury yields and a broadly weaker US dollar. Tomorrow’s releases of Germany and Eurozone Purchasing Managers’ Indices (PMIs), along with the European Central Bank’s interest rate decision, may determine the short-term trajectory and act as a catalyst for a new impulse. Key support remains at 1.1600.
Technical analysis of EUR/USD suggests a potential retest of recent highs around 1.1810, as a Tweezers formation has developed on the daily timeframe following a rebound from the 1.1550–1.1600 area. A firm break below the base of this pattern would invalidate the scenario of renewed upward momentum.
Key events that may influence EUR/USD movement:
- Today at 17:00 (GMT+3): Eurozone Consumer Confidence Index
- Tomorrow at 11:00 (GMT+3): Eurozone Services PMI
- Tomorrow at 15:15 (GMT+3): ECB Interest Rate Decision
USD/JPY
The USD/JPY pair is trading just below 147.00, marking its third consecutive day of decline after failing to consolidate above 149.00. Rising geopolitical tensions and a decline in risk appetite may increase demand for the yen as a safe-haven currency. In addition, investors are still weighing the likelihood of changes in the Federal Reserve’s rhetoric, amid weak US data and rumours of a possible leadership change at the central bank.
The nearest area where the downward momentum could slow lies in the 145.70–146.00 range. A daily close above 147.00 may signal yen weakness and open the way for another test of the 149.00 level.
Key events likely to affect USD/JPY pricing:
- Today at 17:00 (GMT+3): US Existing Home Sales
- Today at 17:30 (GMT+3): US Crude Oil Inventories
- Tomorrow at 15:30 (GMT+3): US Initial Jobless Claims
Trade over 50 forex markets 24 hours a day with FXOpen. Take advantage of low commissions, deep liquidity, and spreads from 0.0 pips. Open your FXOpen account now or learn more about trading forex with FXOpen.
This article represents the opinion of the Companies operating under the FXOpen brand only. It is not to be construed as an offer, solicitation, or recommendation with respect to products and services provided by the Companies operating under the FXOpen brand, nor is it to be considered financial advice.
Asia Stocks Rally on US-Japan Trade Deal; Nikkei Hits 12-Month High, WTI Extends Decline
Optimism over trade deals has strengthened the bullish sentiment across Asia-Pacific stock markets. US President Trump announced a new trade agreement with Japan, featuring a reduced tariff rate of 15% on Japanese imports (down from 25%) and a significant Japanese investment commitment of US$550 billion into the US.
Nikkei 225 surges to 12-month high; Hang Seng climbs on trade truce hopes
Japan’s Nikkei 225 soared 3.7% intraday, aiming for its best single-day gain since 10 April 2025, and touched a 12-month peak at 41,255. Hong Kong’s Hang Seng Index also rose 1% to near a four-year high of 25,405, buoyed by speculation of an extension to the US-China trade truce beyond the 12 August deadline, ahead of next week’s third round of US-China talks in Stockholm.
Singapore STI extends record run; Australia’s ASX 200 rises on energy and materials
Singapore’s Straits Times Index is on pace for its 13th straight all-time closing high, rising 0.4% intraday to 4,226. Meanwhile, Australia’s ASX 200 gained 0.7% to close at 8,737, driven by strength in energy and materials sectors.
US dollar mixed in Asia after two-day slide; risk-on currencies outperform
The US dollar traded mixed during the Asia session following a two-day decline in the Dollar Index, which fell to 97.40, breaching its 20-day moving average of 97.60. Risk-on currencies outperformed: the New Zealand dollar gained 0.2% and the Australian dollar 0.1%, while safe havens like the Japanese yen and Swiss franc each slipped 0.2% against the greenback.
BoJ Uchida's dovish remarks triggered yen weakness post-trade deal
The yen’s softness was reinforced by dovish comments from BoJ Deputy Governor Uchida, who signalled no urgency to raise interest rates, even after the US-Japan trade announcement, dampening the currency’s appeal in a risk-on environment.
Gold pulls back from 5-week high amid optimism and overbought signals
Gold (XAU/USD) dipped -0.2% after reaching a five-week high of US$3,431, pressured by improved risk sentiment and overbought momentum indicators. Despite the pullback, the yellow metal maintains its short-term bullish structure with key support at US$3,385/3,360.
Crude oil extends losses despite risk-on tone; key support in focus
WTI crude oil failed to mirror the equity market’s optimism, sliding -0.3% intraday to US$66.30, marking its fourth consecutive daily decline. Prices are now nearing critical range support at US$65.20, in place since 24 June, suggesting the potential for a bearish breakdown.
Economic data releases
Fig 1: Key data for today’s Asia mid-session (Source: MarketPulse)
Chart of the day – WTI crude at risk of bearish breakdown from 4-week range
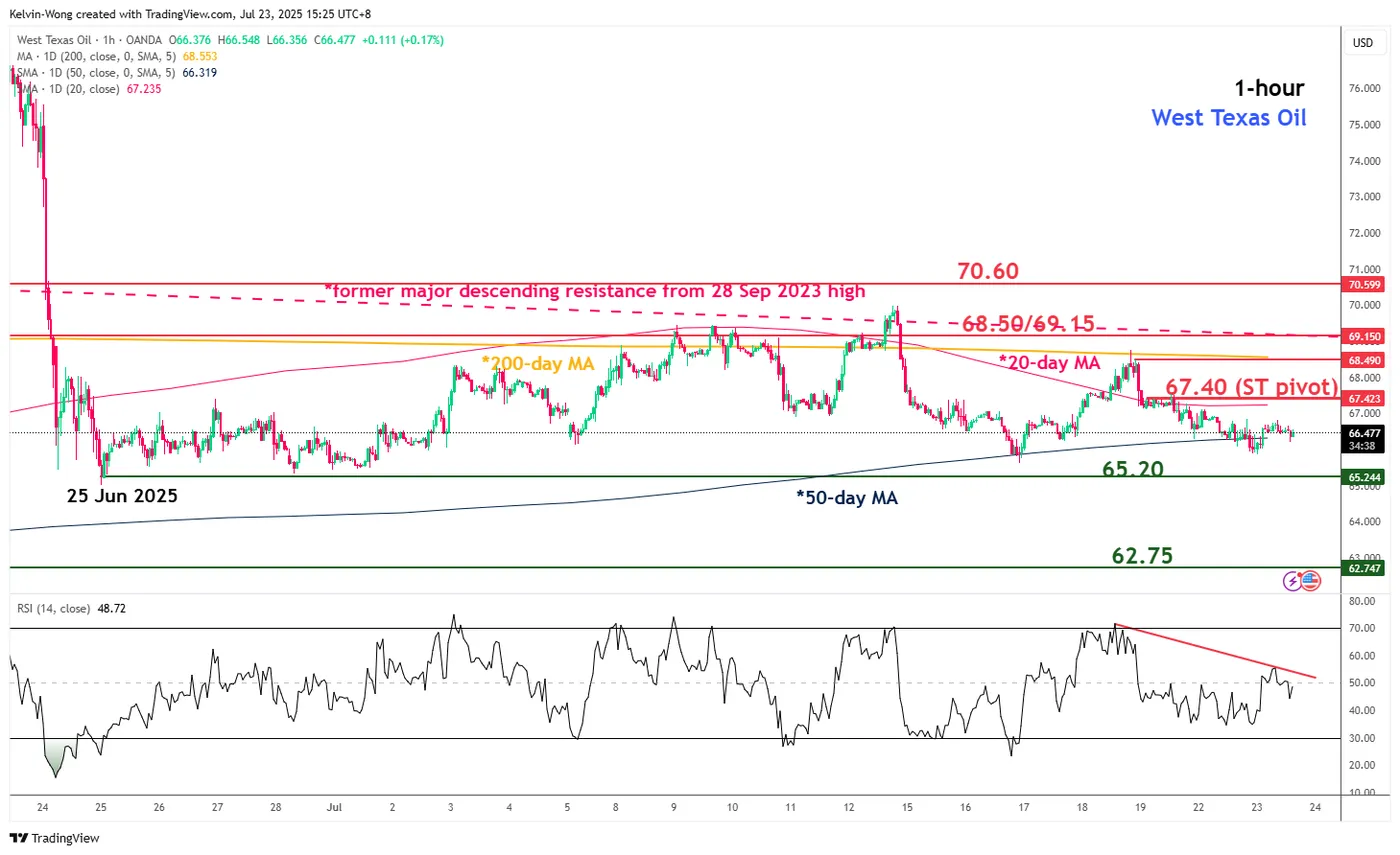
Fig 2: WTI crude minor trend as of 23 July 2025 (Source: TradingView)
After the horrendous plunge of -17% seen in two days from 23 June to 25 June, the West Texas crude has been trading within a sideways range configuration. Several technical elements now suggest a potential bearish breakdown from the 4-week range.
The price actions of West Texas crude oil have traded below its 20-day moving average for the fourth consecutive session after a bearish reaction from its key 200-day moving average on last Friday, 18 July.
In addition, the hourly RSI momentum indicator has been capped below by a parallel descending trendline resistance in place since 18 July, which indicates the lack of bullish momentum.
Watch the US$67.40 key short-term pivotal resistance (also the 20-day moving average). A break below the range support of US$65.20 triggers the bearish breakdown to expose the next intermediate support at US$62.75 (see Fig 2).
On the other hand, a clearance above US$67.40 negates the bearish tone to retest the range resistance at US$68.50/69.15 (also the 200-day moving average).
AUD/USD & NZD/USD Climb as Dollar Weakens
AUD/USD started a decent increase above the 0.6520 level. NZD/USD is also rising and might aim for more gains above 0.6000.
Important Takeaways for AUD/USD and NZD/USD Analysis Today
- The Aussie Dollar rebounded after forming a base above the 0.6450 level against the US Dollar.
- There is a connecting bullish trend line forming with support at 0.6540 on the hourly chart of AUD/USD at FXOpen.
- NZD/USD is consolidating gains above the 0.5980 zone.
- There was a break above a major bearish trend line with resistance at 0.5980 on the hourly chart of NZD/USD at FXOpen.
AUD/USD Technical Analysis
On the hourly chart of AUD/USD at FXOpen, the pair started a fresh increase from the 0.6450 support. The Aussie Dollar was able to clear the 0.6500 resistance to move into a positive zone against the US Dollar.
There was a close above the 0.6550 resistance and the 50-hour simple moving average. Finally, the pair tested the 0.6565 zone. A high was formed near 0.6564 and the pair recently started a consolidation phase.
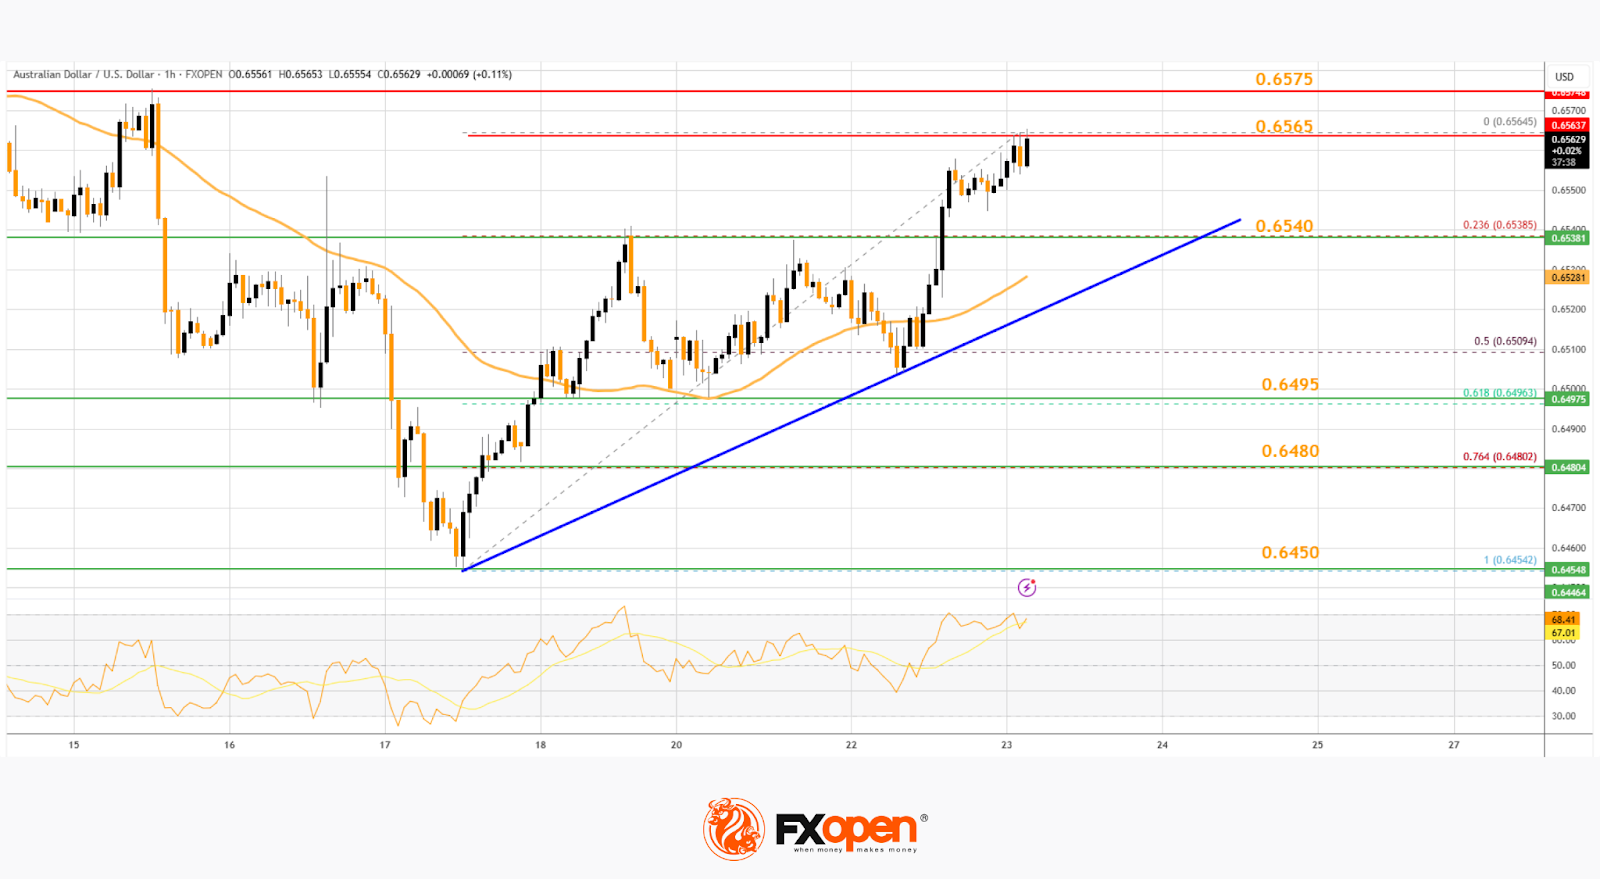
On the downside, initial support is near the 0.6540 level. There is also a connecting bullish trend line forming with support at 0.6540. It is close to the 23.6% Fib retracement level of the upward move from the 0.6454 swing low to the 0.6564 high.
The next major support is near the 0.6495 zone. If there is a downside break below it, the pair could extend its decline toward the 0.6480 level. It is close to the 76.4% Fib retracement level.
Any more losses might signal a move toward 0.6450. On the upside, the AUD/USD chart indicates that the pair is now facing resistance near 0.6565. The first major resistance might be 0.6575. An upside break above the 0.6575 resistance might send the pair further higher.
The next major resistance is near the 0.6600 level. Any more gains could clear the path for a move toward the 0.6650 resistance zone.
NZD/USD Technical Analysis
On the hourly chart of NZD/USD at FXOpen, the pair started a steady increase from the 0.5910 zone. The New Zealand Dollar broke the 0.5940 resistance to start the recent increase against the US Dollar.
There was a break above a major bearish trend line with resistance at 0.5980. The pair settled above 0.5980 and the 50-hour simple moving average. It tested the 0.6010 zone and is currently consolidating gains.
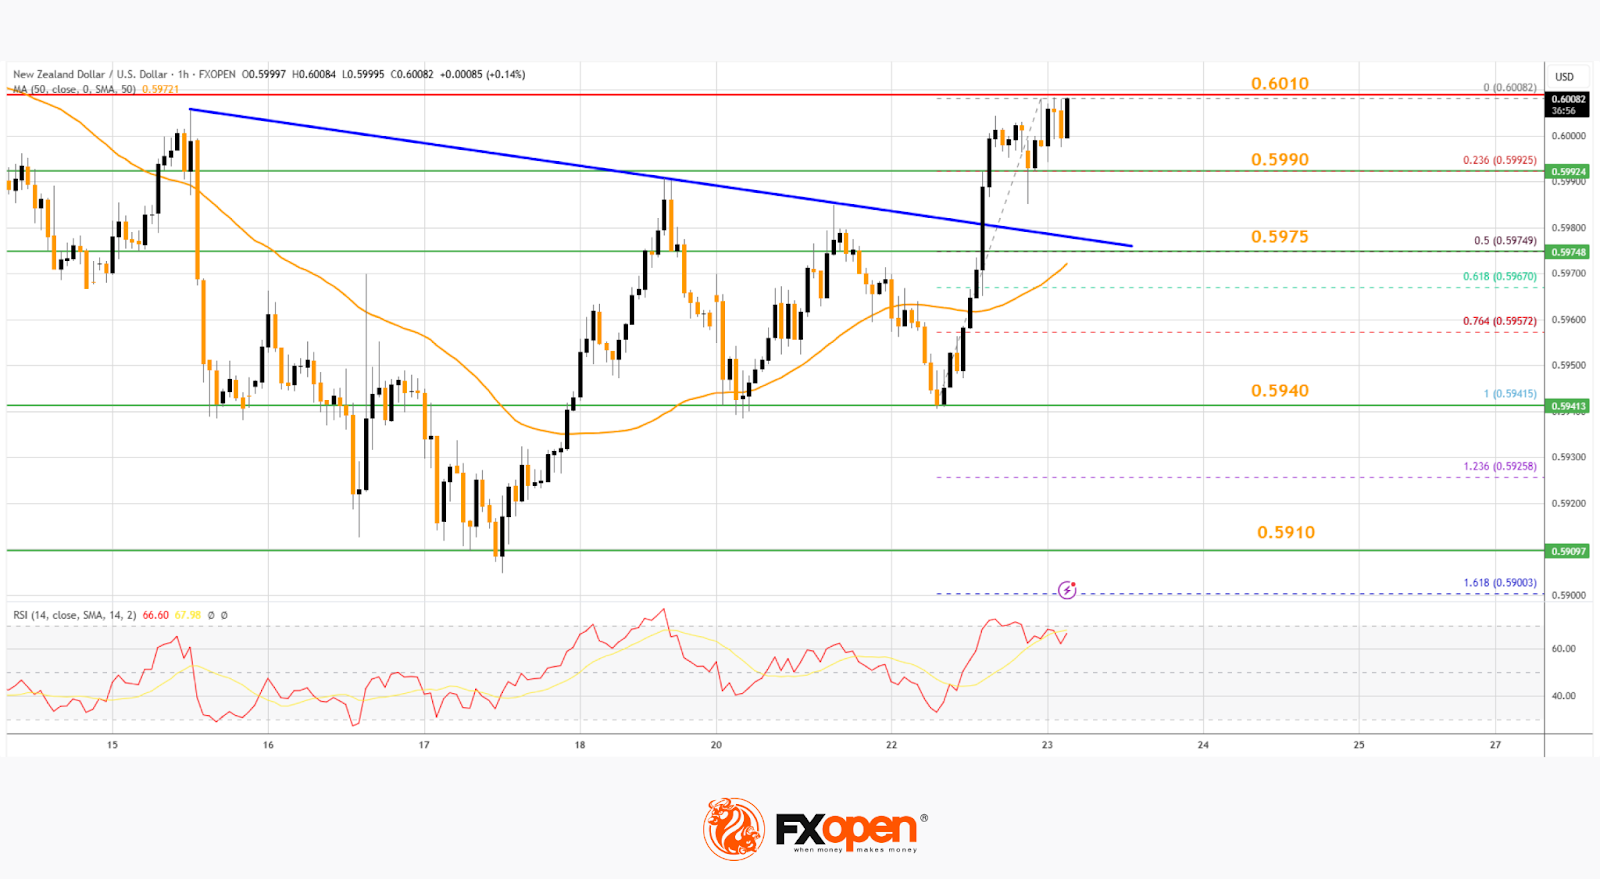
The NZD/USD chart suggests that the RSI is stable above 60. On the upside, the pair might struggle near 0.6010. The next major resistance is near the 0.6020 level.
A clear move above the 0.6020 level might even push the pair toward the 0.6050 level. Any more gains might clear the path for a move toward the 0.6120 resistance zone in the coming days.
On the downside, immediate support is near the 0.5990 level. It is close to the 23.6% Fib retracement level of the upward move from the 0.5941 swing low to the 0.6008 high.
The first key support is near the 0.5975 level. It is close to the 50% Fib retracement level. The next major support is near the 0.5940 level. If there is a downside break below the 0.5940 support, the pair might slide toward 0.5910. Any more losses could lead NZD/USD in a bearish zone to 0.5850.
Trade over 50 forex markets 24 hours a day with FXOpen. Take advantage of low commissions, deep liquidity, and spreads from 0.0 pips. Open your FXOpen account now or learn more about trading forex with FXOpen.
This article represents the opinion of the Companies operating under the FXOpen brand only. It is not to be construed as an offer, solicitation, or recommendation with respect to products and services provided by the Companies operating under the FXOpen brand, nor is it to be considered financial advice.
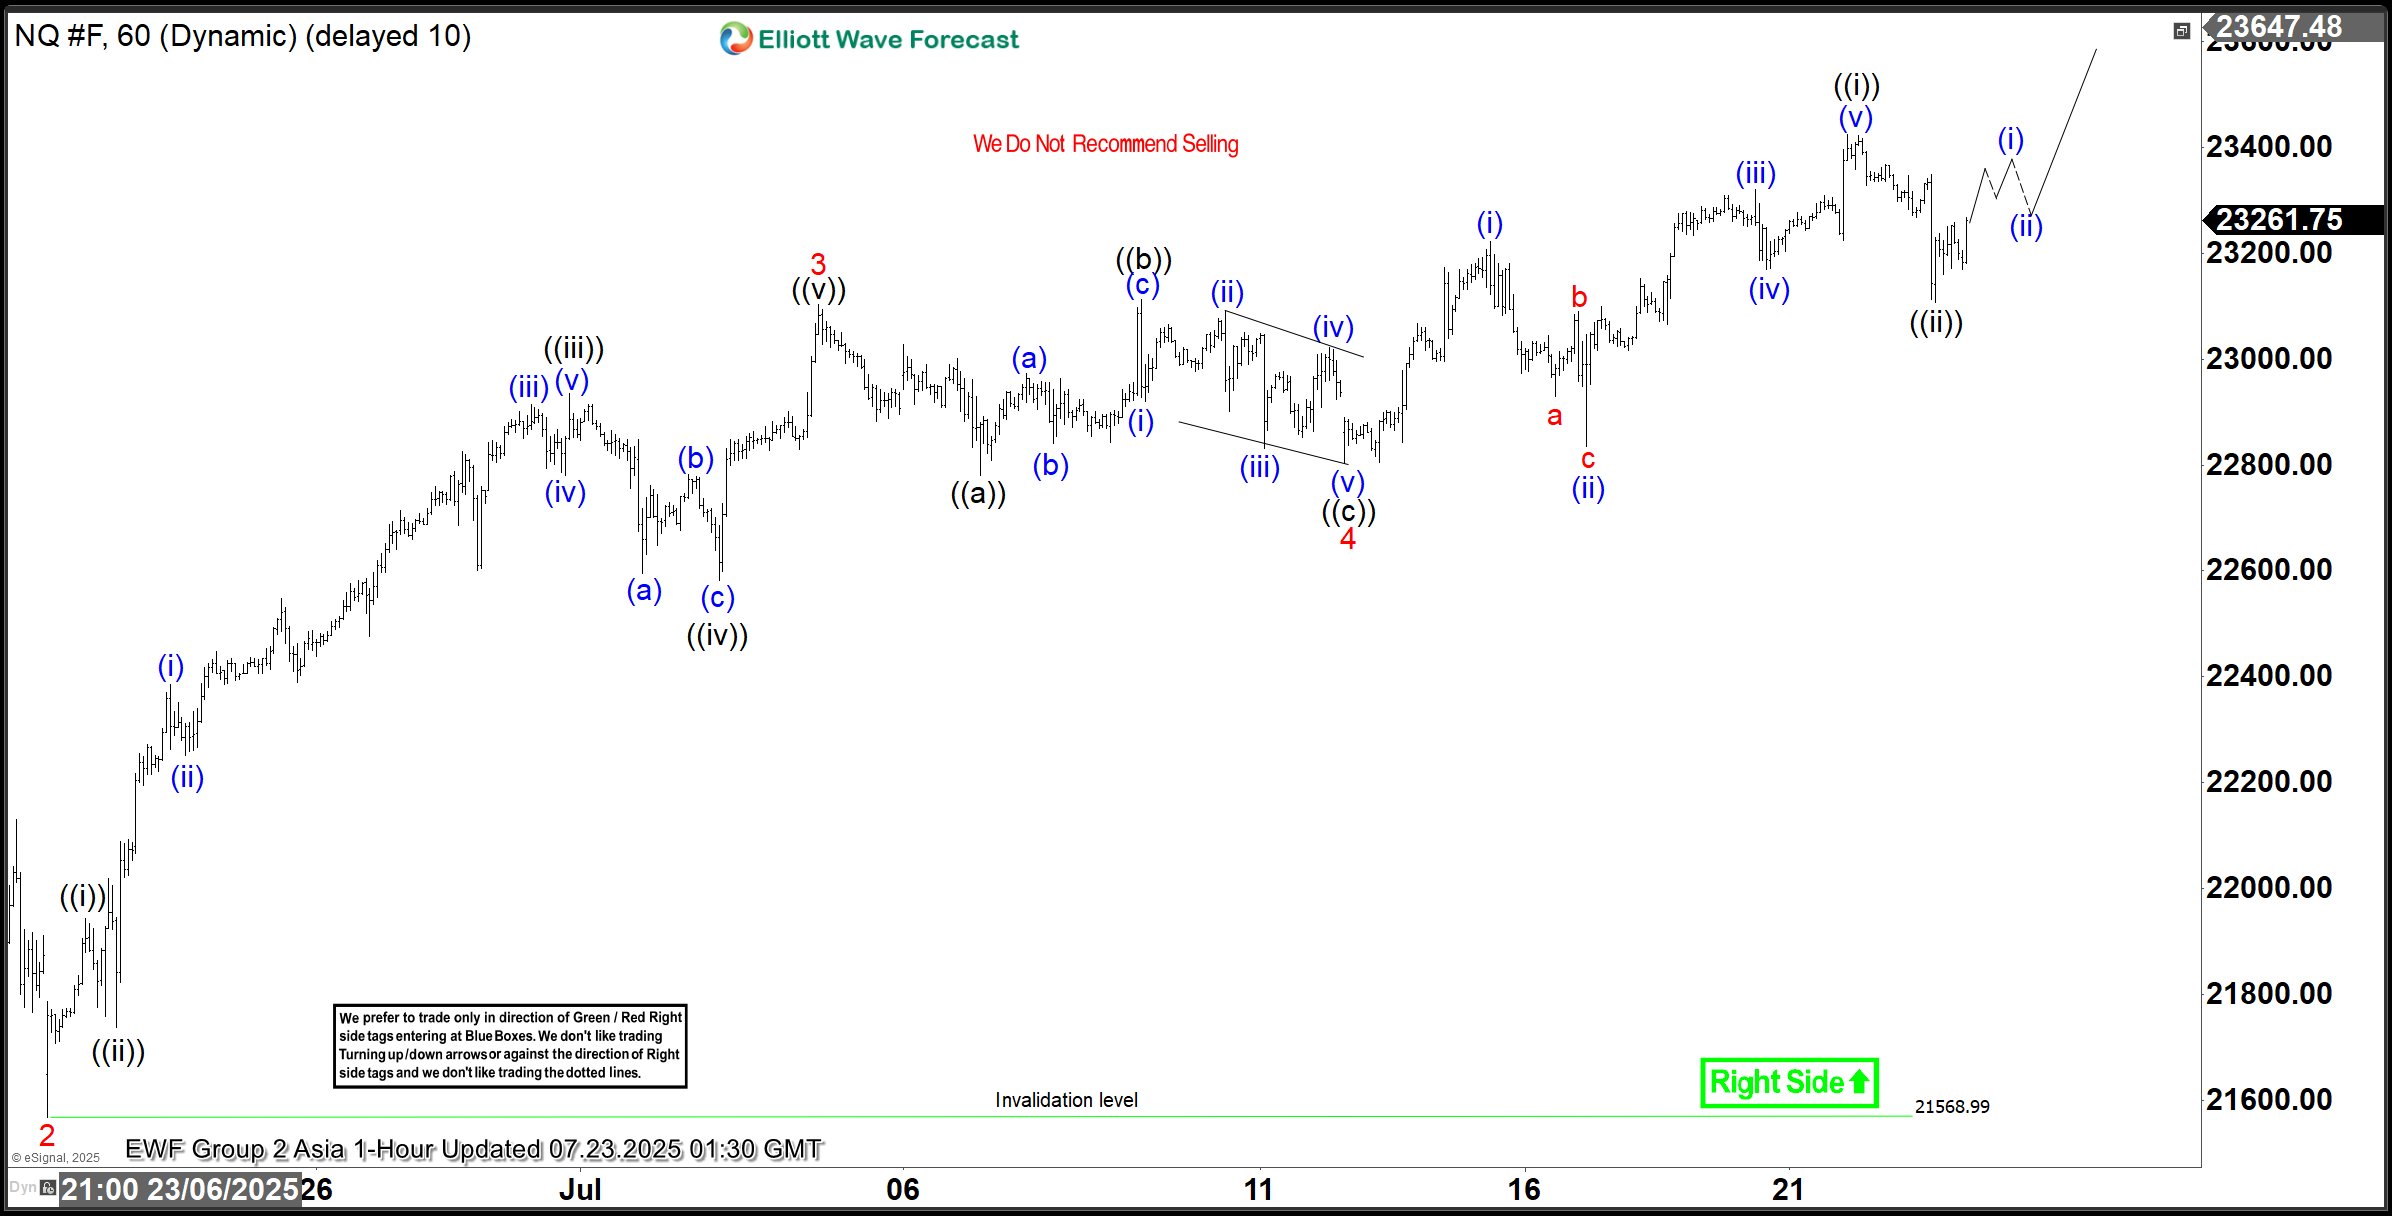
Elliott Wave View: Nasdaq Futures (NQ_F) Poised To Extend Higher
The Nasdaq Futures (NQ_F) favors higher in bullish impulse sequence from April-2025 low. It already broke above December-2024 high & expect short term pullback in 3, 7 or 11 swings to remain supported. Impulse sequence unfolds in 5, 9, 13, 17, 21….. swings count. It ended daily corrective pullback in double correction at 16460 low of 4.07.2025 low. On daily, it should rally extend in to 28864 – 26152 area to finish April cycle before next pullback start. Above there, it favors rally in (3) of ((1)). It placed (1) of ((1)) at 21858.75 high, (2) at 21071.50 low as shallow connector & favoring upside in 5 of (3) against 7.13.2025 low. Every pullback after 4.21.2025 low was shallow & unfolded in 3, 7 or 11 swings calling for more upside as long as it stays above 5.30.2025 low. Within (3), it ended 1 at 22222 high, 2 at 21566.75 low, 3 at 23102.50 high, 4 at 22803 low & favors upside in 5 of (3). Wave 4 as flat correction ended in 7.13.2025 low of 22803 low.
Below 3 of (3) high, it placed ((a)) at 22779.75 low, ((b)) at 23112 high & ((c)) at 22803 low as flat connector against 6.22.2025 low. Above there, it ended ((i)) at 23424.75 high as diagonal & ((ii)) at 23108 low in 3 swing pullback. Above there, it should continue rally in ((iii)) of 5, which will confirm above 23424.75 high to avoid double correction. Within ((i)), it placed (i) at 23222.75 high, (ii) at 22835.5 low, (iii) at 23320.75 high, (iv) at 23169.50 low & (v) at 23424.75 high. Currently, it favors two more highs in 5 of (3) in to 23493.5 – 23934.5 area, above 7.13.2025 low. Based on swing sequence, it already have enough number of swings in (3) to call the cycle completed. But as long as it stays above price trendline, passing through 2 & 4, it should continue upside in to extreme area. We like to buy the next pullback in 3, 7 or 11 swings at extreme area for intraday rally. It favors upside in April-2025 cycle & expected to remain supported in (4) & later in ((2)) pullback as next buying opportunity.
Nasdaq Futures (NQ_F) – 60-Minute Elliott Wave Technical Chart:
Nasdaq Futures (NQ_F) Elliott Wave Technical Video:
https://www.youtube.com/watch?v=Yf6Fe_9tLNc
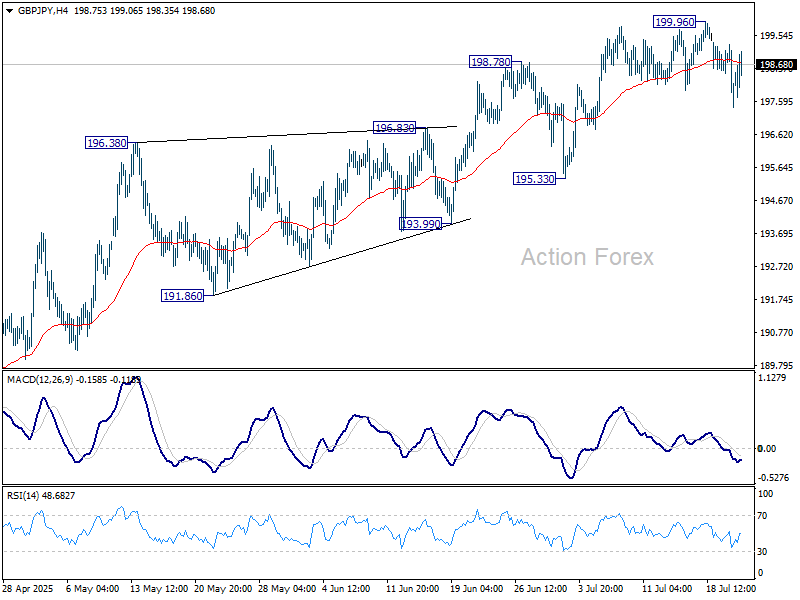
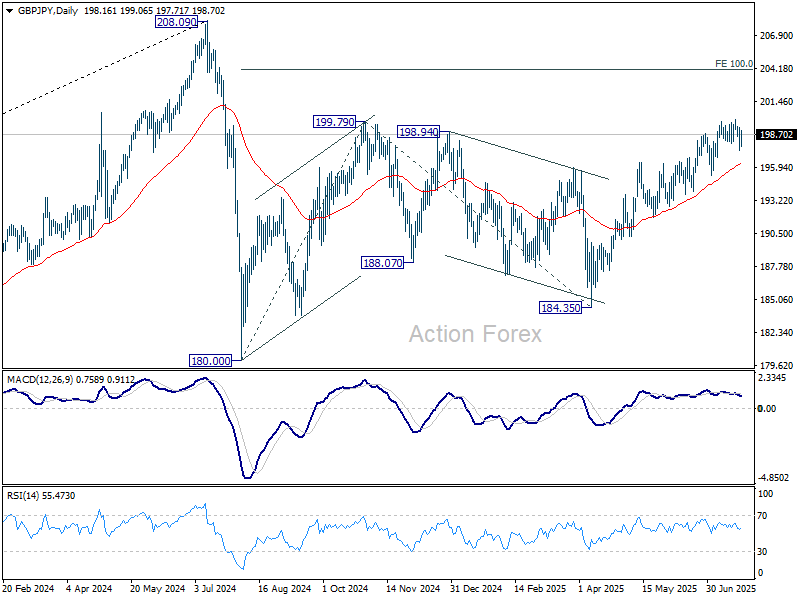
GBP/JPY Daily Outlook
Daily Pivots: (S1) 197.51; (P) 198.40; (R1) 199.36; More...
GBP/JPY is staying in consolidations below 199.96 and intraday bias remains neutral. While deeper pullback cannot be ruled out, further rally will remain in favor as long as 195.33 support holds. Above 199.96 will resume the rise from 184.35 to 100% projection of 180.00 to 199.79 from 184.35 at 204.14.
In the bigger picture, price actions from 208.09 (2024 high) are seen as a correction to rally from 123.94 (2020 low). The pattern might still extend with another falling leg. But in that case, strong support should be seen from 38.2% retracement of 123.94 to 208.09 at 175.94 to contain downside. Meanwhile, decisive break of 208.09 will confirm long term up trend resumption.
EUR/JPY Daily Outlook
Daily Pivots: (S1) 171.52; (P) 172.23; (R1) 173.09; More...
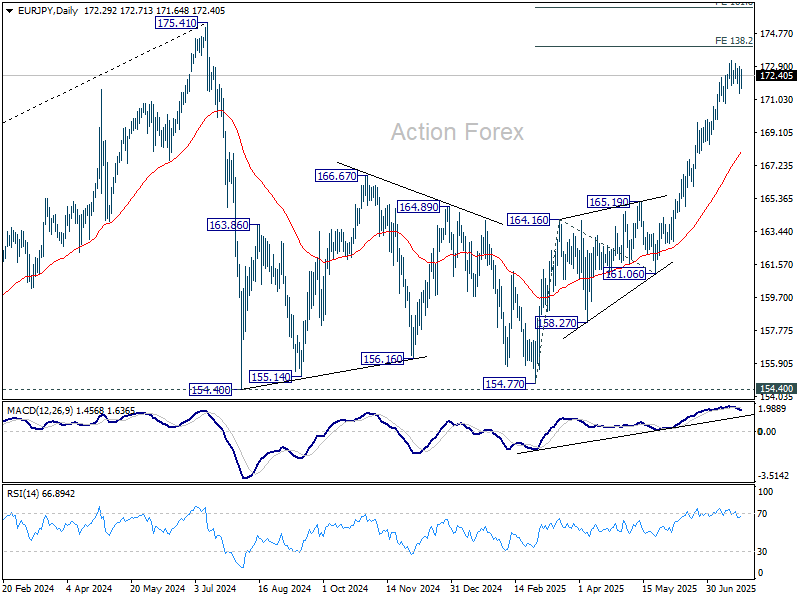
EUR/JPY is staying in consolidations below 173.21 and intraday bias remains neutral for the moment. With 170.78 support intact, further rally is expected. On the upside, break of 173.21 will target 138.2% projection of 154.77 to 164.16 from 161.06 at 174.03. Break there will bring retest of 175.41 high. Nevertheless, considering bearish divergence condition in 4H MACD, break of 170.78 will indicate short term topping, and turn bias to the downside for deeper pullback.
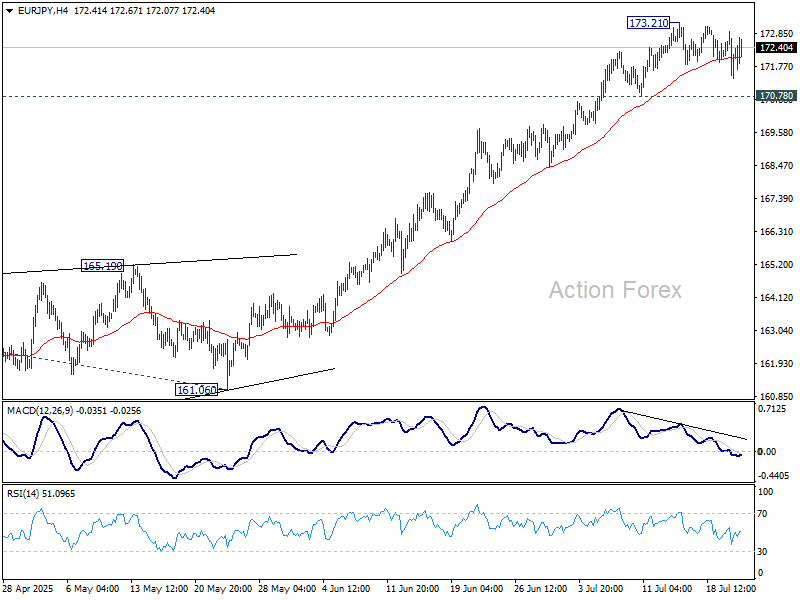
In the bigger picture, price actions from 175.41 (2024 high) are seen as correction to up trend from 114.42 (2020 low). The pattern might still extend with another falling leg. But in that case, strong support should be seen from 38.2% retracement of 114.42 to 175.41 at 152.11 to contain downside. Meanwhile, decisive break of 175.41 will confirm long term up trend resumption.
EUR/GBP Daily Outlook
Daily Pivots: (S1) 0.8667; (P) 0.8681; (R1) 0.8698; More...
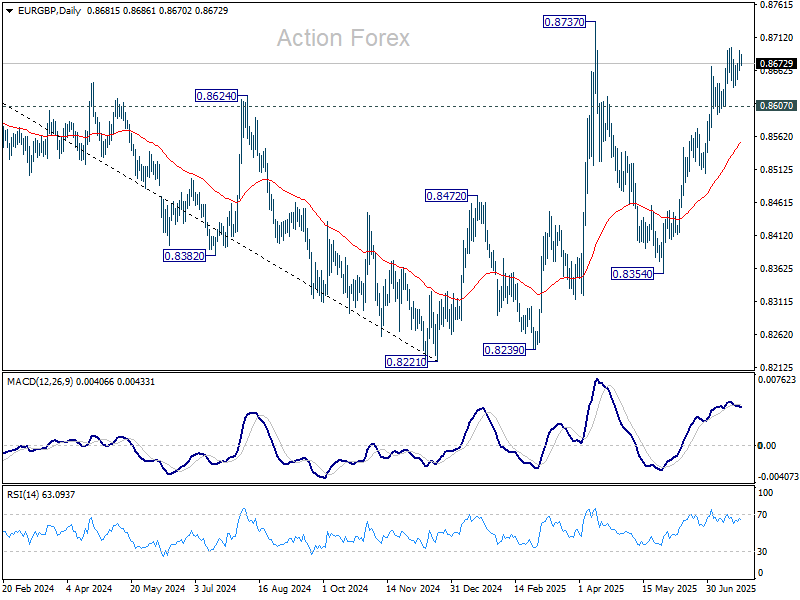
EUR/GBP is staying in consolidations below 0.8696 and intraday bias remains neutral. Further rally is expected with 0.8607 support intact. On the upside, above 0.8696 will bring retest of 0.8737 high. However, firm break of 0.8607 will confirm short term topping, on bearish divergence condition in 4H MACD. Deeper fall should be seen back to 55 D EMA (now at 0.8555).
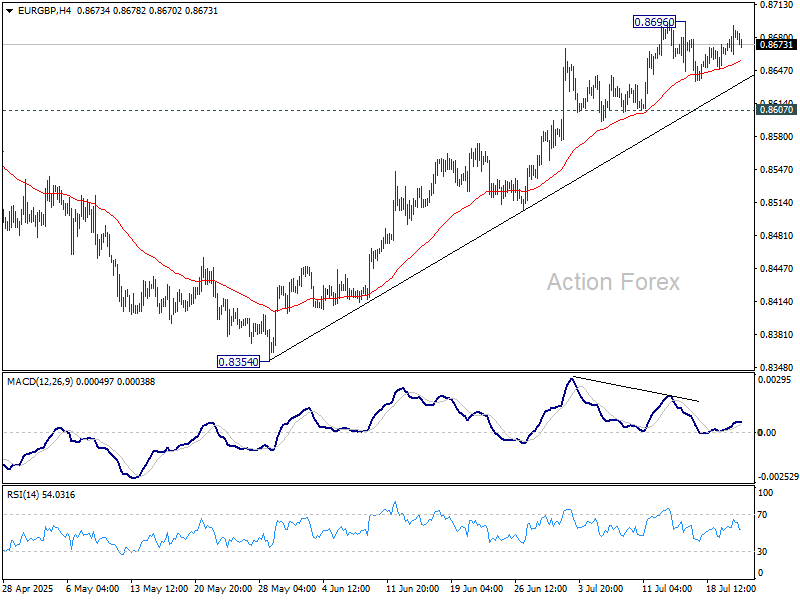
In the bigger picture, the structure from 0.8221 medium term bottom are not impulsive enough to suggest that it's reversing the down trend from 0.9267 (2022 high). But even if it's a correction, firm break of 0.8737 will still pave the way to 61.8% retracement of 0.9267 to 0.8221 at 0.8867. For now, further rise will remain in favor as long as 55 W EMA (now at 0.8474) holds.
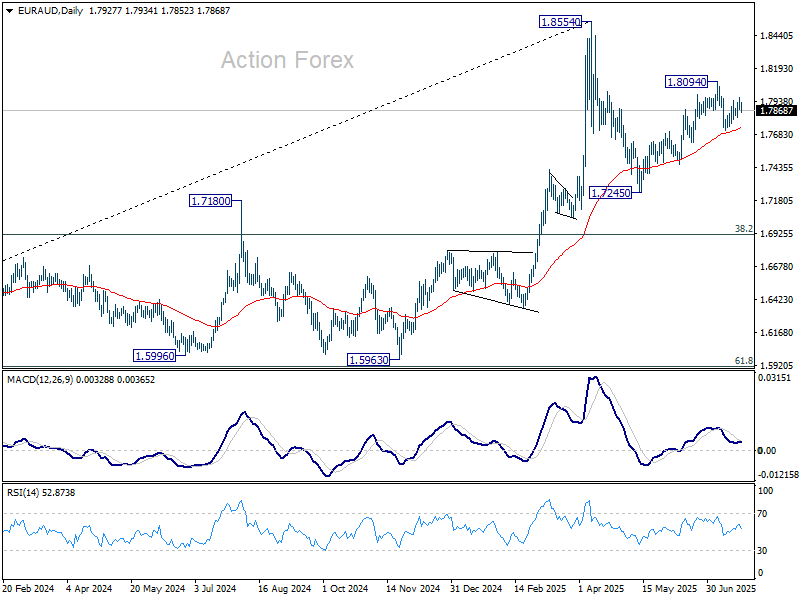
EUR/AUD Daily Outlook
Daily Pivots: (S1) 1.7882; (P) 1.7929; (R1) 1.7977; More...
Intraday bias in EUR/AUD remains neutral at this point. On the upside, break of 1.8094 will resume the choppy rise from 1.7245 towards 1.8554 high. However, break of 1.7717 support will revive the case that rise from 1.7245 has completed, and turn bias back to the downside for 1.7459 support instead.
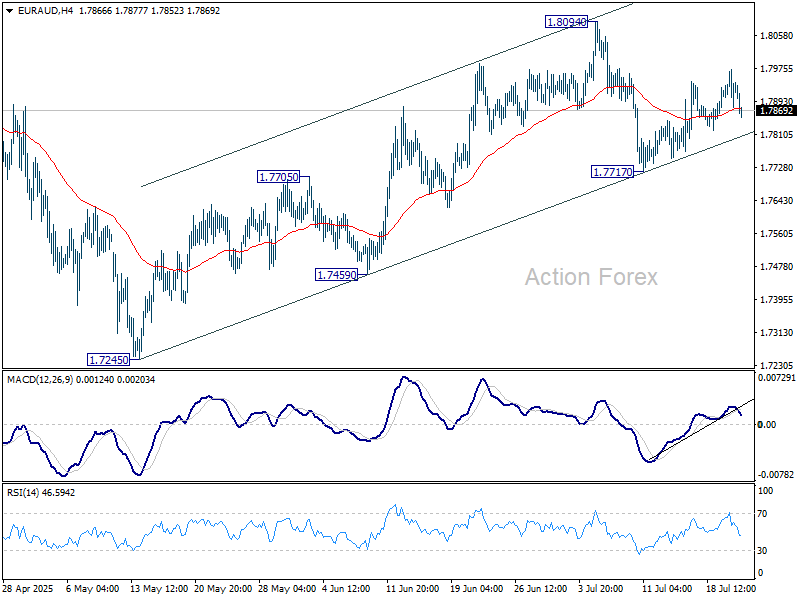
In the bigger picture, price actions from 1.8554 medium term top are seen as a corrective pattern. While deeper pullback might be seen, downside should be contained by 38.2% retracement of 1.4281 (2022 low) to 1.8554 at 1.6922 to bring rebound. Up trend from 1.4281 is expected to resume at a later stage.