Sample Category Title
GBP/USD Faces Resistance—Upside May Be Exhausted
Key Highlights
- GBP/USD declined below 1.3550 and tested the 1.3365 zone.
- It now faces hurdles near the 1.3520 and 1.3550 levels on the 4-hour chart.
- EUR/USD attempted a fresh increase and might gain pace if it clears 1.1750.
- USD/JPY started a fresh decline below the 148.00 level.
GBP/USD Technical Analysis
The British Pound gained bearish pace below the 1.3620 support against the US Dollar. GBP/USD tested the 1.3365 zone before it started a recovery wave.
Looking at the 4-hour chart, the pair settled below the 1.3550 zone, the 100 simple moving average (red, 4-hour), and the 200 simple moving average (green, 4-hour). The pair recently corrected some losses and traded above the 1.3420 level.
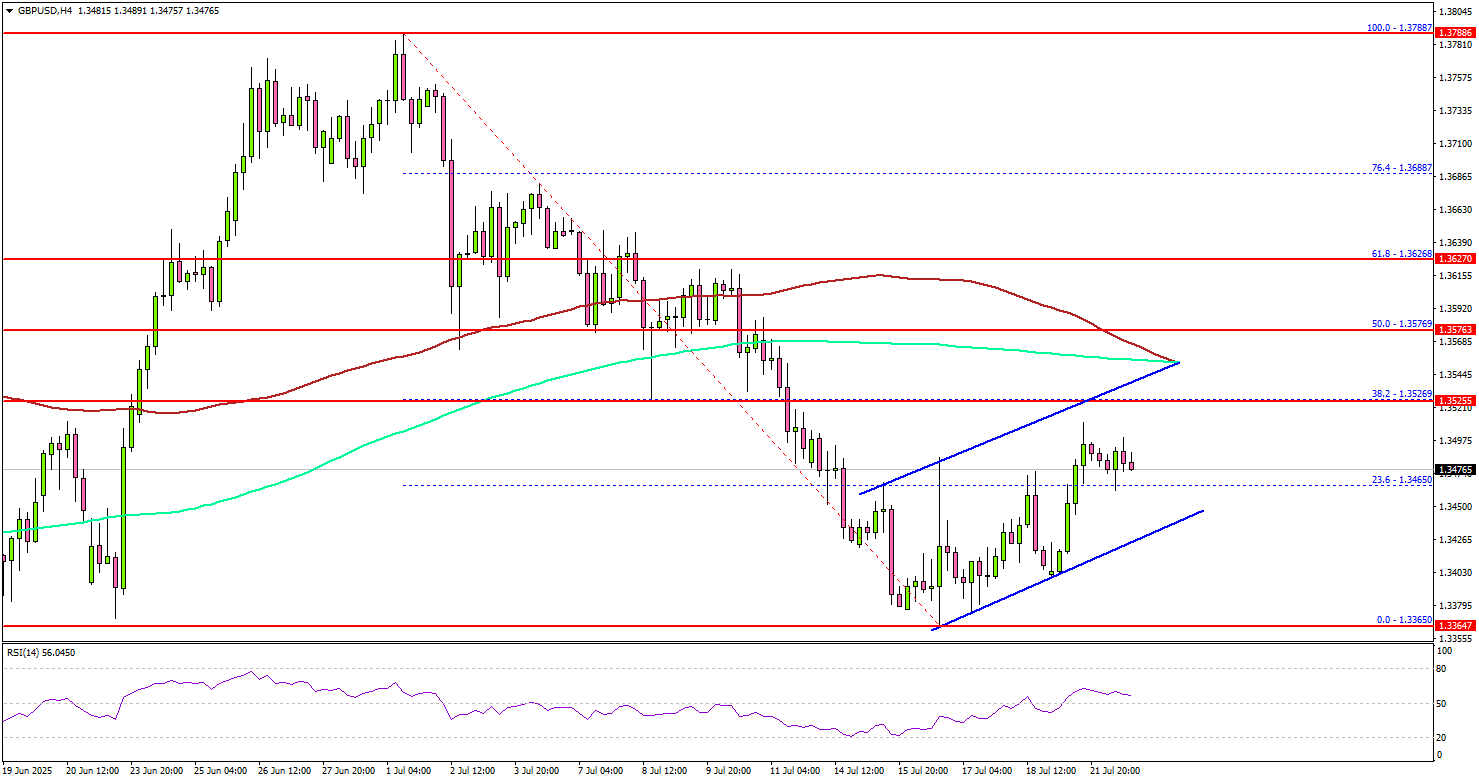
On the upside, the pair could face resistance near the 1.3520 level. It is close to the 38.2% Fib retracement level of the downward move from the 1.3788 swing high to the 1.3365 low.
The next key resistance sits near the 1.3550 level and the 100 simple moving average (red, 4-hour). A close above the 1.3550 level could set the pace for another increase.
In the stated case, the pair could rise toward the 1.3620 resistance. The next major stop for the bulls could be near the 1.3750 resistance.
On the downside, immediate support is near the 1.3450 level. There is also a rising channel forming with support at 1.3450 on the same chart. The next key support sits near 1.3420. Any more losses could send the pair toward the 1.3365 support zone.
Looking at EUR/USD, the pair is attempting a fresh increase, and the bulls might soon aim for a move above the 1.1750 resistance.
Upcoming Economic Events:
- US Existing Home Sales for June 2025 (MoM) - Forecast +0.1%, versus +0.8% previous.
Nikkei soars past 41k on landmark US-Japan trade deal
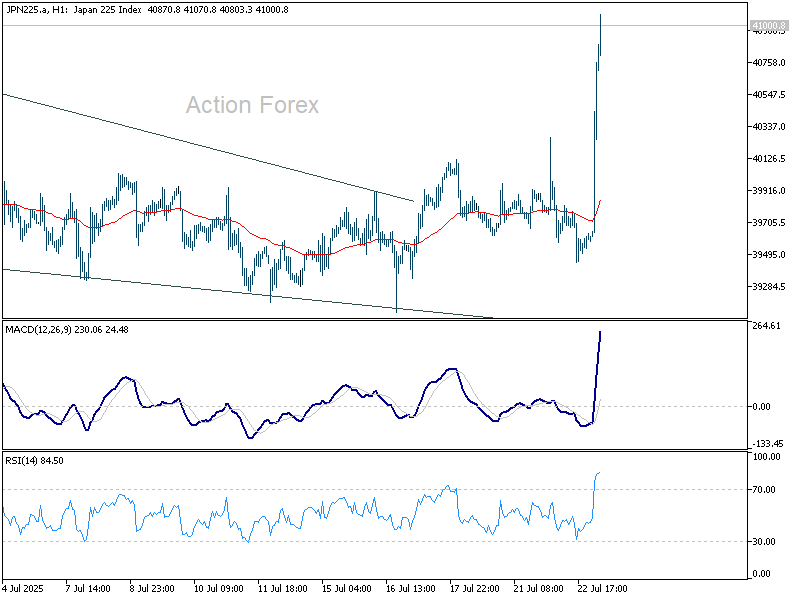
Nikkei jumped over 2% on today, breaking above the 41k level for the first time in a year after the US and Japan confirmed a long-anticipated trade deal. Investor sentiment was buoyed by the breakthrough, which reduces the threat of harsher tariffs that were set to take effect on August 1.
The agreement, publicly confirmed by both US President Donald Trump and Japanese Prime Minister Shigeru Ishiba, includes a 15% blanket tariff on Japanese imports—down from the initially threatened 25%. Japan’s chief negotiator Ryosei Akazawa called the outcome “#Mission Accomplished” in a social media post.
Trump hailed the deal as “perhaps the largest Deal ever made,” claiming Japan will invest USD 550B into the US and that Americans would receive “90% of the Profits.” Under the terms of the agreement, Japan will further open its markets to US goods, including cars, trucks, rice, and agricultural products. On the other hand, Ishiba indicated that the auto tariff rate will drop to 15% from the current 25% imposed globally.
BoJ’s Uchida see moderate growth and temporarily sluggish inflation
BoJ Deputy Governor Shinichi Uchida said in a speech today that Japan's economy is likely to "moderate" amid slowing global growth, with underlying inflation remaining "sluggish temporarily". He added that downside risks dominate the outlook, particularly due to high uncertainty surrounding global trade policy and its spillover effects on both domestic and external demand.
Still, Uchida maintained that if the Bank's baseline outlook holds, gradual rate hikes will continue. With real interest rates deeply negative, the BoJ is positioned to adjust its accommodative stance, but only as long as the economic and inflation path improves as expected.
He also highlighted the crosscurrents in Japan’s inflation profile—cost-push pressures from food remain elevated, while demand-side forces are weak. How businesses adjust wages and prices in response to these forces will be central to determining the sustainability of price growth.
Australia Westpac leading index falls to 0.03%, signals weak H2
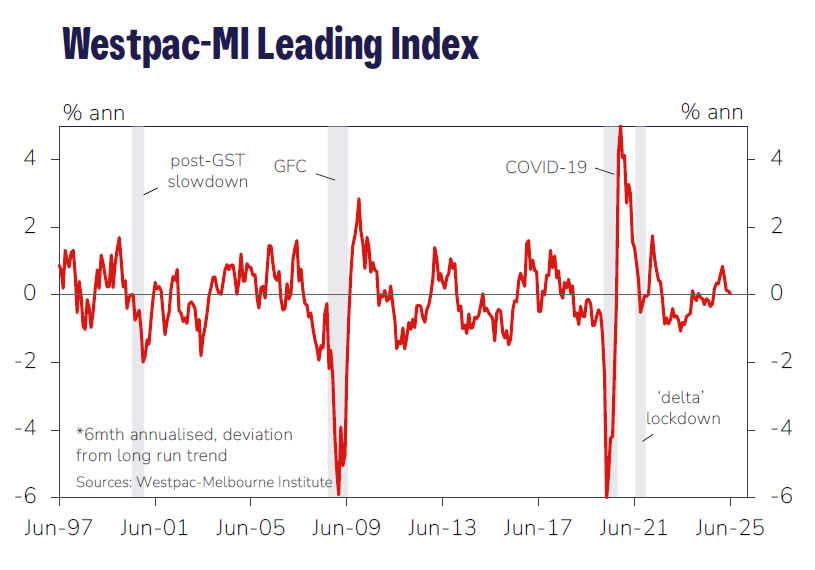
Australia’s Westpac Leading Index slipped from 0.11% to just 0.03% in May, continuing a six-month slide that points to weakening momentum heading into the second half of 2025. The index, which provides a guide to economic activity three to nine months ahead, has lost altitude from 0.33% in December, with five of eight components dragging—particularly commodity prices, consumer sentiment, and hours worked.
Westpac noted that the shift from modestly above-trend growth to an “around trend” signal marks a clear step-down in economic momentum. The bank now expects the economy to expand by only 1.7% in 2025, a slight pickup from 1.3% in 2024, but still well below historical averages.
With the RBA set to meet on August 11–12, the Leading Index adds to the case for renewed policy easing. Westpac sees the June quarter CPI, due next week, as the key swing factor. A benign reading would likely clear the way for a 25bp cut in August, followed by another in November and two further cuts in H1 2026 as the central bank gradually loosens policy amid persistent growth headwinds.
RBA Minutes July 2025: The Narrow Path of Narrative
Two divergent views on the appropriate path for the cash rate got a good airing in the July Monetary Policy Board minutes.
- RBA Monetary Policy Board (MPB) minutes acknowledge that inflation is within target and likely to stay there, while monetary policy is ‘modestly restrictive’. The labour market was viewed as still tight, though subsequent data might imply this judgement needs to evolve.
- A majority of MPB members viewed holding rates steady as necessary to be consistent with strategy of being ‘cautious and predictable’. By contrast, the minority of members in favour of a cut highlighted downside risks to growth and inflation, as well as the lags in the effects of monetary policy. A 50bp cut was not discussed at all.
The minutes cleared up a few misconceptions that have been circulating, including about how the RBA sees the ‘neutral’ cash rate.
The July MPB minutes started by highlighting the surprisingly benign conditions in global financial markets. While the trade environment was still very uncertain, the more extreme scenarios now seemed less likely. There had been ‘little discernible effect’ on the Australian economy so far from the trade disputes. While it was judged that it was too soon to see any effect in the data, the minutes expressed some surprise that there was little effect in the sentiment survey data as well. The MPB put more weight than before on its base case that US tariffs would land at lower rates than originally announced, but still much higher than what prevailed before the current US administration was inaugurated. Understandably, though, there were concerns about whether markets were too complacent now, rather than simply overly pessimistic in April.
The discussion on inflation reflects the institution’s caution and understandable reluctance to declare victory on getting inflation back to target. While the monthly CPI indicator was deemed to be too volatile to rely on, the minutes highlighted alternative monthly calculations that ‘had not eased as much as the monthly trimmed-mean indicator recently’. All of this will be moot by the end of this year, when the full monthly CPI becomes available. As we have previously flagged, there is a risk that June quarter trimmed mean inflation comes in a little above what the RBA had forecast in May, and the RBA was happy to use the monthly data to highlight this risk.
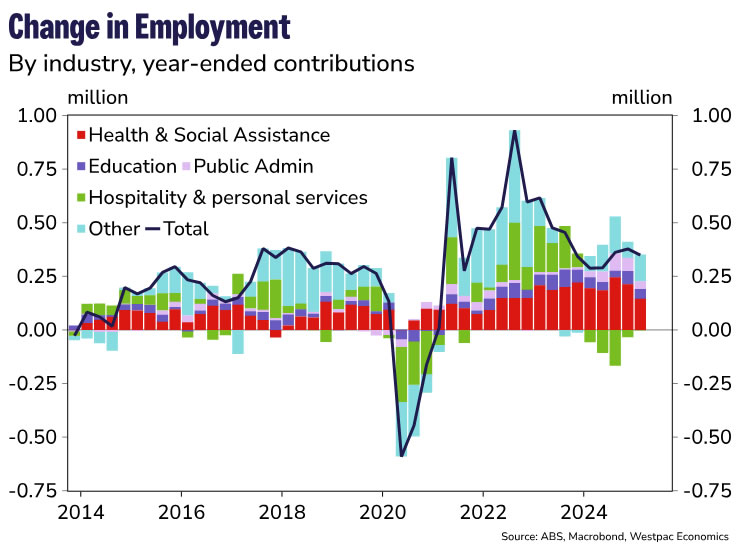
The RBA staff are alive to the need for a handover from non-market to market-sector employment growth, something we have been highlighting for some time. We take some comfort from the resilience of employment growth in most market-sector industries; an earlier downturn in hospitality-related employment now seems to have passed as well (see graph). Interestingly, the minutes suggested it was possible that a ‘shaky’ handover with slower employment growth could be compatible with an unchanged unemployment rate as long as the participation rate did not continue to trend up. Given the demographic trends underlying the participation trend, though, we are less confident that the net result will be benign for unemployment.
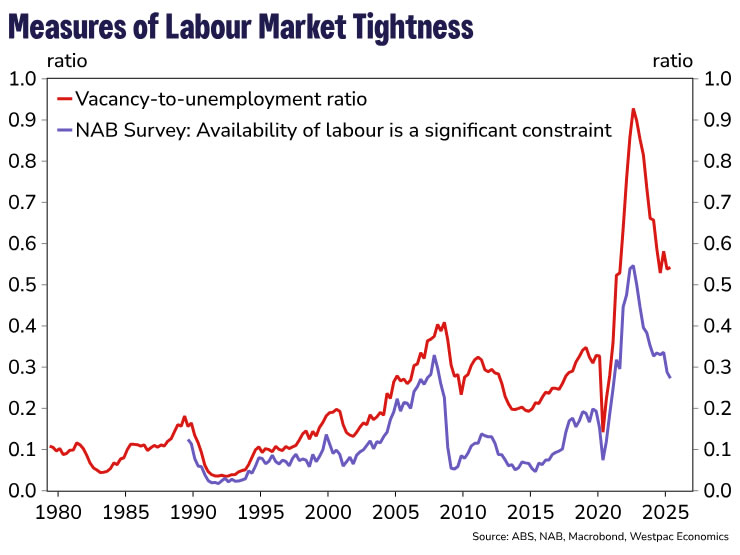
More broadly, the minutes elaborated on the RBA’s ongoing view that the labour market is still tight, pointing to the unemployment rate and underemployment rate. It can be reasonably inferred that the staff showed the MPB a graph of the vacancy-to-unemployment ratio along with the NAB survey’s measure of significant difficulty finding suitable labour, two series that are unreasonably tightly correlated given their different sources. Since the meeting, though, another reading of the NAB quarterly survey has come in, showing another fall. Together with the June labour force survey, this lends further weight to the idea that the labour market is again becoming less tight, after a pause in that unwind late last year.
The minutes again tackled the productivity debate, acknowledging that the expansion of the non-market sector and declining mining sector output had contributed to developments recently. These shorter-term factors are unlikely to continue at the current pace. While it is true, as the minutes highlight, that productivity growth has been lower in recent decades than over a long run of history, the IT/internet boom of the 1990s explains a large part of the gap. What the minutes do not make clear is whether the assumed pick-up in productivity growth in the forecasts is simply the unwind of the shorter-term factors – a reasonable assumption – or relies on AI boosting productivity similarly to the effect computers had in the 1990s.
The MPB also used this meeting’s minutes to clear up some misunderstandings about its view of the economy. In particular, the minutes included an extended discussion about the ‘neutral’ interest rate. A whole-economy view implied that monetary policy was ‘modestly restrictive’. Inflation was in the target and expected to remain around its midpoint even if the cash rate were reduced in line with market pricing at the time of the May forecast round. Various models from the academic and central bank literature point to a similar conclusion. Given the uncertainties around these models, though, ‘public discussion of the stance of monetary policy had possibly overemphasised the inferences that could be drawn from these alternative models, especially for the near term’. This admonition is in line with our earlier warning not to give that shift much credence. The average of estimates of neutral had fallen, but given that revision history, so would have the weight that policymakers put on that central estimate.
With a split decision, both the arguments to hold and to cut got a decent airing. The case to hold largely relied on some recent data coming in marginally stronger than the staff forecasts, along with receding risks of the more severe trade scenarios. The need for further confirmation that inflation was indeed on track aligns with a desire to remain ‘cautious and predictable’.
The minority of members who voted for a cut highlighted the risks that the growth and inflation forecasts might prove too optimistic. More immediately, and as we highlighted ahead of the meeting, they viewed the available information as already providing enough evidence that inflation was in target and on track.
A policy risk implicit in the minutes is that policymakers might cleave to a narrative about how they should conduct policy beyond its use-by date. A good-sounding phrase – ‘the narrow path’, say, or ‘not ruling anything in or out’ – starts off being useful, but it can shape thinking even when circumstances change. The ‘cautious and predictable’ language could be subject to this risk, especially if MPB members take it as an end in itself.
In any case, the argument for caution might not imply a slow return to neutral. The original basis for moving cautiously comes from William Brainard’s work in the 1960s. This showed that if you are uncertain about how much policy will affect the economy, you should do less in the face of a shock than you would if you were certain. But this means not going as far away from neutral as you would in a more certain environment. That is not the same as being away from neutral and returning more slowly than otherwise. But it does suggest that uncertainty about where neutral is will become a bigger issue for the MPB with time.
Bitcoin (BTC/USD) Price Outlook: Triangle Breakout Could Lead Bitcoin to 126200
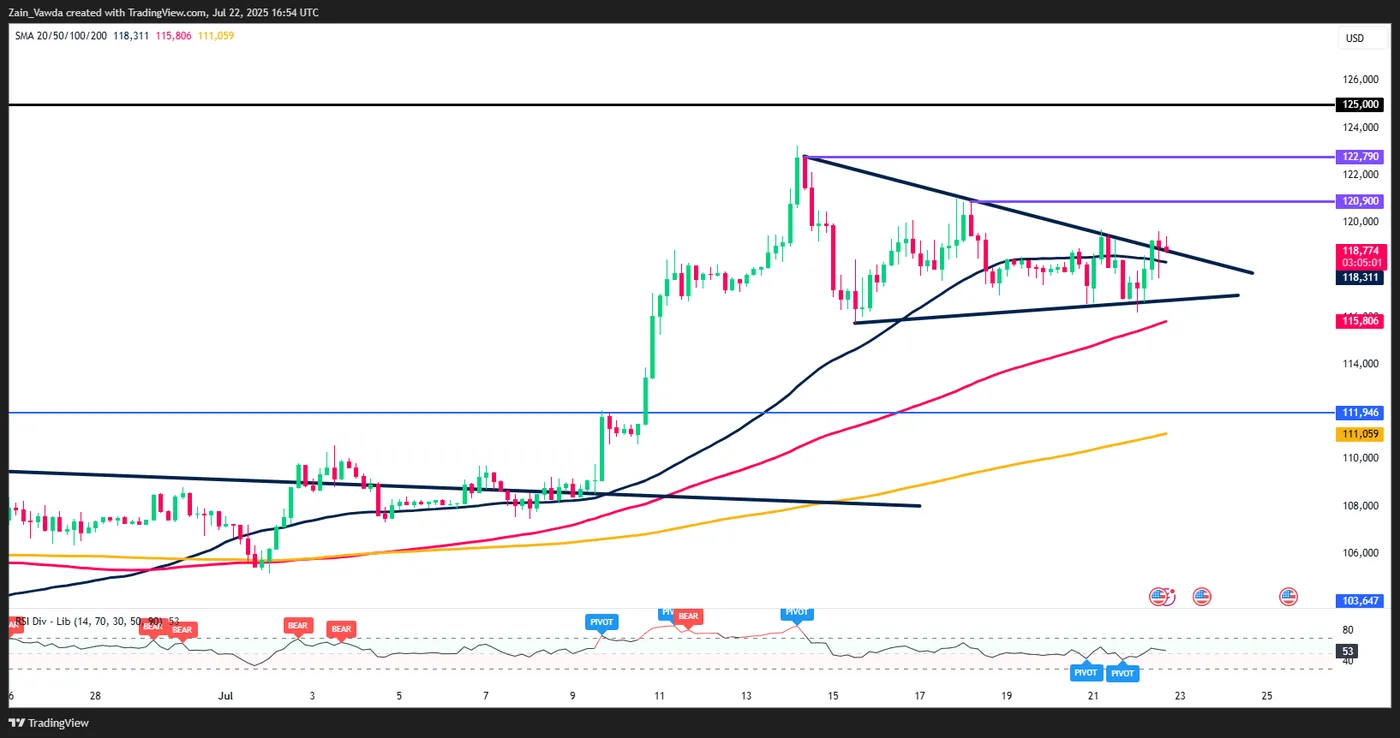
Bitcoin (BTC/USD) is still consolidating below the key 120k level but a triangle breakout may lead to fresh all-time highs.
The world's largest cryptocurrency has broken above the triangle pattern on the H4 chart which could be the start of the next leg to the upside.
Bitcoin did break below the 50 neutral level on the RSI period 14 yesterday before breaking back above immediately which could be a sign that momentum remains with the bulls.
Looking for potential targets following a triangle breakout, traders typically use a simple method to set a price target:
- Measure the Base: Find the widest part of the triangle. This is the vertical distance between the highest and lowest points at the beginning of the triangle formation.
- Project from Breakout:
-
- For an upside breakout (price breaks above the top trendline): Take the measured height of the triangle's base and add it to the price level where the breakout occurred.
- For a downside breakout (price breaks below the bottom trendline): Take the measured height of the triangle's base and subtract it from the price level where the breakout occurred.
This projected price is your potential target. It's important to also look for increased trading volume to confirm the breakout and consider placing a stop-loss order to manage risk in case of a false breakout.
With this in mind, a potential target rests around the 126200 handle.
Bitcoin (BTC/USD) Daily Chart, July 22, 2025
Source: TradingView.com (click to enlarge)
Bitcoin ETF Breaks 12-Day Inflow Streak
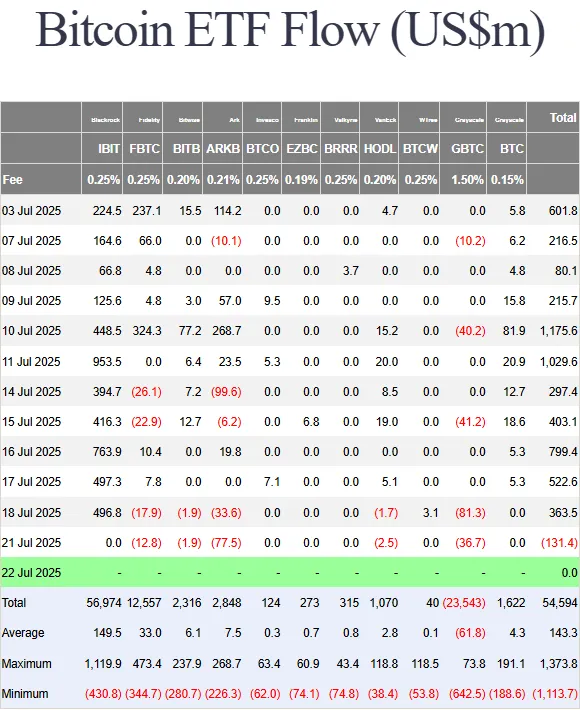
The only concern at present may come from spot Bitcoin ETFS, which saw 131.35 million in outflows on Monday. This brought a 12-day inflow streak to an end which brought in as much as $6.6 billion.
The biggest outflow came from ARK Invest’s ARKB, which lost $77.46 million in one day. Grayscale’s GBTC followed with $36.75 million in outflows, and Fidelity’s FBTC saw $12.75 million withdrawn, according to SoSoValue.
Bitwise’s BITB and VanEck’s HODL had smaller outflows of $1.91 million and $2.48 million. BlackRock’s IBIT, the largest fund with $86.16 billion in assets, had no changes in inflows or outflows.
Despite these outflows, total net inflows remain strong at $54.62 billion, and all spot Bitcoin ETFs combined hold $151.60 billion in assets, making up 6.52% of Bitcoin’s total market value.
Source: Farside Investors
If outflows do continue then this could hinder a potential rally toward the 126200 area. Another factor to consider could be potential profit taking and rebalancing by institutions following the recent all-time highs.
Client Sentiment Data - Bitcoin (BTC/USD)
Looking at OANDA client sentiment data, the majority of traders are long on Bitcoin with 97% of traders net-long. I prefer to take a contrarian view toward crowd sentiment, thus the fact that 97% of traders are net-long suggests a deeper pullback may be in play in the near-term.
Silver Wave Analysis
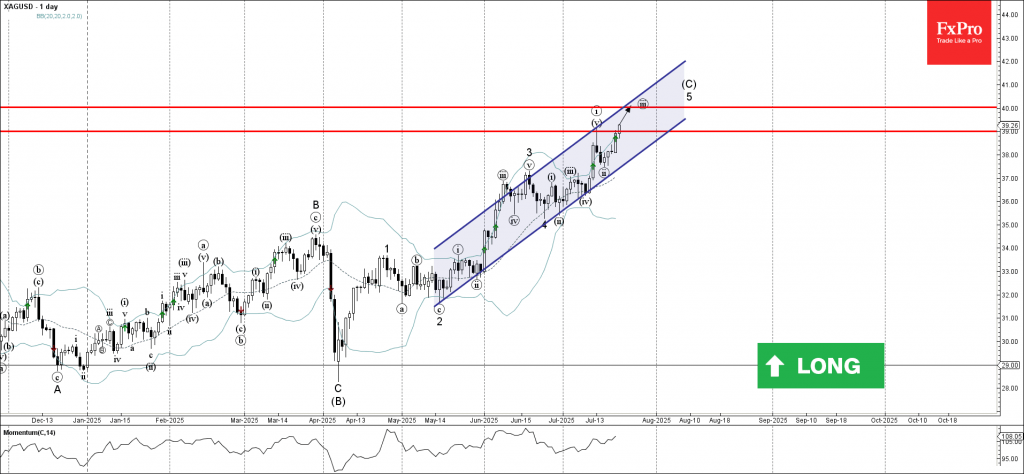
Silver: ⬆️ Buy
- Silver broke resistance level 39.00
- Likely to rise to resistance level 40.00
Silver recently broke the resistance level 39.00, which stopped the previous impulse wave i earlier this month, as can be seen from the daily Silver chart below.
The breakout of the resistance level 39.00 should accelerate the active impulse waves 5 and (C).
Given the clear daily uptrend, Silver can be expected to rise to the next resistance level 40.00, target price for the completion of the active impulse wave iii.
Bitcoin Wave Analysis
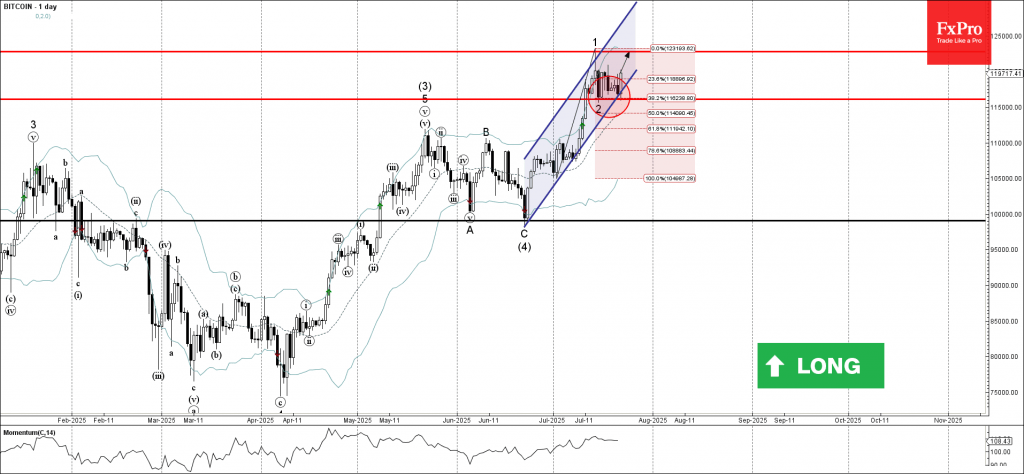
Bitcoin: ⬆️ Buy
- Bitcoin reversed from support level 116065.00
- Likely to rise to resistance level 122775.00
Bitcoin cryptocurrency recently reversed up from the key support level 116065.00, which also stopped the earlier minor correction 2 at the start of June.
The support level 116065.00 was further strengthened by the support trendline of the daily up channel from June and the 38.2% Fibonacci correction of the upward impulse from July.
Given the strong daily uptrend, Bitcoin cryptocurrency can be expected to rise further to the next resistance level 122775.00 (which stopped the previous impulse wave 1).
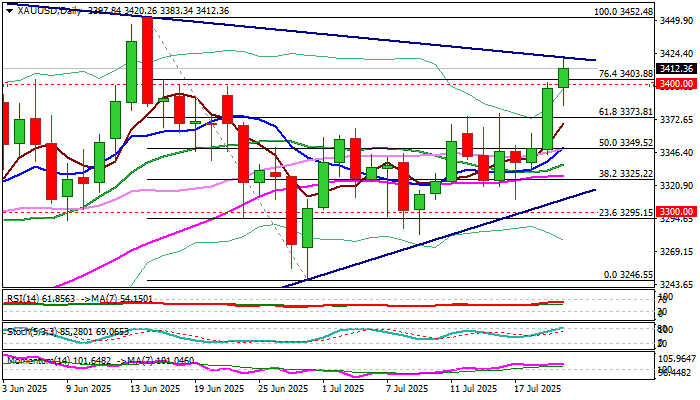
XAU/USD: Gold Hits New Five-Week High on Break Above Pivotal Barriers at $3,400 Zone
Gold surged above $3400 barrier on Tuesday after a brief pause (shallow pullback from $3402 to $3383) and cracked next target at $3420 (triangle’s upper boundary).
Steep ascend extends into second consecutive day, with daily close above $3400 zone (psychological / Fibo 76.4% of $3452/$3246) to generate fresh bullish signal, which will be validated on sustained break above $3420 that would unmask $3452 (June 16 top).
Meanwhile, corrective dips should be anticipated on strongly overbought hourly studies and expected to provide better levels to re-enter bullish market.
Broken barrier at $3400 reverted to solid support which should ideally contain, with extended dips to find ground above today’s low ($3383) to keep larger bulls intact.
Res: 3420; 3437; 3452; 3500.
Sup: 3400; 3383; 3350; 3330.