Sample Category Title
USD/JPY: Pullback to Find Firm Ground Above 146.70 to Keep Larger Bulls Intact
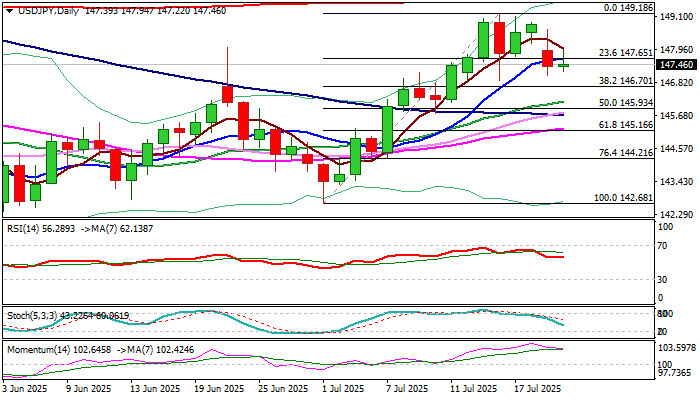
Narrow consolidation follows Monday’s drop which found temporary footstep at 147 zone.
Pullback from last week’s three-month high (149.18) pauses but still has more space to extend lower.
Fibo 38.2% retracement of 142.68/149.18 (146.70) marks solid support which should contain dips and mark healthy correction of the bull-leg from 142.68, before larger bulls regain traction.
Repeated daily close below 147.65 (broken 10DMA / Fibo 23.6%) to keep the downside vulnerable, though overall bullish structure on daily chart, works in favor of scenario of limited correction before fresh push higher.
However, fundamentals are likely to be a key driver again, with markets focusing on Aug 1 tariff deadline.
Situation may deteriorate if no deal is found until then and prompt fresh rally into safety that would support yen.
In such scenario, the pair may accelerate through 146.70 and violate other pivots at 146 zone (20DMA / 50% retracement / 100DMA) that would weaken near-term structure and risk deeper drop.
Res: 147.65; 148.00; 148.66; 149.00.
Sup: 147.00; 146.70; 146.19; 145.93.
EUR/USD Rises as Investors Remain Cautious Amid Mounting Risks
The EUR/USD pair climbed higher, settling near 1.1688 by Tuesday, as investors adopted a cautious stance ahead of key trade negotiation updates. The looming 1 August deadline –set by the US for new trade agreements – has kept markets on edge.
US Treasury Secretary Scott Bessent remarked on Monday that the quality of trade deals takes precedence over strict deadlines for the current administration. He added that President Donald Trump may extend the deadline for countries demonstrating constructive progress in negotiations.
Market attention has now shifted to an upcoming speech by Federal Reserve Chair Jerome Powell in Washington. Investors are keen for any signals regarding future interest rate policy.
Despite mounting pressure from Trump for a rate cut, markets remain sceptical that such a move will materialise in the next Fed meeting.
With a light economic calendar at the start of the week, traders are focusing on broader macroeconomic factors.
Technical Analysis: EUR/USD
H4 Chart:
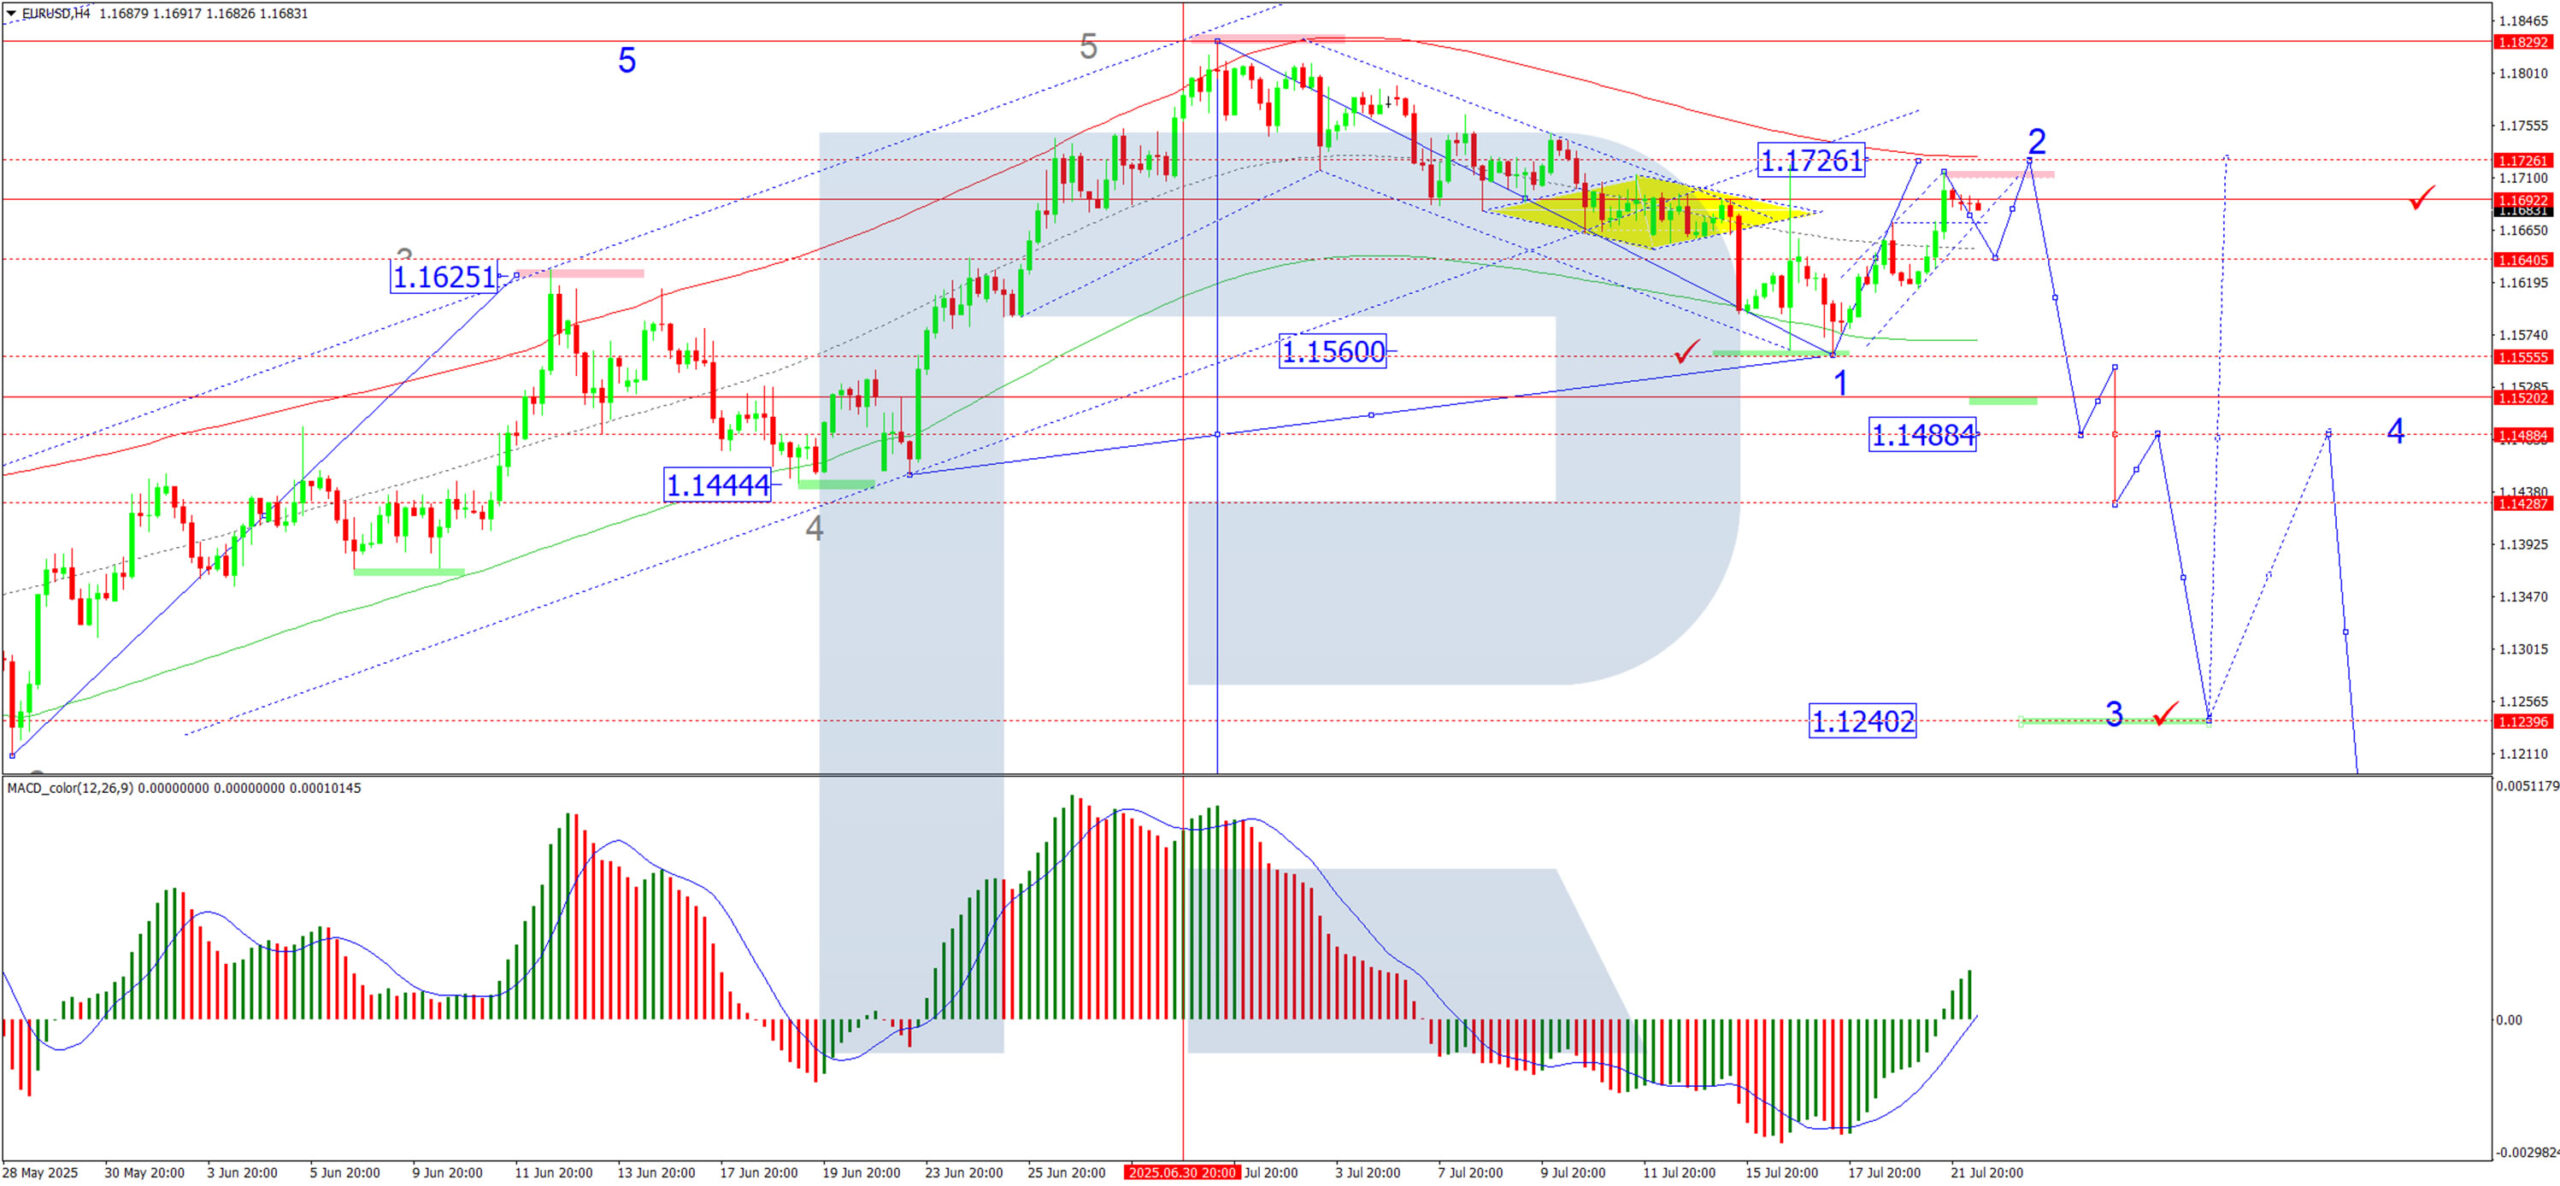
On the H4 chart, EUR/USD formed a consolidation range near 1.1640. Breaking upwards, the pair achieved its local correction target at 1.1716. Today, we anticipate a pullback towards 1.1640 (testing from above), followed by another upside move to 1.1726, where the correction’s potential is likely to be exhausted.
Subsequently, we expect a fresh decline towards 1.1560, with further downside potential to 1.1488. This scenario is supported by the MACD indicator, where the signal line remains above zero and is trending upwards.
H1 Chart:
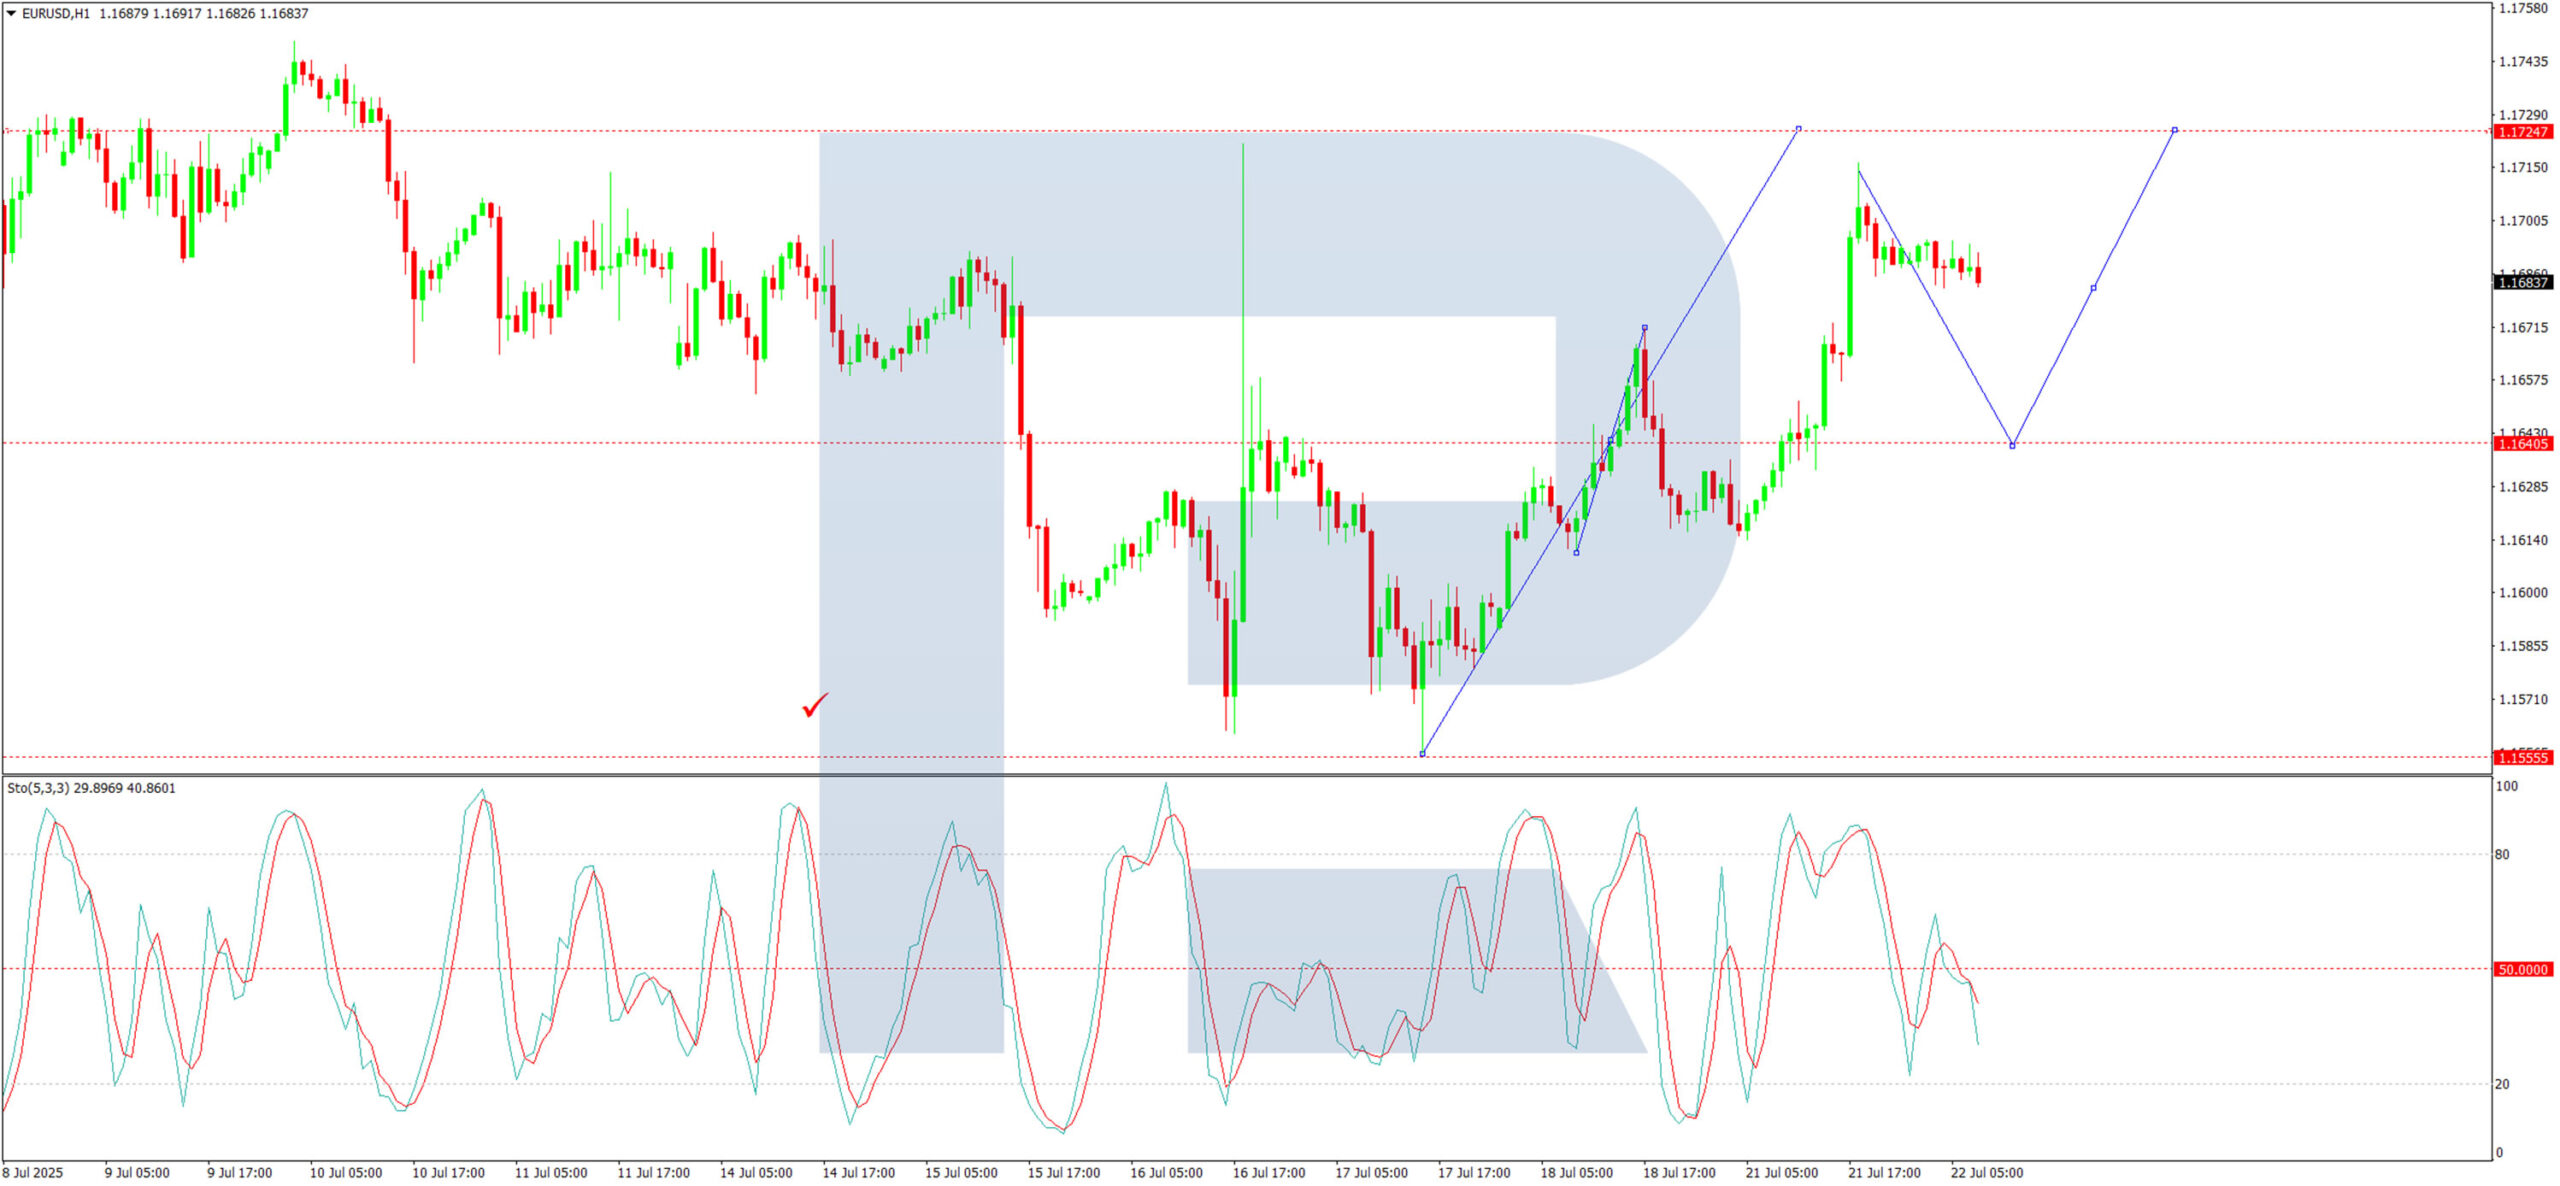
On the H1 chart, the pair has met its local growth target at 1.1716, with the entire upward move seen as a correction to the prior downtrend. Today, a decline towards 1.1640 is probable, followed by another rise to 1.1726.
This outlook is confirmed by the Stochastic oscillator, where the signal line sits below 50 and is trending downward towards 20.
Conclusion
While EUR/USD shows short-term bullish momentum, the broader trend remains bearish, with key resistance levels likely to cap gains before another downward move unfolds.
Disclaimer
Any forecasts contained herein are based on the author's particular opinion. This analysis may not be treated as trading advice. RoboForex bears no responsibility for trading results based on trading recommendations and reviews contained herein.
Tariffs and Earnings Drive Markets as FTSE 100 Trades Above 9000
Asian Market Wrap
Asian stock markets dipped after reaching a nearly four-year high on Tuesday, as investors awaited corporate earnings and monitored US tariff talks.
MSCI's broad Asia-Pacific index (excluding Japan) hit its highest level since October 2021 earlier in the day but later fell by 0.4%. The index has gained almost 16% this year.
Japanese markets reopened after Monday’s holiday, following weekend elections where the ruling coalition lost in the upper house. Despite the setback, Prime Minister Shigeru Ishiba pledged to stay in office.
Japanese stocks briefly rose at the open but turned lower by the afternoon, as the election results were already factored in and not as bad as expected.
The yen gained 1% on Monday, recovering some recent losses, but slightly weakened on Tuesday to 147.73 per dollar.
European Open
European markets are expected to remain cautious, with attention on earnings from companies like SAP and UniCredit. Futures for the EUROSTOXX 50 and DAX dropped 0.5%, while FTSE futures fell 0.3%.
As the August 1 tariff deadline approaches, investors are hoping strong earnings from major US and European companies will support the markets. They’ll closely examine quarterly results to see how trade uncertainty has affected profits and consumer demand.
A key focus will be on how much the euro’s 9% rise in the April-June quarter has impacted profits in Europe’s export-driven economy. So far this year, the euro has risen 13% as investors moved away from US assets due to President Trump’s unpredictable trade policies.
SAP previously estimated that every 1 cent increase in the euro could reduce its annual revenue by 30 million euros. The euro is now at 1.1688, up from 1.1329 in April.
Earnings from luxury brand LVMH and drugmaker Roche are also in the spotlight this week.
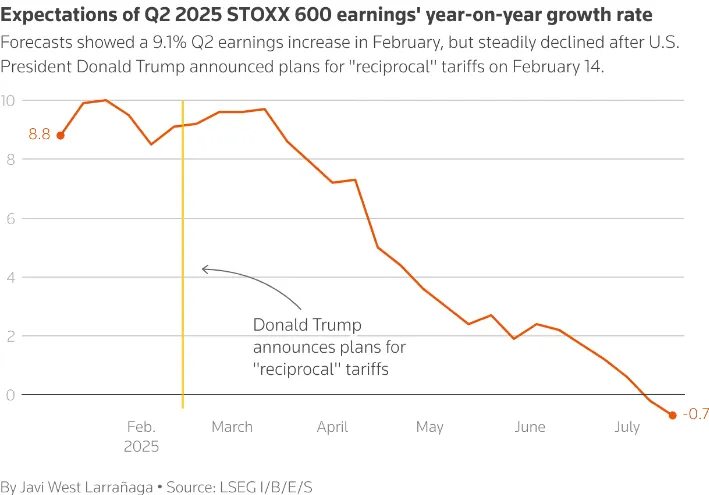
Source: LSEG
Meanwhile, tariffs remain a key issue. The EU is considering measures to counter US trade pressure, such as targeting US services or limiting access to public contracts. President Trump has threatened 30% tariffs on European imports if no deal is reached by August 1.
On the FX front, the US dollar stayed mostly unchanged on Tuesday after a small drop earlier in the week. Investors are keeping an eye on trade deal talks ahead of the August 1 deadline, which could lead to high tariffs if no agreements are made.
The dollar held steady after falling on Monday due to a stronger yen and lower US Treasury yields. The British pound dropped slightly to 1.3474, while the euro slipped to 1.1689. Attention is also on the European Central Bank’s upcoming rate decision, where no changes are expected.
The dollar index, which measures the dollar against other currencies, rose slightly to 97.882 after a 0.6% drop on Monday.
Currency Power Balance
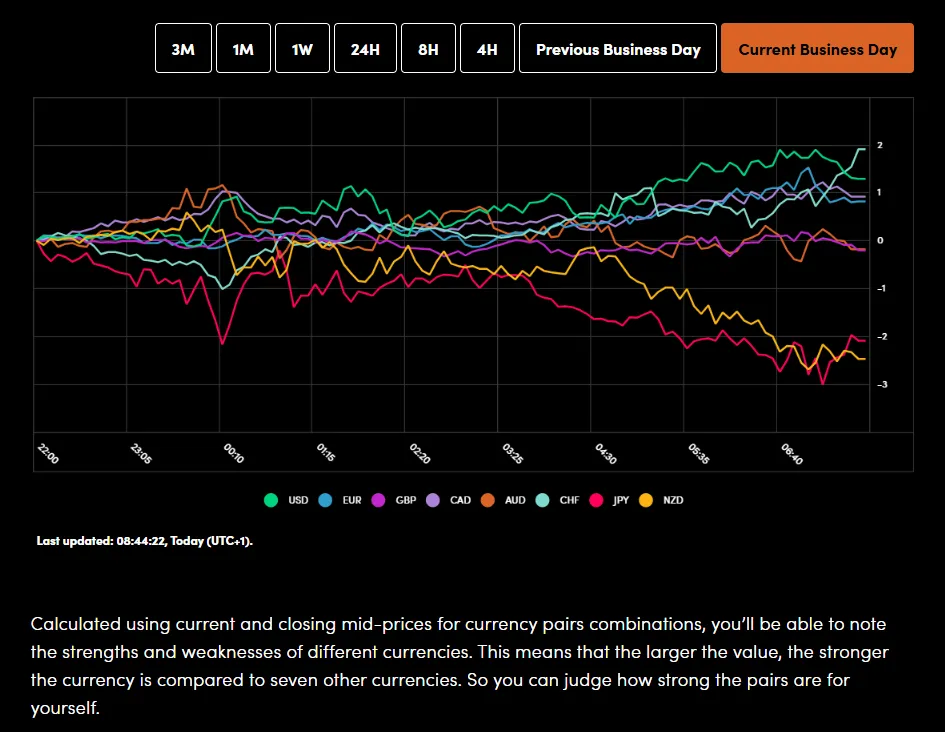
Source: OANDA Labs
Investors are also concerned about the Federal Reserve’s independence, as President Trump has criticized Fed Chair Jerome Powell and pressured him to cut interest rates.
Gold prices rose yesterday finding resistance back at the $3400/oz handle. Overnight and this morning we are seeing bulls a bit more cautious as trade deal uncertainty rears its ugly head once more, boosting haven appeal.
Oil prices continue their slide today, testing the 100-day MA. There are a host of factors affecting Oil prices at the moment with a clear direction not presenting itself just yet. For more on oil prices, read WTI Oil Slips as 200-day MA Caps Upside Potential
Economic Data Releases and Final Thoughts
Looking at the economic calendar, it is a quiet day in terms of data releases.
Trade negotiations and earnings are set to spend another day dominating the overall market narrative and driving sentiment.
Earnings due today include Coca Cola, Raytheon, Lockheed Martin and General Motors.
Later in the day we will get a speech from Fed policymaker Bowman. However, with the Fed having entered its blackout period, its unlikely that he will touch too much on the Feds monetary policy stance.
This will be followed with API weekly crude oil numbers which could stoke some volatility in Oil prices.
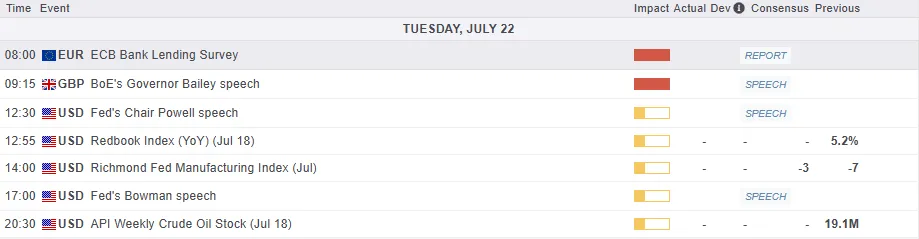
For all market-moving economic releases and events, see the MarketPulse Economic Calendar. (click to enlarge)
Chart of the Day - FTSE 100 Index
From a technical standpoint, the FTSE 100 index is hovering just above the psychological 9000 handle.
There is a possibility of a pullback though just looking at price action and the wicks off the last two days on the daily timeframe.
However, positive earnings developments and trade deal news could propel the FTSE beyond the 9000 handle. The question is whether the index will be able to hold onto any gains above the 9000 handle.
Immediate support rests at 8956 before the 8925 and 8900 handles come into focus.
Immediate resistance rests at 9029 before the 9048 handle which is the all-time high comes into focus.
FTSE 100 Daily Chart, July 22. 2025
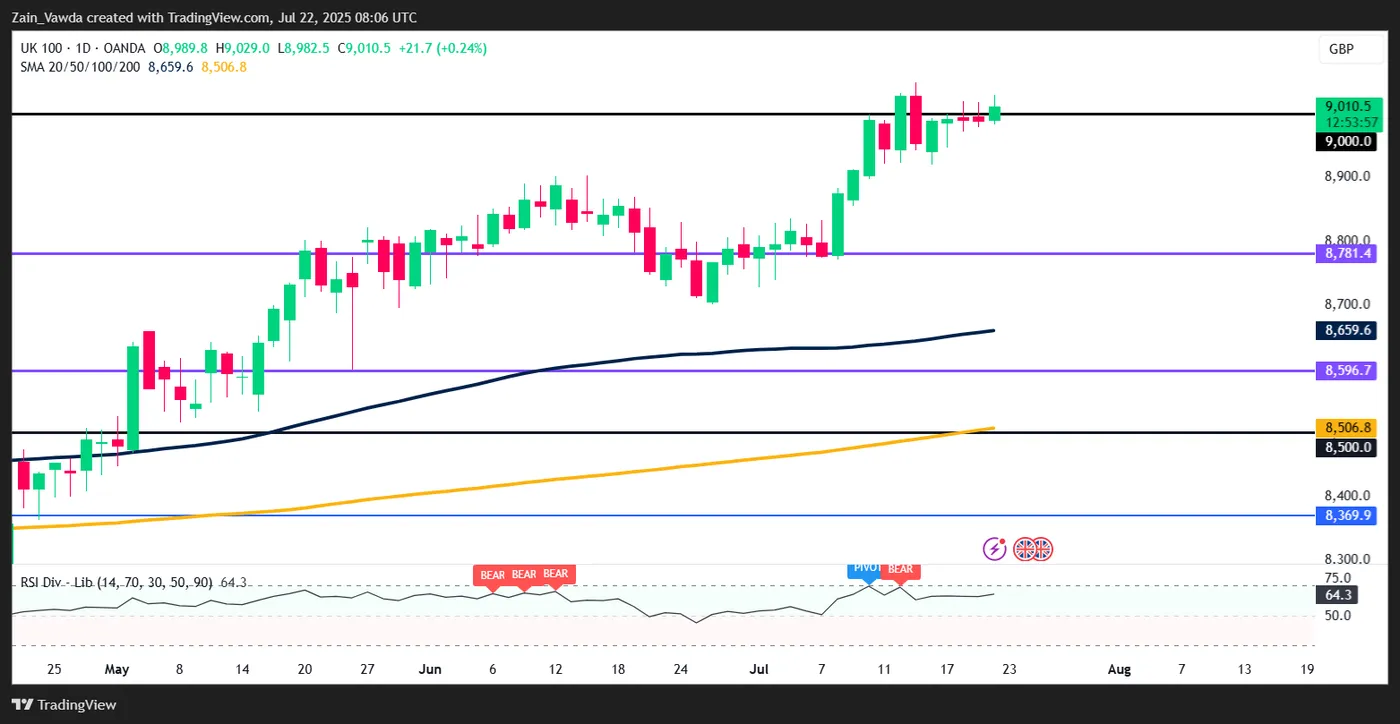
Source: TradingView.com (click to enlarge)
Natural Gas Price Drops by 7%
As the XNG/USD chart shows today, natural gas is trading around $3.333/MMBtu, although yesterday morning the price was approximately 7% higher.
According to Reuters, the decline in gas prices is driven by:
→ Record-high production levels. LSEG reported that average gas output in the Lower 48 rose to 107.2 billion cubic feet per day so far in July, surpassing the previous monthly record of 106.4 billion cubic feet per day set in June.
→ Favourable weather forecasts. Although the peak of summer heat is still anticipated, forecasts indicate that temperatures over the next two weeks may be lower than previously expected.
As a result, today’s XNG/USD chart appears bearish.
Technical Analysis of the XNG/USD Chart
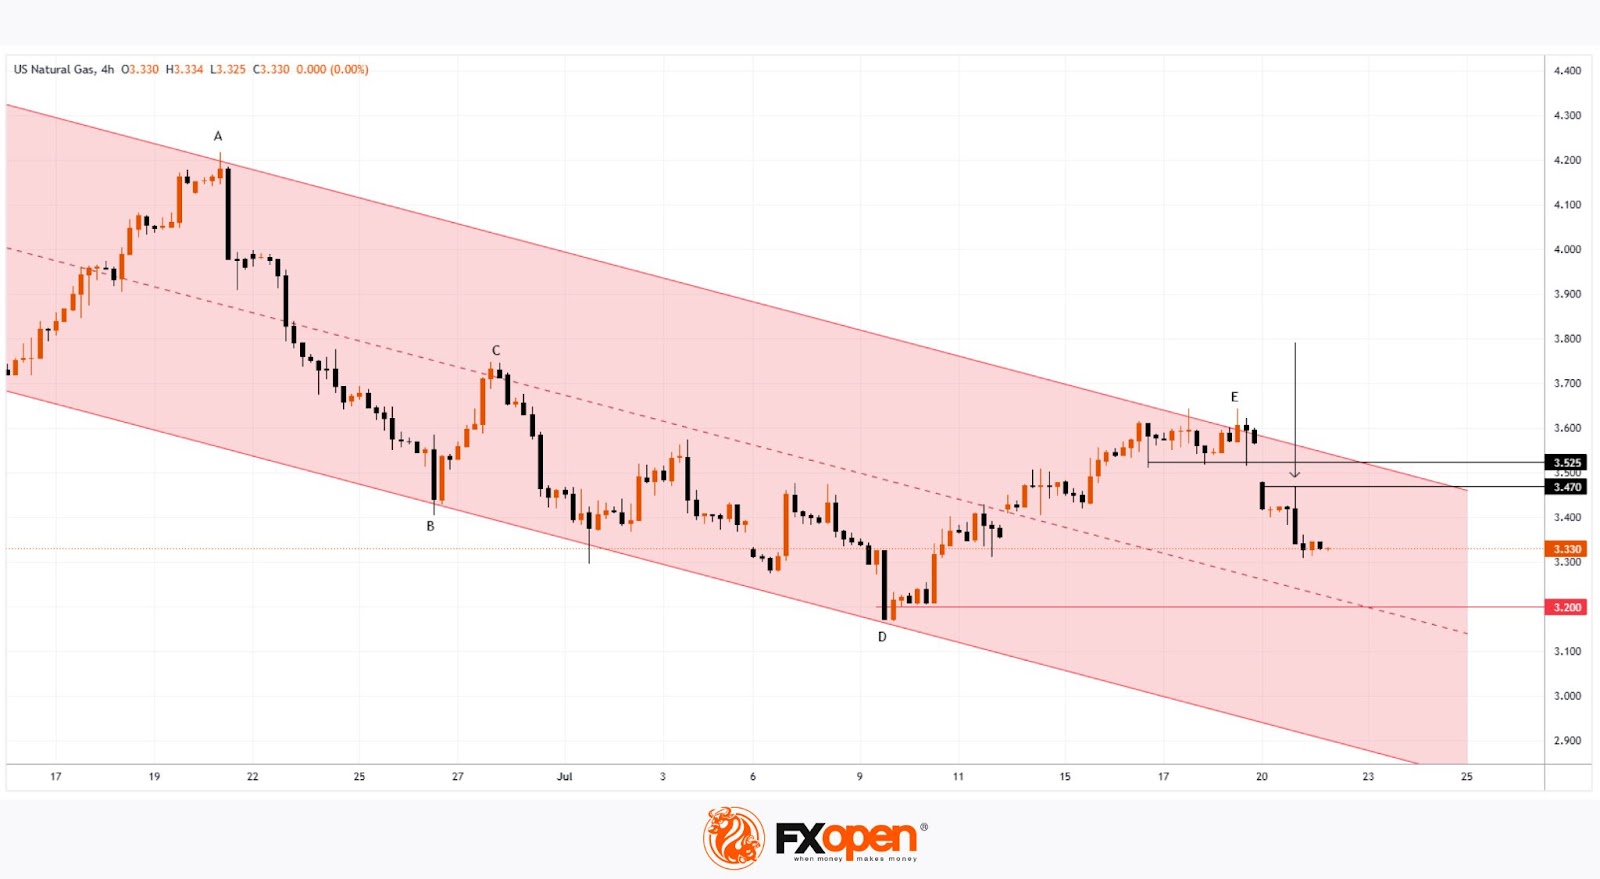
The chart indicates that since mid-May, natural gas prices have been fluctuating within a descending channel (marked in red), with July’s peak (E) highlighting the upper boundary of the pattern.
A key resistance area is now represented by a bearish gap, formed between:
→ the former support level at $3.525;
→ the $3.470 level – which, as the arrow suggests, is already showing signs of acting as resistance.
Under these conditions, it is reasonable to assume that the price may continue forming a downward market structure A-B-C-D-E, consisting of lower highs and lows, potentially moving towards the channel’s median – which approximately corresponds to July’s low (around the $3.200 level).
Start trading commodity CFDs with tight spreads. Open your trading account now or learn more about trading commodity CFDs with FXOpen.
This article represents the opinion of the Companies operating under the FXOpen brand only. It is not to be construed as an offer, solicitation, or recommendation with respect to products and services provided by the Companies operating under the FXOpen brand, nor is it to be considered financial advice.
Asia Markets Mixed as US Tariff Fears Mount; Singapore 30 (Chart of the Day)
Asia Pacific equities saw profit-taking today, mirroring overnight volatility in US markets. The S&P 500 gave up early gains to close just 0.1% higher at a record 6,305, weighed by renewed tariff uncertainty. With the 1 August deadline approaching, White House Press Secretary Leavitt signalled that President Trump may issue more unilateral tariff actions.
Singapore STI cools after record run
Singapore’s Straits Times Index slipped -0.2%, breaking an 11-session winning streak that pushed it to overbought territory, 3.3% above its 20-day moving average of 4,062.
Nikkei 225 pulls back but holds support
Japan’s Nikkei 225 erased an earlier 1.2% gain to trade down -0.3%. However, it remains supported by its 20-day moving average at 39,690, a key technical level since mid-July.
Hang Seng stays resilient amid choppy session
The Hang Seng Index bucked the regional trend, edging up 0.2% after successfully retesting its previous breakout level at 24,850, now acting as pull-back support.
US dollar stabilizes after sharp decline
The US Dollar Index bounced slightly (+0.1%) in Asia, after falling -0.6% yesterday — its worst daily drop since 12 June. Resistance remains near the 50-day MA at 98.60. EUR/USD is a key pair to watch, with the euro flat but holding recent strength.
Gold hits 5-week high, faces minor pull-back risk
Gold (XAU/USD) broke out above US$3,374 to reach a five-week high of US$3,400. However, overbought intraday momentum signals suggest potential profit-taking ahead of Fed Chair Powell’s speech later today. Gold has since eased -0.3% to US$3,385.
Crude oil slips on demand concerns, trade tensions
WTI crude declined for a third day, down -0.4% to US$66.60 amid concerns over US-China talks, including discussions on Chinese imports of Russian and Iranian oil. Prices are nearing critical support at US$66.10, a key trend level since 25 June.
Economic data releases
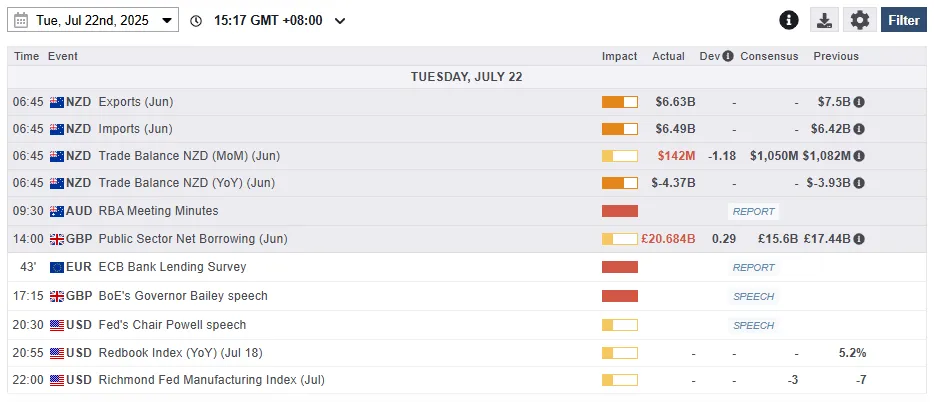
Fig 1: Key data for today’s Asia mid-session (Source: MarketPulse)
Chart of the day – Singapore 30 at risk of shaping minor corrective decline
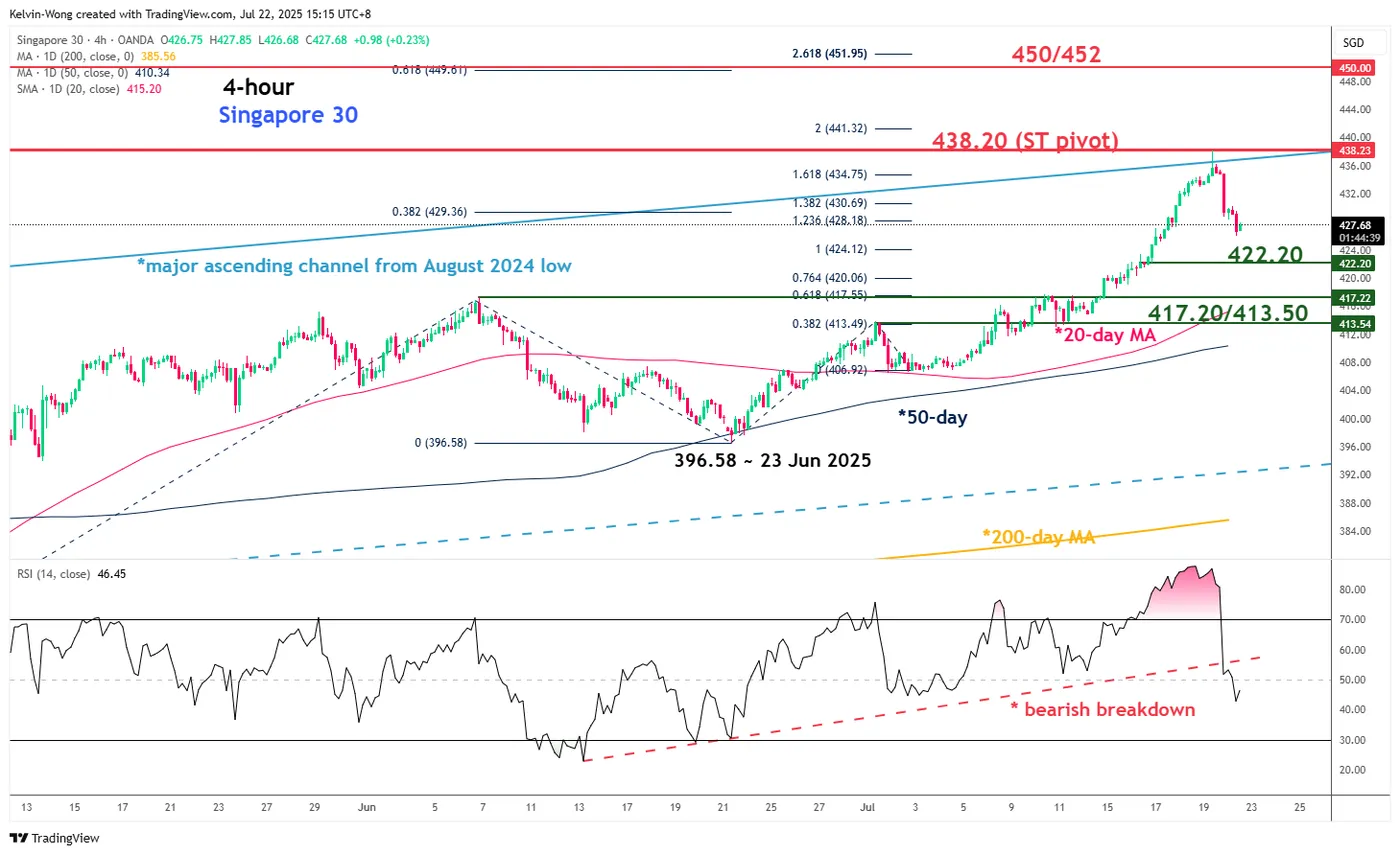
Fig 2: Singapore 30 CFD medium-term & minor trends as of 22 July 2025 (Source: TradingView)
Several technical elements are now indicating that the Singapore 30 CFD Index (a proxy for the MSCI Singapore futures) has reached an overextended up move condition from its intraday low of 396.58 printed on 23 June to Monday, 21 July’s intraday high of 438.14
Firstly, it has formed a 4-hour bearish “Shooting Star” candlestick pattern after a test on the upper boundary of a major ascending channel in place since August 2024 low.
Secondly, the 4-hour RSI momentum has staged a bearish breakdown in yesterday’s US session below its former parallel ascending support from 13 June and inched lower below the 50 level mark at this time of writing (see Fig 2).
These observations suggest that the Singapore 30 is likely to see a minor corrective pull-back/consolidation at this juncture after four weeks of steep bullish impulsive up moves.
Watch the 438.20 short-term pivotal resistance for the next intermediate supports to come in at 422.20 and 417.20/413.50 (also the 20-day moving average).
However, a clearance above 438.20 invalidates the minor corrective pull-back scenario to resume the bullish impulsive up move sequence to expose the next intermediate resistance at 450/452.
Global Yield Curves Bull Flattened
Markets
In a session devoid important data, global yield curves bull flattened yesterday. The move probably was due to technical considerations alongside lingering uncertainty on the outcome of trade negotiations between the US and major trading partners that have to be finished before the Augst 1 deadline. On the ‘technical side of the equation’, ultra-long yields in several major economies last week came close to cycle peak and/or high profile levels (e.g. US 30-y 5%, 30-y Japanese 3.2% area, UK 30-j 5.5% area, German 30-y 3.25% area). Those levels held, at least for now. At the same time, most recent headlines on the status of the US-EU trade talks suggest that the US is less inclined to a compromise after the US president Trump set a 30% reference tariff. A tariff level well above the hoped for 10% with potential EU retaliation might have bigger negative consequences both for US and EU growth. German yields declined between 4.6 bps (2-y) and 9.3 bps (30-y). The US yield curve also bull flattened with yields easing between 0.8 bps (2-y) and 4.35 bps (30-y). Despite sharply lower EMU (and UK) yields, the dollar underperformed. DXY dropped from 98.35 to close near 97.85. EUR/USD jumped from 1.1635 to 1.1694. Despite rising uncertainty on a favorable outcome of the trade talks, equities again held up fairly well. The S&P 500 for the first time ever closed north of 6300 (+0.14%) as the earnings season will come into full swing this week.
This morning, Asian equities show a mixed picture with China slightly outperforming. Japanese markets reopen after a market holiday yesterday. During the weekend, the LDP-led collation also lost its majority in the Upper House. Even so, Prime Minister Ishiba indicated to stay in his function as key topics, including the conclusion of trade talks with the US, have to be addressed. The outcome of the election keeps the focus on debt sustainability as some of the opposition parties winning in the elections are pushing for (costly) additional measures (including a sales tax cut) to address a cost of living crisis that was a major topic. For now, the market reaction is modest. The 30-y yield adds 2.5 bps (3.10%). After gaining modest ground yesterday, the yen eases slightly (USD/JPY 147.7).
Today’s eco calendar is again thin. We keep an eye that the Philly Fed non-manufacturing activity survey and the ECB lending survey. Later this week, headline from the trade talks will probably continue to set the tone for global trading. Other interesting topics later this week included a 20-y US Treasury auction tomorrow, US and EMU PMI’s on Thursday and the ECB policy decision, also on Thursday. After reducing the policy rate to 2% in June, the ECB is expected to keep a wait-and-see approach, taking its time to assess the outcome of the trade negotiations and its potential impact on EMU growth and inflation going forward.
News & Views
The non-partisan US budgetary watchdog came up with a new estimate for Trump’s recently enacted tax and spending law. The Congressional Budget Office says it would add $3.4tn to US deficits over the next decade, reflecting a $4.5tn decrease in revenue and a $1.1tn decline in spending. This new analysis does not take into account the dynamic effects coming from the impact on growth or interest rates though. The CBO’s calculations are always relative to a current-law scenario, ie one where Trump’s 2017 tax cuts would expire by the end of the year. As per request of Senate Republicans, the CBO also made an analysis relative to the current policy which compares the budgetary impact with the situation as it is today, regardless of any laws fading out. In such a scenario, US deficits would in fact decrease by $366bn over the next decade. It’s this accounting trick that lawmakers used to count the permanent extension of the 2017 tax cuts as costing nothing and allowing the OBBBA to be voted by simple majority in the Senate rather than the required 60-40.
The Polish finance ministry in recently approved updated assumptions for 2025-2029 has forecasted an economic growth of 3.4% and 3.5% for this year and the next respectively. That’s a downward revision from April’s 3.7% for 2025. Inflation would average at 3.7% in 2025 and 3% in 2026. This marks a more significant downward adjustment from 4.5% and 3.8%. The government expects inflation to remain consistent with the central bank’s 2.5% +/-1 ppt target afterwards. The numbers serve as part of the macroeconomic framework for next year’s state budget.
GBP/JPY Daily Outlook
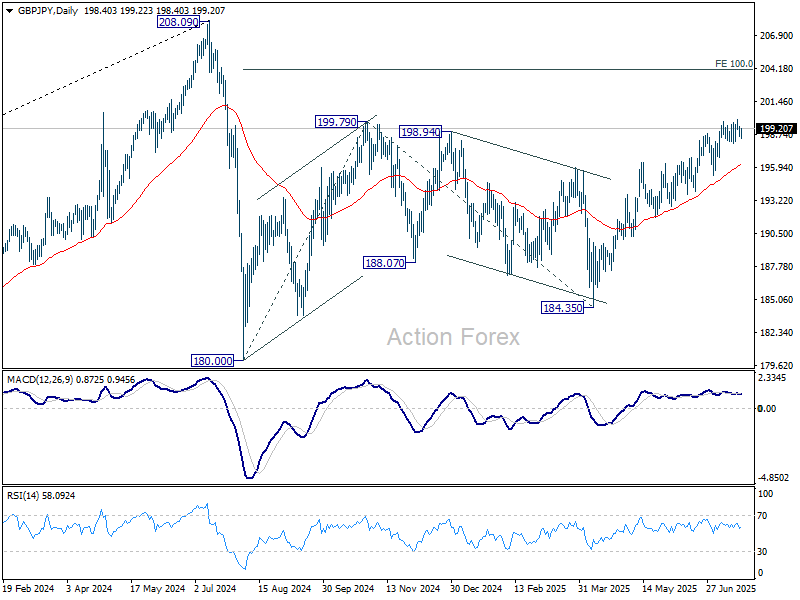
Daily Pivots: (S1) 198.40; (P) 198.91; (R1) 199.31; More...
Intraday bias in GBP/JPY remains neutral and more consolidations would be seen below 199.96. While deeper pullback cannot be ruled out, further rally will remain in favor as long as 195.33 support holds. Above 199.96 will resume the rise from 184.35 to 100% projection of 180.00 to 199.79 from 184.35 at 204.14.
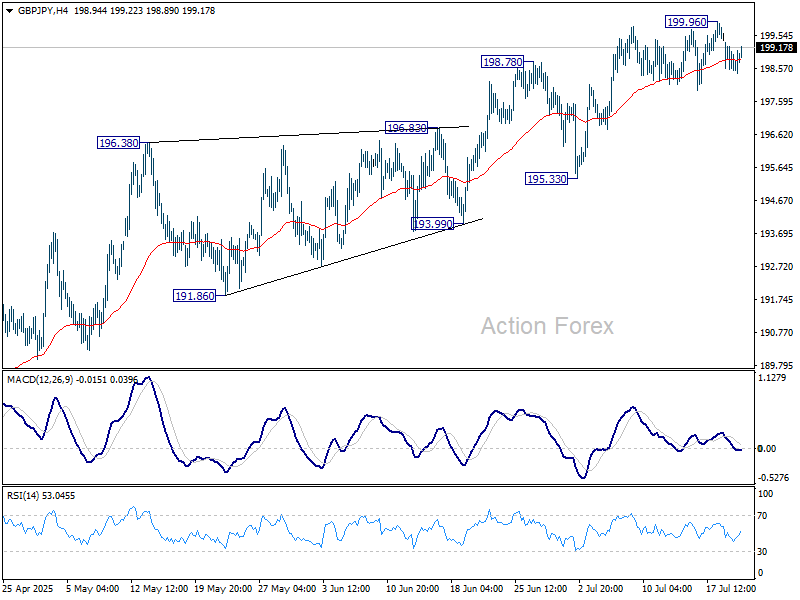
In the bigger picture, price actions from 208.09 (2024 high) are seen as a correction to rally from 123.94 (2020 low). The pattern might still extend with another falling leg. But in that case, strong support should be seen from 38.2% retracement of 123.94 to 208.09 at 175.94 to contain downside. Meanwhile, decisive break of 208.09 will confirm long term up trend resumption.
EUR/JPY Daily Outlook
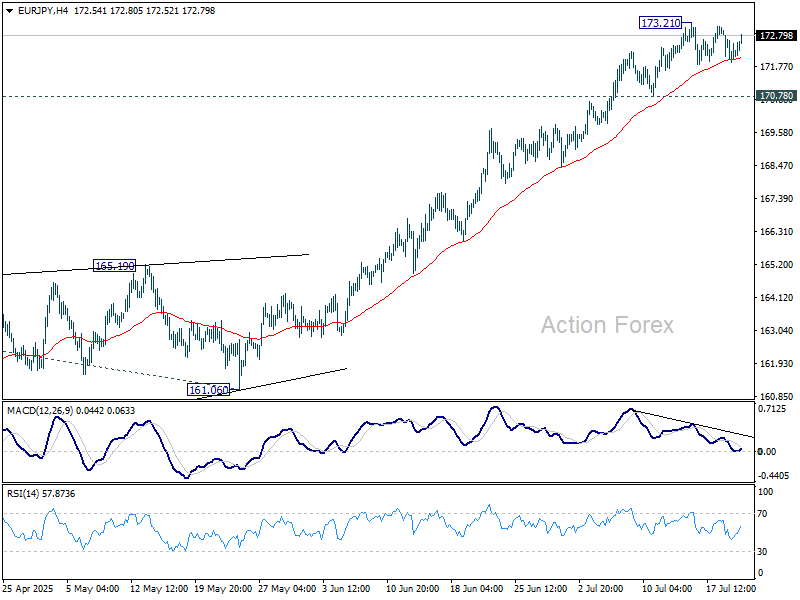
Daily Pivots: (S1) 171.86; (P) 172.35; (R1) 172.80; More...
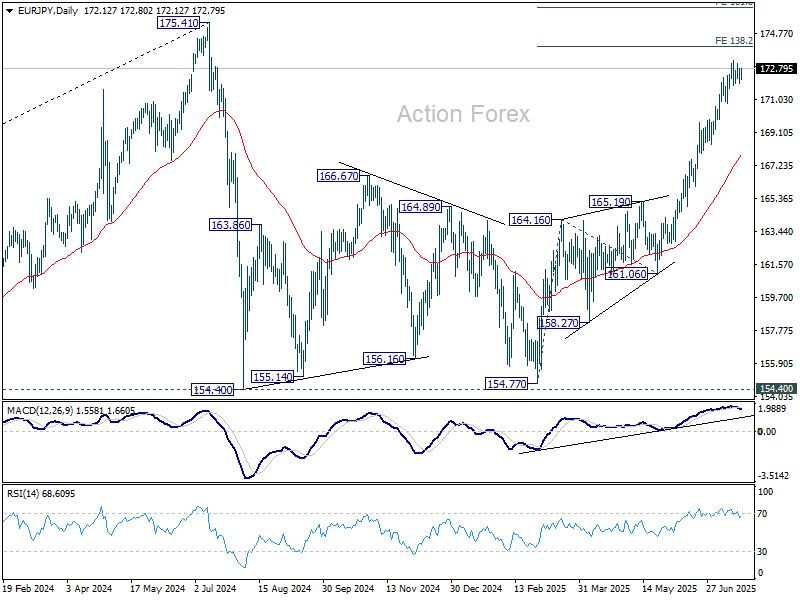
Intraday bias in EUR/JPY remains neutral as consolidations continue below 173.21. With 170.78 support intact, further rally is expected. On the upside, break of 173.21 will target 138.2% projection of 154.77 to 164.16 from 161.06 at 174.03. Break there will bring retest of 175.41 high. Nevertheless, considering bearish divergence condition in 4H MACD, break of 170.78 will indicate short term topping, and turn bias to the downside for deeper pullback.
In the bigger picture, price actions from 175.41 (2024 high) are seen as correction to up trend from 114.42 (2020 low). The pattern might still extend with another falling leg. But in that case, strong support should be seen from 38.2% retracement of 114.42 to 175.41 at 152.11 to contain downside. Meanwhile, decisive break of 175.41 will confirm long term up trend resumption.
EUR/GBP Daily Outlook
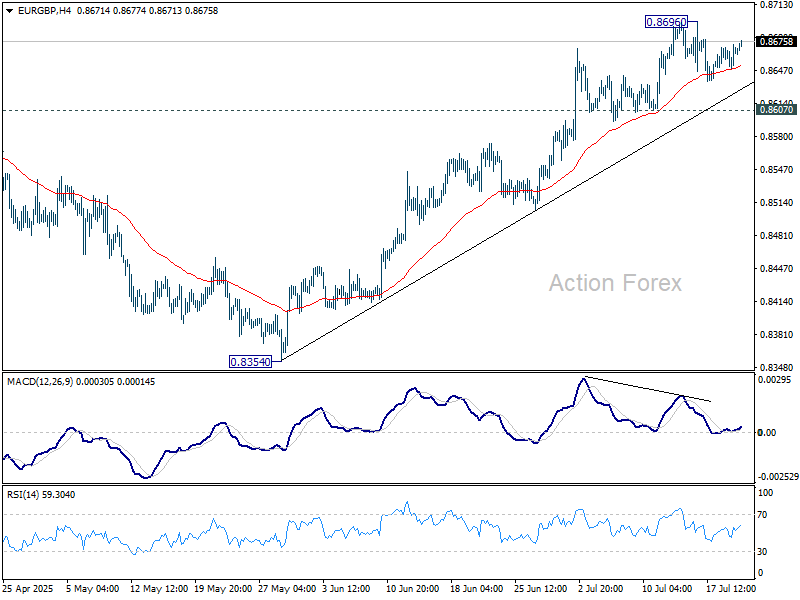
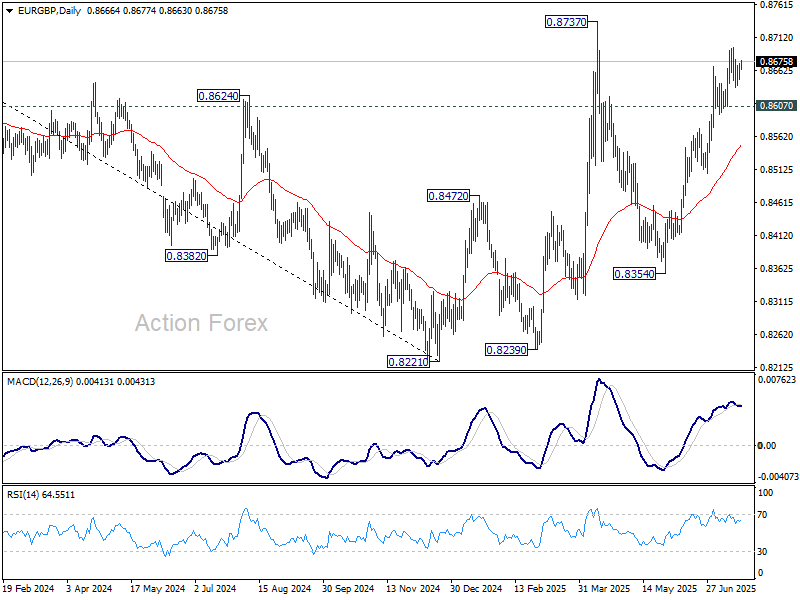
Daily Pivots: (S1) 0.8655; (P) 0.8664; (R1) 0.8679; More...
EUR/GBP is still extending consolidations below 0.8696 and intraday bias remains neutral. Further rally is expected with 0.8607 support intact. On the upside, above 0.8696 will bring retest of 0.8737 high. However, firm break of 0.8607 will confirm short term topping, on bearish divergence condition in 4H MACD. Deeper fall should be seen back to 55 D EMA (now at 0.8550).
In the bigger picture, the structure from 0.8221 medium term bottom are not impulsive enough to suggest that it's reversing the down trend from 0.9267 (2022 high). But even if it's a correction, firm break of 0.8737 will still pave the way to 61.8% retracement of 0.9267 to 0.8221 at 0.8867. For now, further rise will remain in favor as long as 55 W EMA (now at 0.8474) holds.
EUR/AUD Daily Outlook
Daily Pivots: (S1) 1.7860; (P) 1.7896; (R1) 1.7961; More...
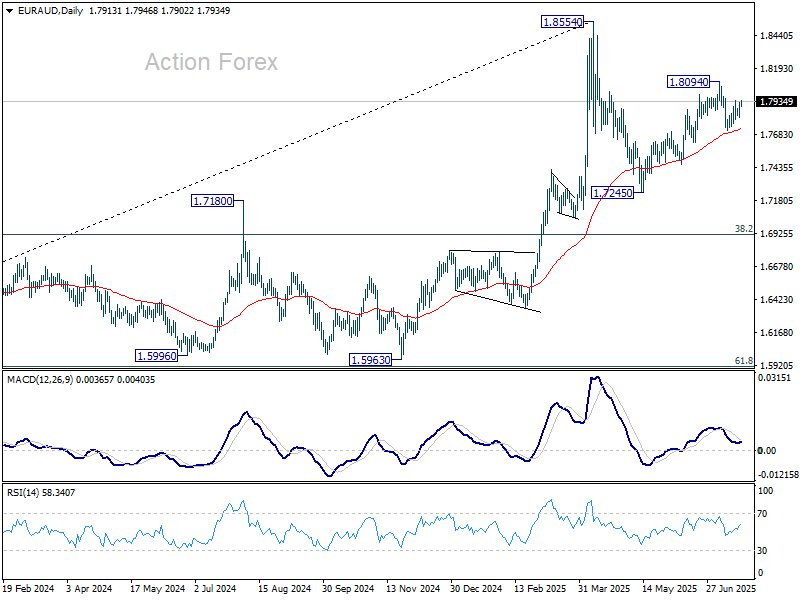
Intraday bias in EUR/AUD stays neutral for the moment. On the upside, break of 1.8094 will resume the choppy rise from 1.7245 towards 1.8554 high. However, break of 1.7717 support will revive the case that rise from 1.7245 has completed, and turn bias back to the downside for 1.7459 support instead.
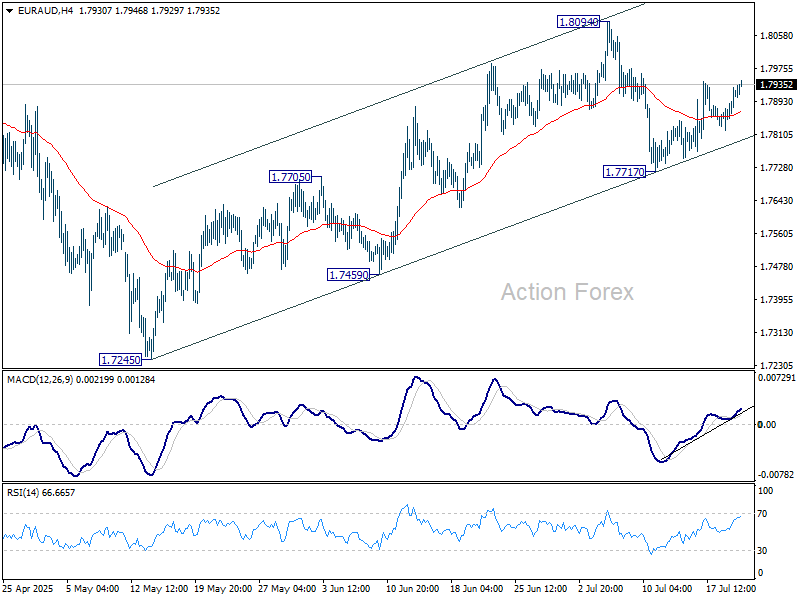
In the bigger picture, price actions from 1.8554 medium term top are seen as a corrective pattern. While deeper pullback might be seen, downside should be contained by 38.2% retracement of 1.4281 (2022 low) to 1.8554 at 1.6922 to bring rebound. Up trend from 1.4281 is expected to resume at a later stage.