
Sample Category Title
USD/JPY Mid-Day Outlook
Daily Pivots: (S1) 148.39; (P) 148.64; (R1) 149.08; More...
USD/JPY dips lower today as consolidations continues below 149.17. Intraday bias stays neutral and further rally is expected as long as 55 D EMA (now at 145.86) holds. On the upside, break of 149.17 will target 100% projection of 139.87 to 148.64 from 142.66 at 151.43. That is close to 61.8% retracement of 158.86 to 139.87 at 151.22.
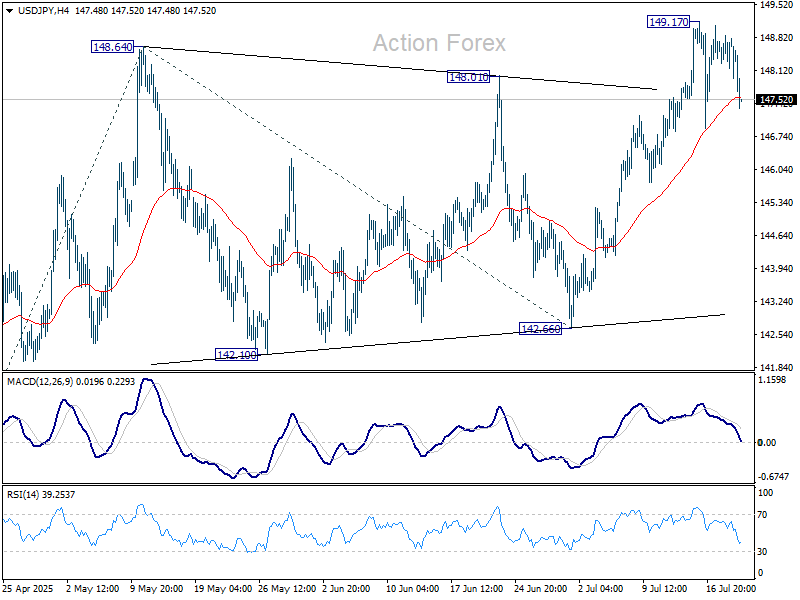
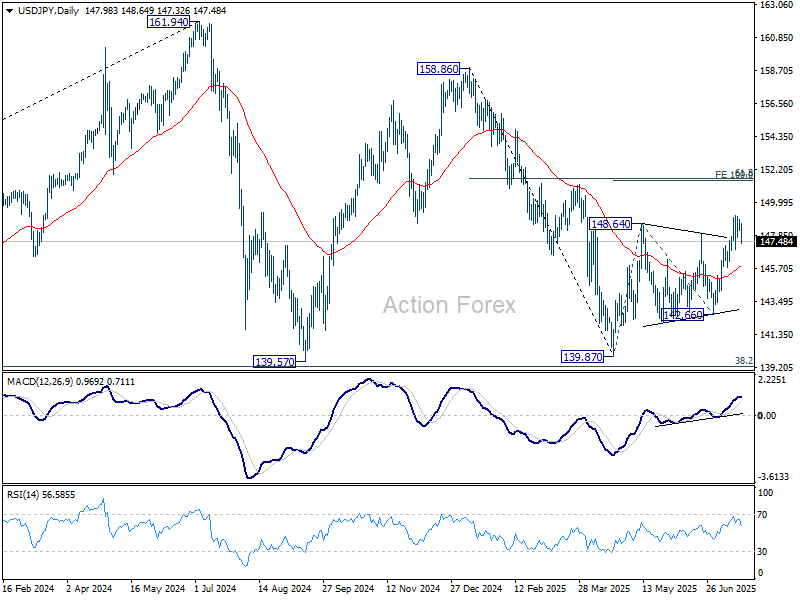
In the bigger picture, price actions from 161.94 (2024 high) are seen as a corrective pattern to rise from 102.58 (2021 low). There is no clear sign that the pattern has completed yet. But still, strong support is expected from 38.2% retracement of 102.58 to 161.94 at 139.26 to bring rebound.
Short-Covering Continues to Lift Yen, EU Said to Brace for Tariff Fight
Yen continues to lead the currency markets today, with fresh buying emerging in the early US session, particularly against Dollar. However, the rally appears more technical than structural, largely driven by short covering after Japan’s weekend election delivered no major surprises. Prime Minister Shigeru Ishiba’s Liberal Democratic Party lost its upper house majority, but the outcome had been widely anticipated.
Despite today’s gains, the broader outlook for Yen remains clouded by unfavorable fundamentals. Political uncertainty now looms larger, with Ishiba expected to cling to power through cooperation with opposition parties. That instability could complicate ongoing trade negotiations with the US, while keeping BoJ on the sidelines amid increased policy inertia.
Overall the currency markets, European currencies are also showing relative strength, led by Sterling which holds a mild edge over both Euro and Swiss Franc. On the other end, Dollar is underperforming, followed by commodity currencies including the Aussie and Kiwi and Loonie.
Tariff risks are back in focus following a Reuters report citing unnamed EU diplomats. US President Donald Trump’s threat of a 30% tariff by August 1 has raised alarm within the EU. Despite last week’s meetings between EU Trade Commissioner Maros Sefcovic and US officials, prospects for rolling back existing tariffs—such as the 50% on steel and 25% on autos—appear slim. The US has also floated baseline tariff rates well above 10%.
As the August 1 deadline approaches, EU policymakers appear more prepared to retaliate, even as they continue to prefer negotiation. A EUR 21B tariff package remains suspended until August 6, while another set targeting EUR 72B in US exports is under active consideration. More importantly, support is growing for deploying the EU’s anti-coercion instrument, though formal activation would require backing from a qualified majority.
Looking ahead, the upcoming RBA minutes will be closely scrutinized during the Asian session. This was the first meeting to reveal unattributed votes, showing a 6–3 split in favor of holding rates steady at 3.85%. The minutes may clarify whether it was a tactical delay or a sign of deeper dissent.
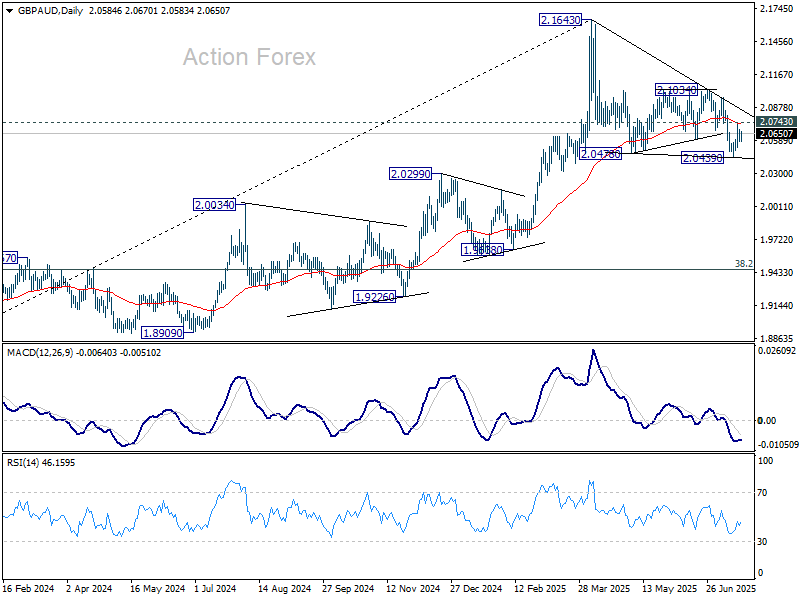
Technically, GBP/AUD could have formed a short term bottom at 2.0499 last week. Immediate focus is now on 2.0743 resistance and 55 D EMA (now at 2.0733). Sustained trading above this resistance zone will suggest that corrective pattern from 2.1643 has completed with three waves to 2.0499. Further rally should be seen to 2.1034 resistance next. Nevertheless, rejection by the EMA will extend the correction through 2.0439 before completion.
In Europe, at the time of writing, FTSE is down -0.09%. DAX is down -0.05%. CAC is down -0.41%. UK 10-year yield is down -0.061 at 4.618. Germany 10-year yield is down -0.068 at 2.629. Earlier in Asia, Japan was on holiday. Hong Kong HSI rose 0.68%. China Shanghai SSE rose 0.72%. Singapore Strait Times rose 0.42%.
ECB SAFE survey: Firms see slower inflation, trade shocks reorder priorities
The ECB’s latest SAFE (Survey on the Access to Finance of Enterprises) report showed that Eurozone firms have revised down their short-term inflation expectations while maintaining a cautious view on long-term price pressures. The median forecast for inflation one year ahead dropped to 2.5% from 2.9%. Expectations for three- and five-year horizons remained steady at 3.0%.
When asked about risks to five-year inflation, 52% of firms still viewed them as skewed to the upside, though that figure declined slightly from 55%. The share of firms seeing balanced risks increased to 33%, while those perceiving downside risks remained unchanged at 14%.
This round also included ad hoc questions about the impact of rising trade tensions, particularly recent US tariff announcements. The survey revealed uneven exposure across firms, with exporters to the US and manufacturing companies facing the greatest challenges. About 30% of respondents reported concerns over supply chain disruptions, including delays and shortages.
In response, many businesses are already pivoting. Firms cited plans to reorient sales toward domestic and EU markets and restructure supply chains to reduce dependency on vulnerable links.
NZ CPI rises to 2.7% yoy in Q2, tradeabales jump
New Zealand’s CPI rose 0.5% qoq in Q2, slightly below expectations for 0.6% qoq. Annual inflation ticked up to 2.7% yoy from 2.5% yoy but still undershot 2.8% yoy forecast. Headline inflation remained comfortably within the RBNZ’s target range of 1-3%. Tradeables inflation climbed sharply to 1.2% yoy from 0.3% yoy. Non-tradeables eased to 3.7% yoy from 4.0% yoy, indicating moderating domestic pressures.
The quarterly print showed notable increases in cultural services (+9.5% qoq), electricity (+4.9% qoq), and vegetables (+10.0% qoq), which together accounted for over 70% of the total quarterly CPI rise. However, these gains were partially offset by a -4.8% qoq drop in petrol prices and -9.2% qoq decline in domestic accommodation services.
USD/JPY Mid-Day Outlook
Daily Pivots: (S1) 148.39; (P) 148.64; (R1) 149.08; More...
USD/JPY dips lower today as consolidations continues below 149.17. Intraday bias stays neutral and further rally is expected as long as 55 D EMA (now at 145.86) holds. On the upside, break of 149.17 will target 100% projection of 139.87 to 148.64 from 142.66 at 151.43. That is close to 61.8% retracement of 158.86 to 139.87 at 151.22.
In the bigger picture, price actions from 161.94 (2024 high) are seen as a corrective pattern to rise from 102.58 (2021 low). There is no clear sign that the pattern has completed yet. But still, strong support is expected from 38.2% retracement of 102.58 to 161.94 at 139.26 to bring rebound.
Altcoins Have Taken the Initiative
Market Overview
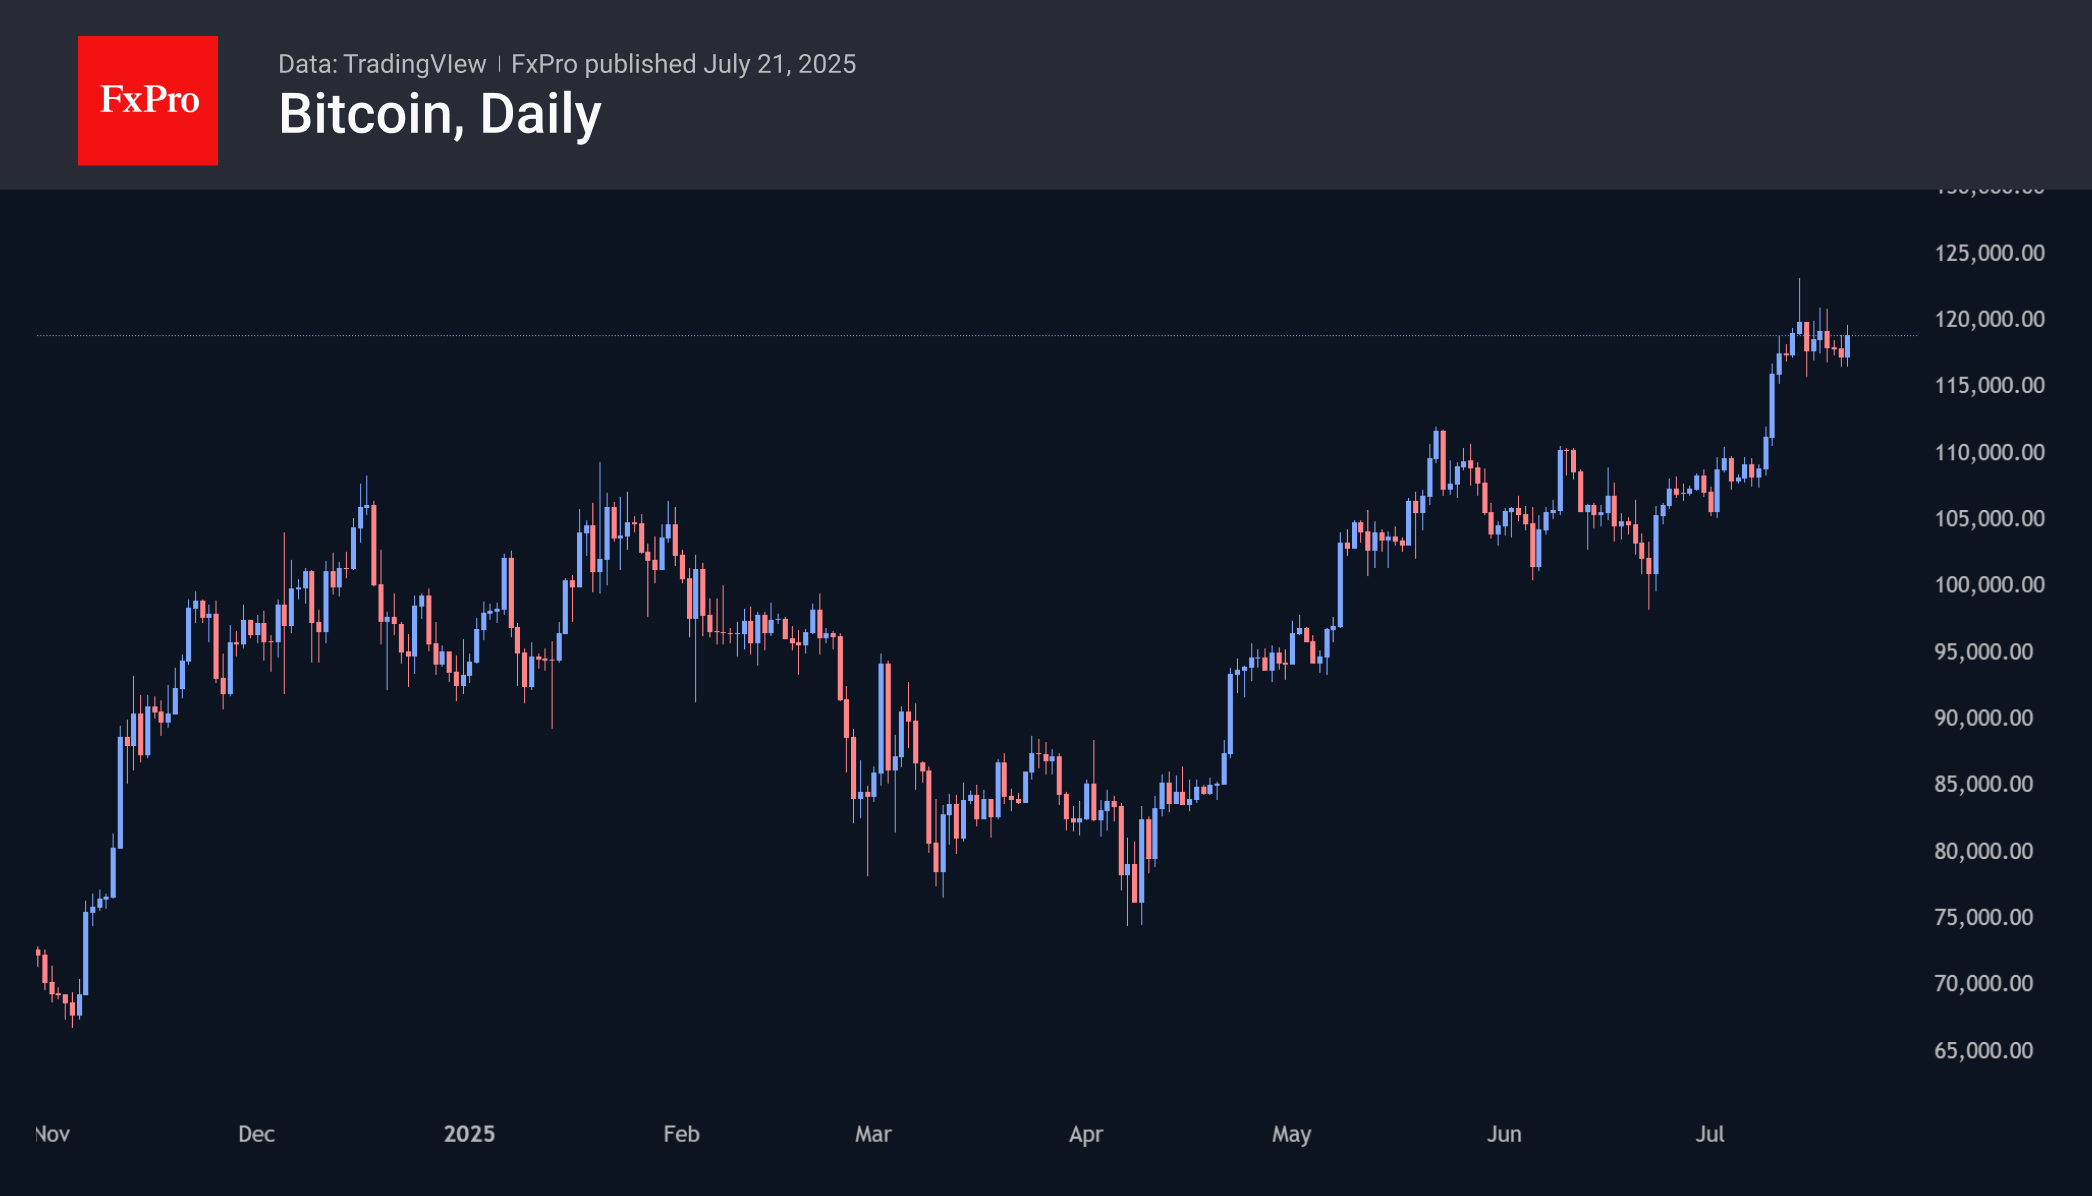
The crypto market cap is once again approaching 4 trillion, currently standing at $3.96 trillion. The market returned to growth after Friday’s jump and rapid correction. Unlike in previous months, the main driver is the rise in altcoin prices, rather than the first cryptocurrency. This is an important indicator of buyer confidence. However, demand is currently focused on proven names such as Dogecoin (+33% in 7 days), Litecoin and Ethereum (both +25%) and XRP (+20%).
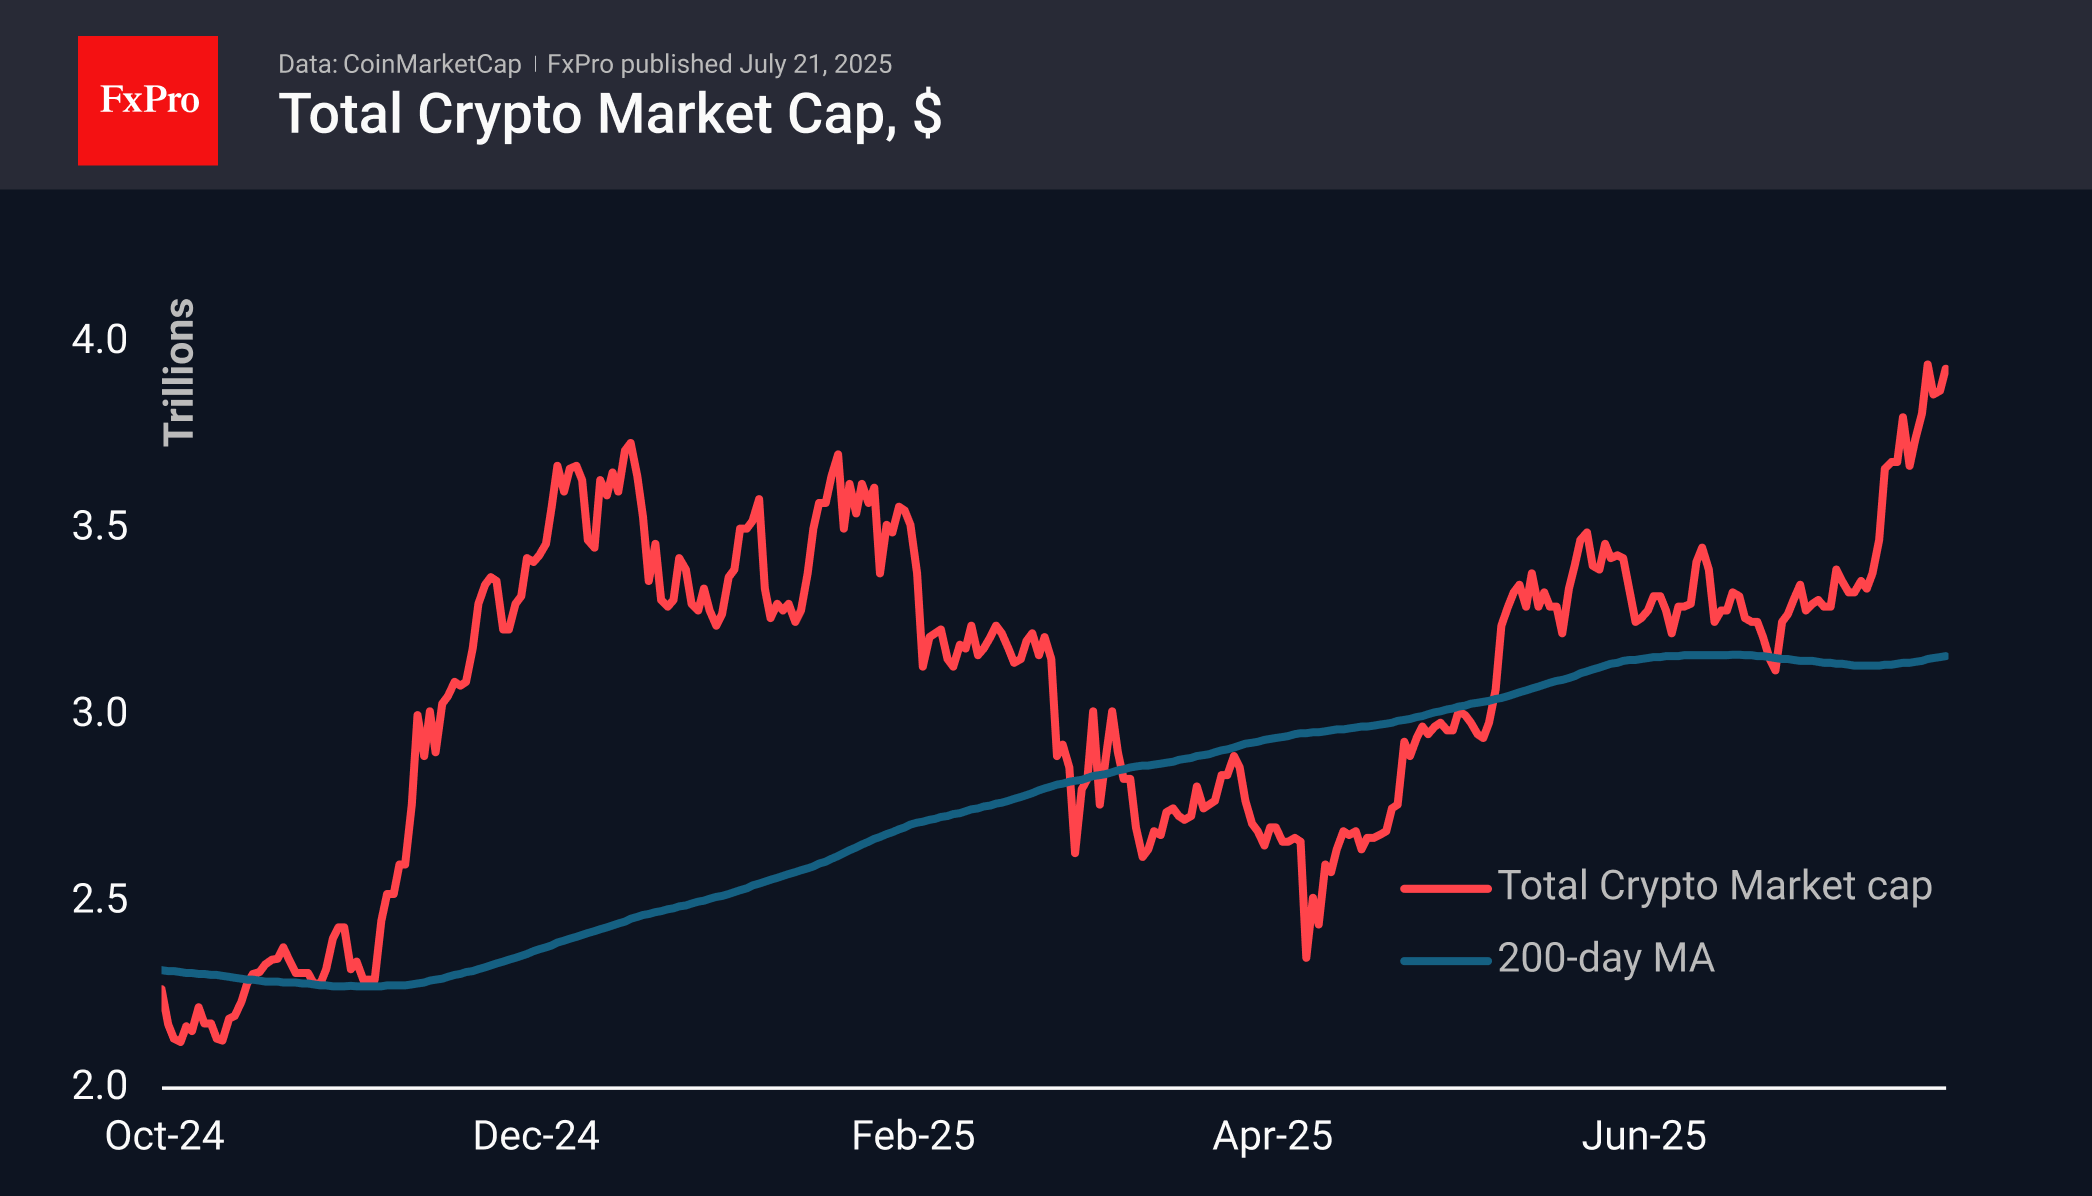
Bitcoin has not been able to maintain its growth over the past week, consolidating around $118K after updating its historical highs. At such moments, enthusiasts carefully reduce their positions in BTC, increasing them in altcoins. Bitcoin has been gaining its share for almost three years, bringing it to almost two-thirds of the market. This is only slightly below the 70% range, which served as a kind of ceiling in 2019–2021.
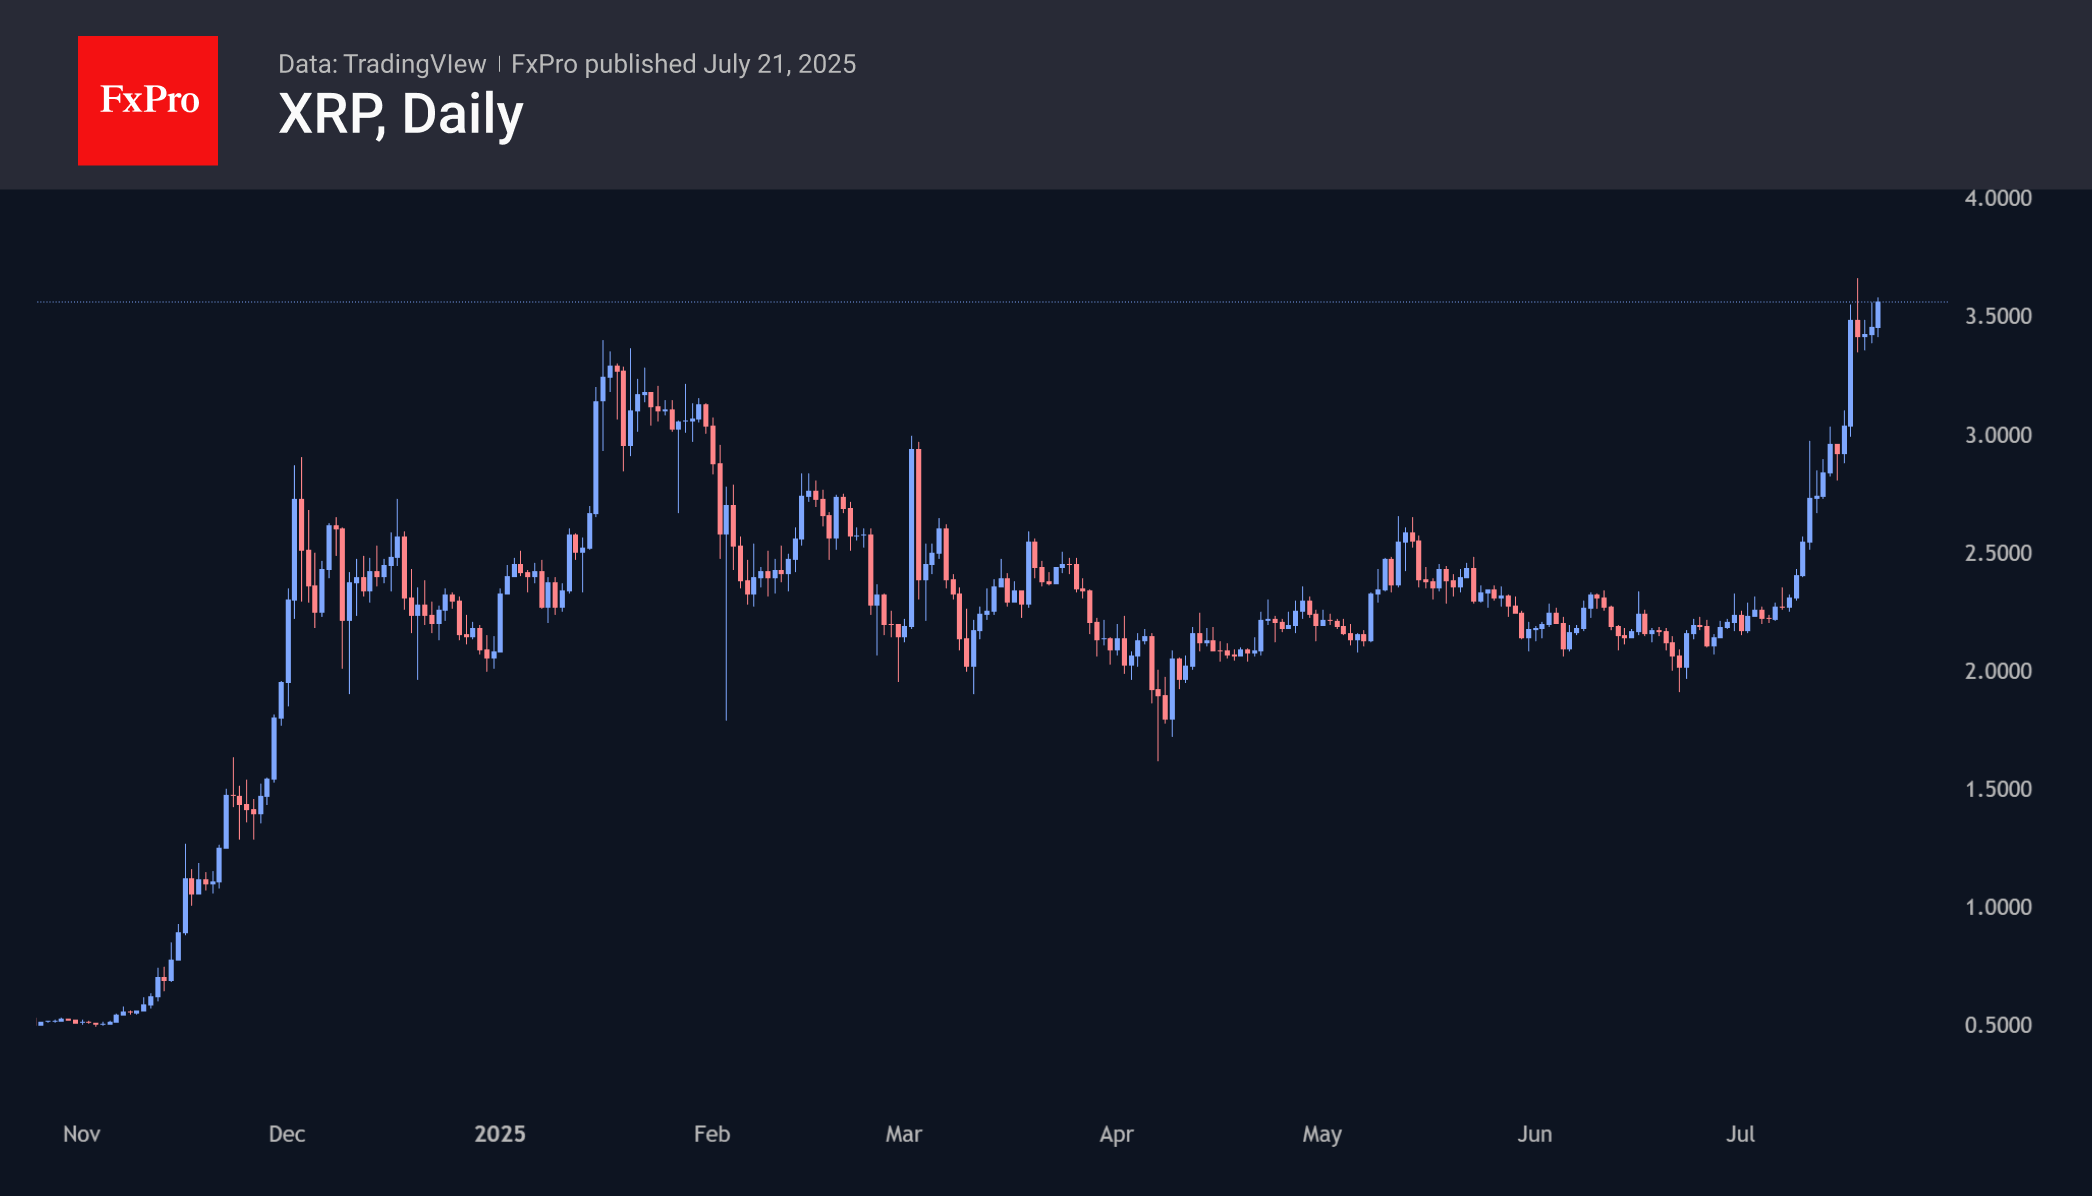
XRP set a new all-time high above $3.66, the previous one having held for more than seven years. Since Trump’s victory in the US presidential election last November, XRP has risen by almost 600%. The frenzy was followed by a pullback to $3.35 over the weekend, close to previous peaks. Still, the price is recording its sixth consecutive daily gain, trading above $3.5, indicating a solid breakout to a new price level.
News Background
Weekly inflows into spot Bitcoin ETFs in the US have declined slightly but remain near 8-week highs; positive dynamics have been observed in 12 of the last 14 weeks. According to SoSoValue, net inflows into spot BTC ETFs over the past week amounted to $2.39 billion, totalling $54.75 billion since the approval of Bitcoin ETFs in January 2024.
Weekly inflows into spot Ethereum ETFs in the US jumped to $2.18 billion, setting record highs for the second week in a row. Total net inflows since the ETF’s launch in July 2024 have grown to $7.49 billion.
The inflow of capital into Ethereum could have intensified against the background of BlackRock’s application to the SEC to add a staking feature to its ETH ETF. Several other providers have submitted applications with similar options. According to Bloomberg, the deadline for reviewing early applications is the end of October.
Mining company BitMine Immersion Technologies has become the largest public holder of Ethereum with a balance of 300,657 ETH worth over $1 billion. The accumulation of Ethereum began at the end of June. BitMine stated its goal is to acquire and stake 5% of the total ETH supply.
XAU/USD: Gold Rises on Weaker Dollar
Gold price rose on Monday and moved to the upper part of near-term range ($3320/$3377) after another attack at the top of rising daily cloud was rejected last Thursday.
Rising daily cloud continues to underpin the action since January and proved to be very strong support after it contained several attack of consolidative /corrective phase under new record high ($3500).
Weaker dollar was mainly behind today’s advance, though safe-haven demand remains fueled by growing uncertainty over US tariffs, as President Trump’s Aug 1 deadline approaches and a number of countries (including EU, Japan) haven’t reached an agreement that keeps alive threats of 30% taxes to be imposed on all imports from these two countries.
On the other hand, traders also keep an eye on comments from Fed officials as the FOMC meets next week, to get more hints about the central bank’s next steps.
The Fed policymakers announced earlier that they will keep interest rates on hold as inflation unexpectedly rose in June and is likely to be boosted further by the consequences of new US import tariffs that is directly confronting Trump’s demands to reduce US interest rates to 1%, to attract investments and boost economic growth.
Fresh advance cracked the upper borderline of smaller triangle on daily chart ($3365) which guards next significant barriers at $3373/77 (Fibo 76.4% of $3452/$3246 / July 16 spike high – recent range tops) violation of which to generate bullish signal and expose targets at $3400/03 (psychological / Fibo 76.4%).
Conversely, repeated failure at tringle upper trendline would keep the price in extended but narrowing range.
Res: 3373; 3377; 3388; 3400.
Sup: 3350; 3330; 3320; 3315.
Nasdaq 100: Market Optimism Builds Ahead of Big Tech Earnings
The earnings season is gaining momentum. This week, major technology companies such as Alphabet (GOOGL) and Tesla (TSLA) are scheduled to release their quarterly results.
Given that 85% of the 53 S&P 500 companies that have already reported have exceeded analysts’ expectations, it is reasonable to assume that market participants are also anticipating strong results from the big tech names. The Nasdaq 100 index (US Tech 100 mini on FXOpen) set an all-time high last week — a level that may be surpassed (potentially more than once) before the end of August.
Technical Analysis of the Nasdaq 100 Chart (US Tech 100 mini on FXOpen)
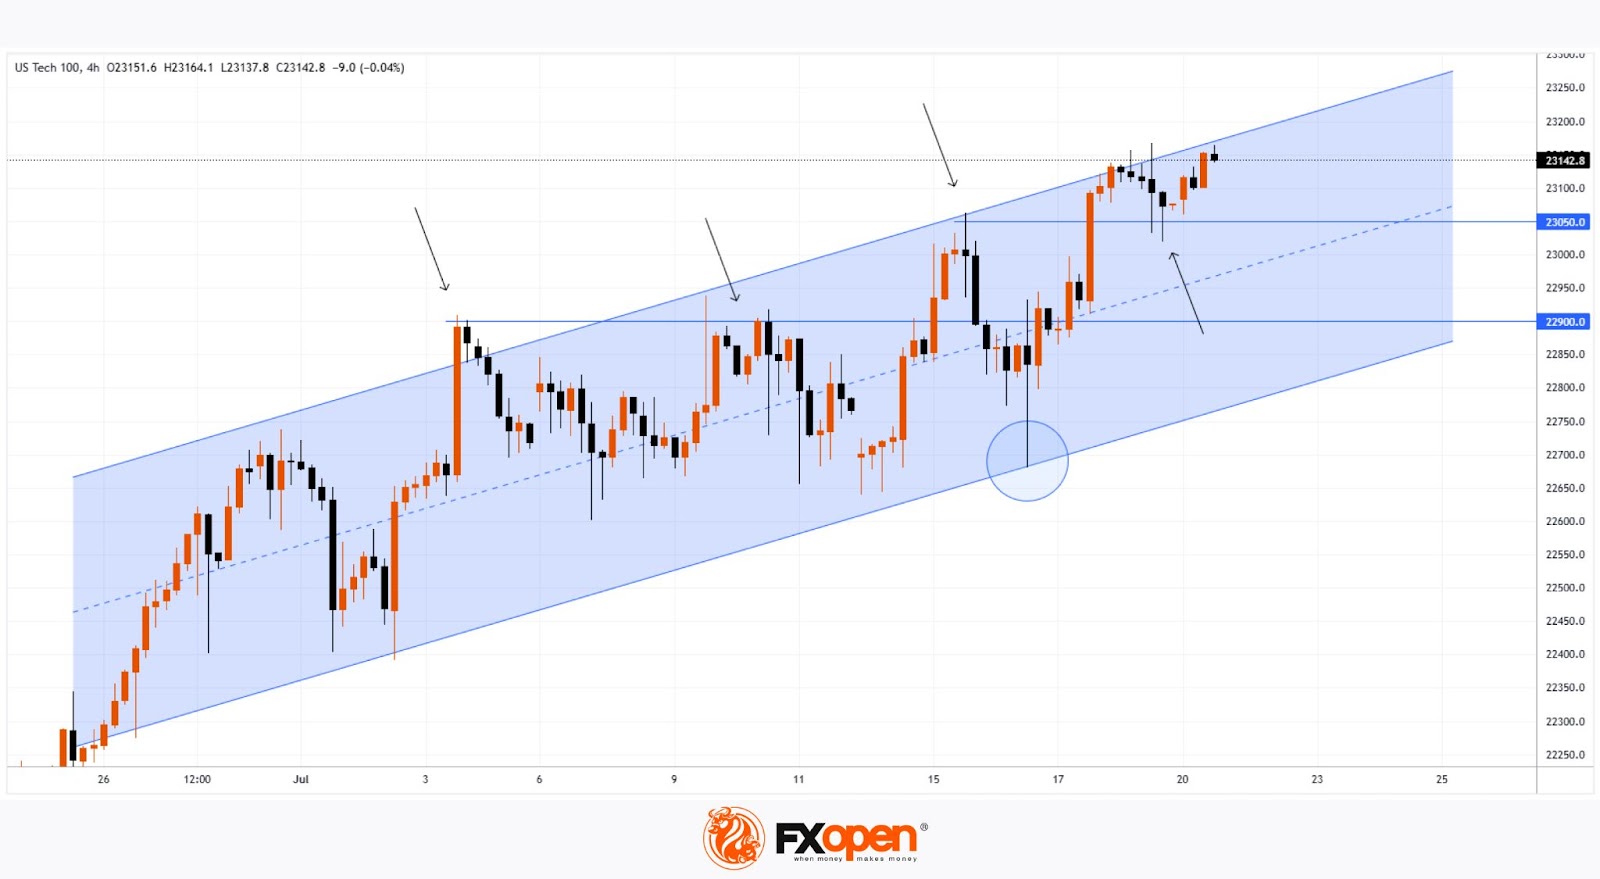
Price movements have formed an upward channel (marked in blue), with the following dynamics observed:
→ The bearish signals we highlighted on 7 July did not result in any significant correction. This may be interpreted as a sign of a strong market, as bearish momentum failed to materialise despite favourable technical conditions.
→ Buyers have shown initiative by gaining control at higher price levels (as indicated by the arrows): the resistance at 22,900 has been invalidated, while the 23,050 level has flipped to become support.
→ A long lower shadow near the bottom boundary of the channel (circled on the chart) underscores aggressive buying activity.
Should the earnings and forward guidance from major tech firms also come in strong, this could further reinforce the sustainable bullish trend in the US equity market.
Trade global index CFDs with zero commission and tight spreads. Open your FXOpen account now or learn more about trading index CFDs with FXOpen.
This article represents the opinion of the Companies operating under the FXOpen brand only. It is not to be construed as an offer, solicitation, or recommendation with respect to products and services provided by the Companies operating under the FXOpen brand, nor is it to be considered financial advice.
Gold Starts the Week on the Upside as Investors Weigh Trump’s Tariff Threat
The price of gold climbed to $3,350 per troy ounce on Monday, marking its second consecutive session of gains amid growing investor unease over Donald Trump’s proposed tariff policies.
US Commerce Secretary Howard Lutnick stated that 1 August would serve as a strict deadline for implementing so-called ‘mirror duties’, though negotiations could extend beyond that date. He indicated that a base tariff of 10% might apply to smaller trading partners.
Earlier in July, Trump notified more than twenty trading partners of new tariff rates, with some items facing levies as high as 40%.
However, last week’s robust US economic data has tempered expectations of an imminent Federal Reserve rate cut, thereby capping gold’s upside potential for now.
Investors are now focused on upcoming speeches from Fed Chair Jerome Powell and Governor Michelle Bowman, seeking fresh signals on the future direction of monetary policy.
Technical Analysis: XAU/USD
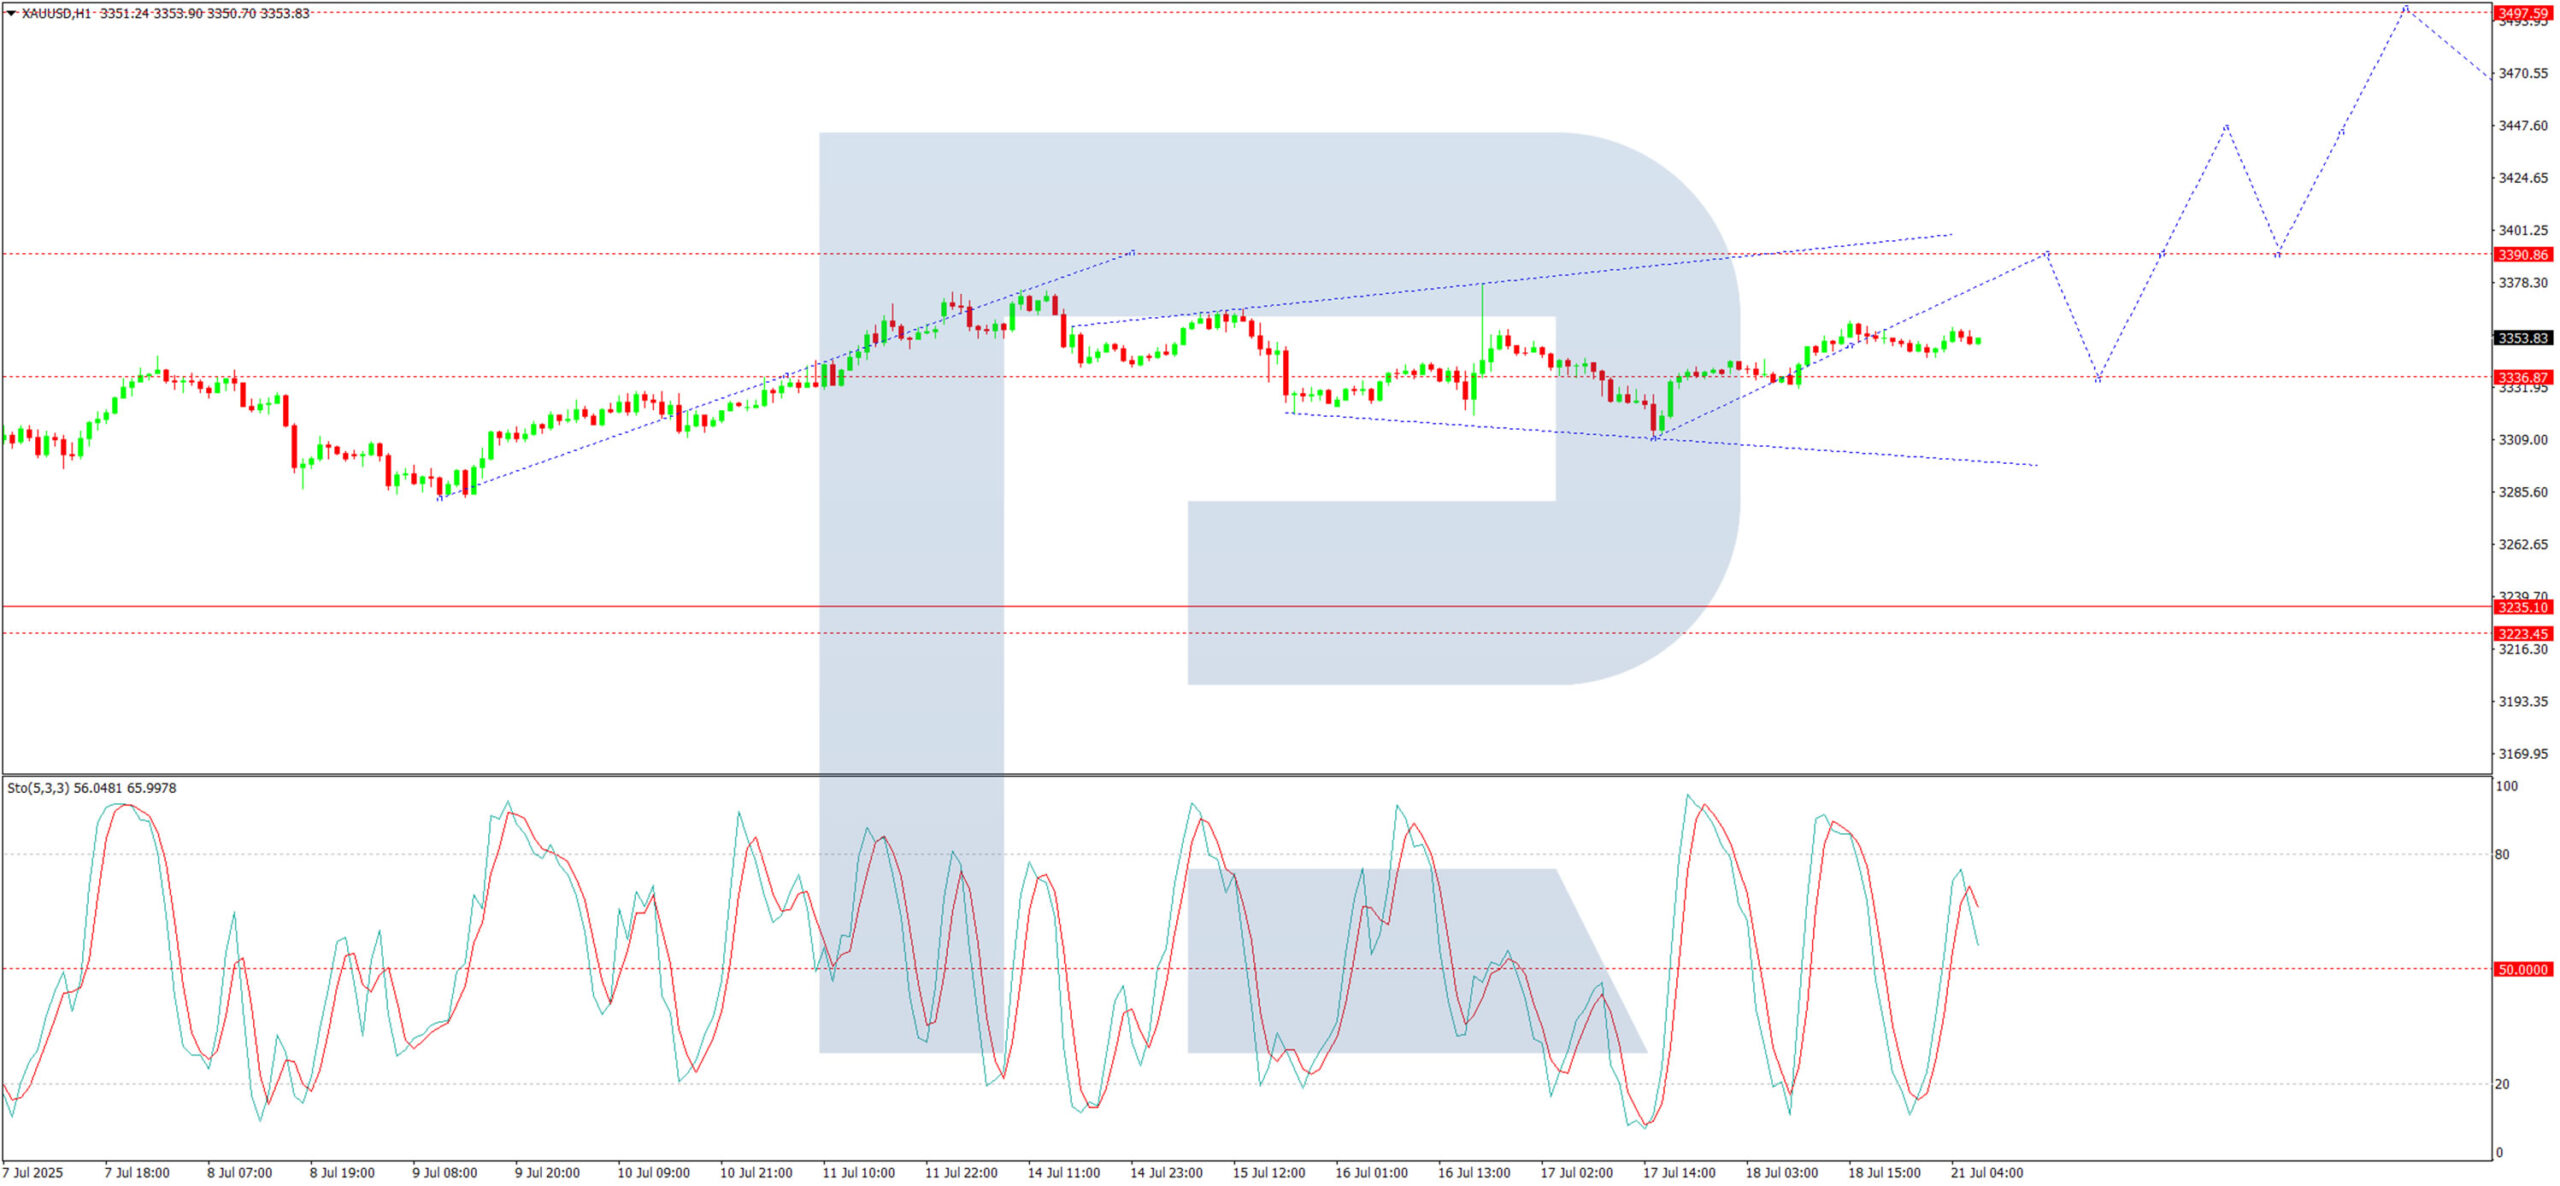
H4 Chart:
On the H4 chart, XAU/USD is continuing its upward movement towards $3,384. Today, we anticipate the pair will reach this level before undergoing a corrective pullback to $3,333. The market is effectively forming a broad consolidation range around $3,344.
A breakout above this range could extend gains toward $3,494. Conversely, a downside breach may trigger a decline toward $3,235. This scenario is technically supported by the MACD indicator, with its signal line above zero and pointing firmly upwards.
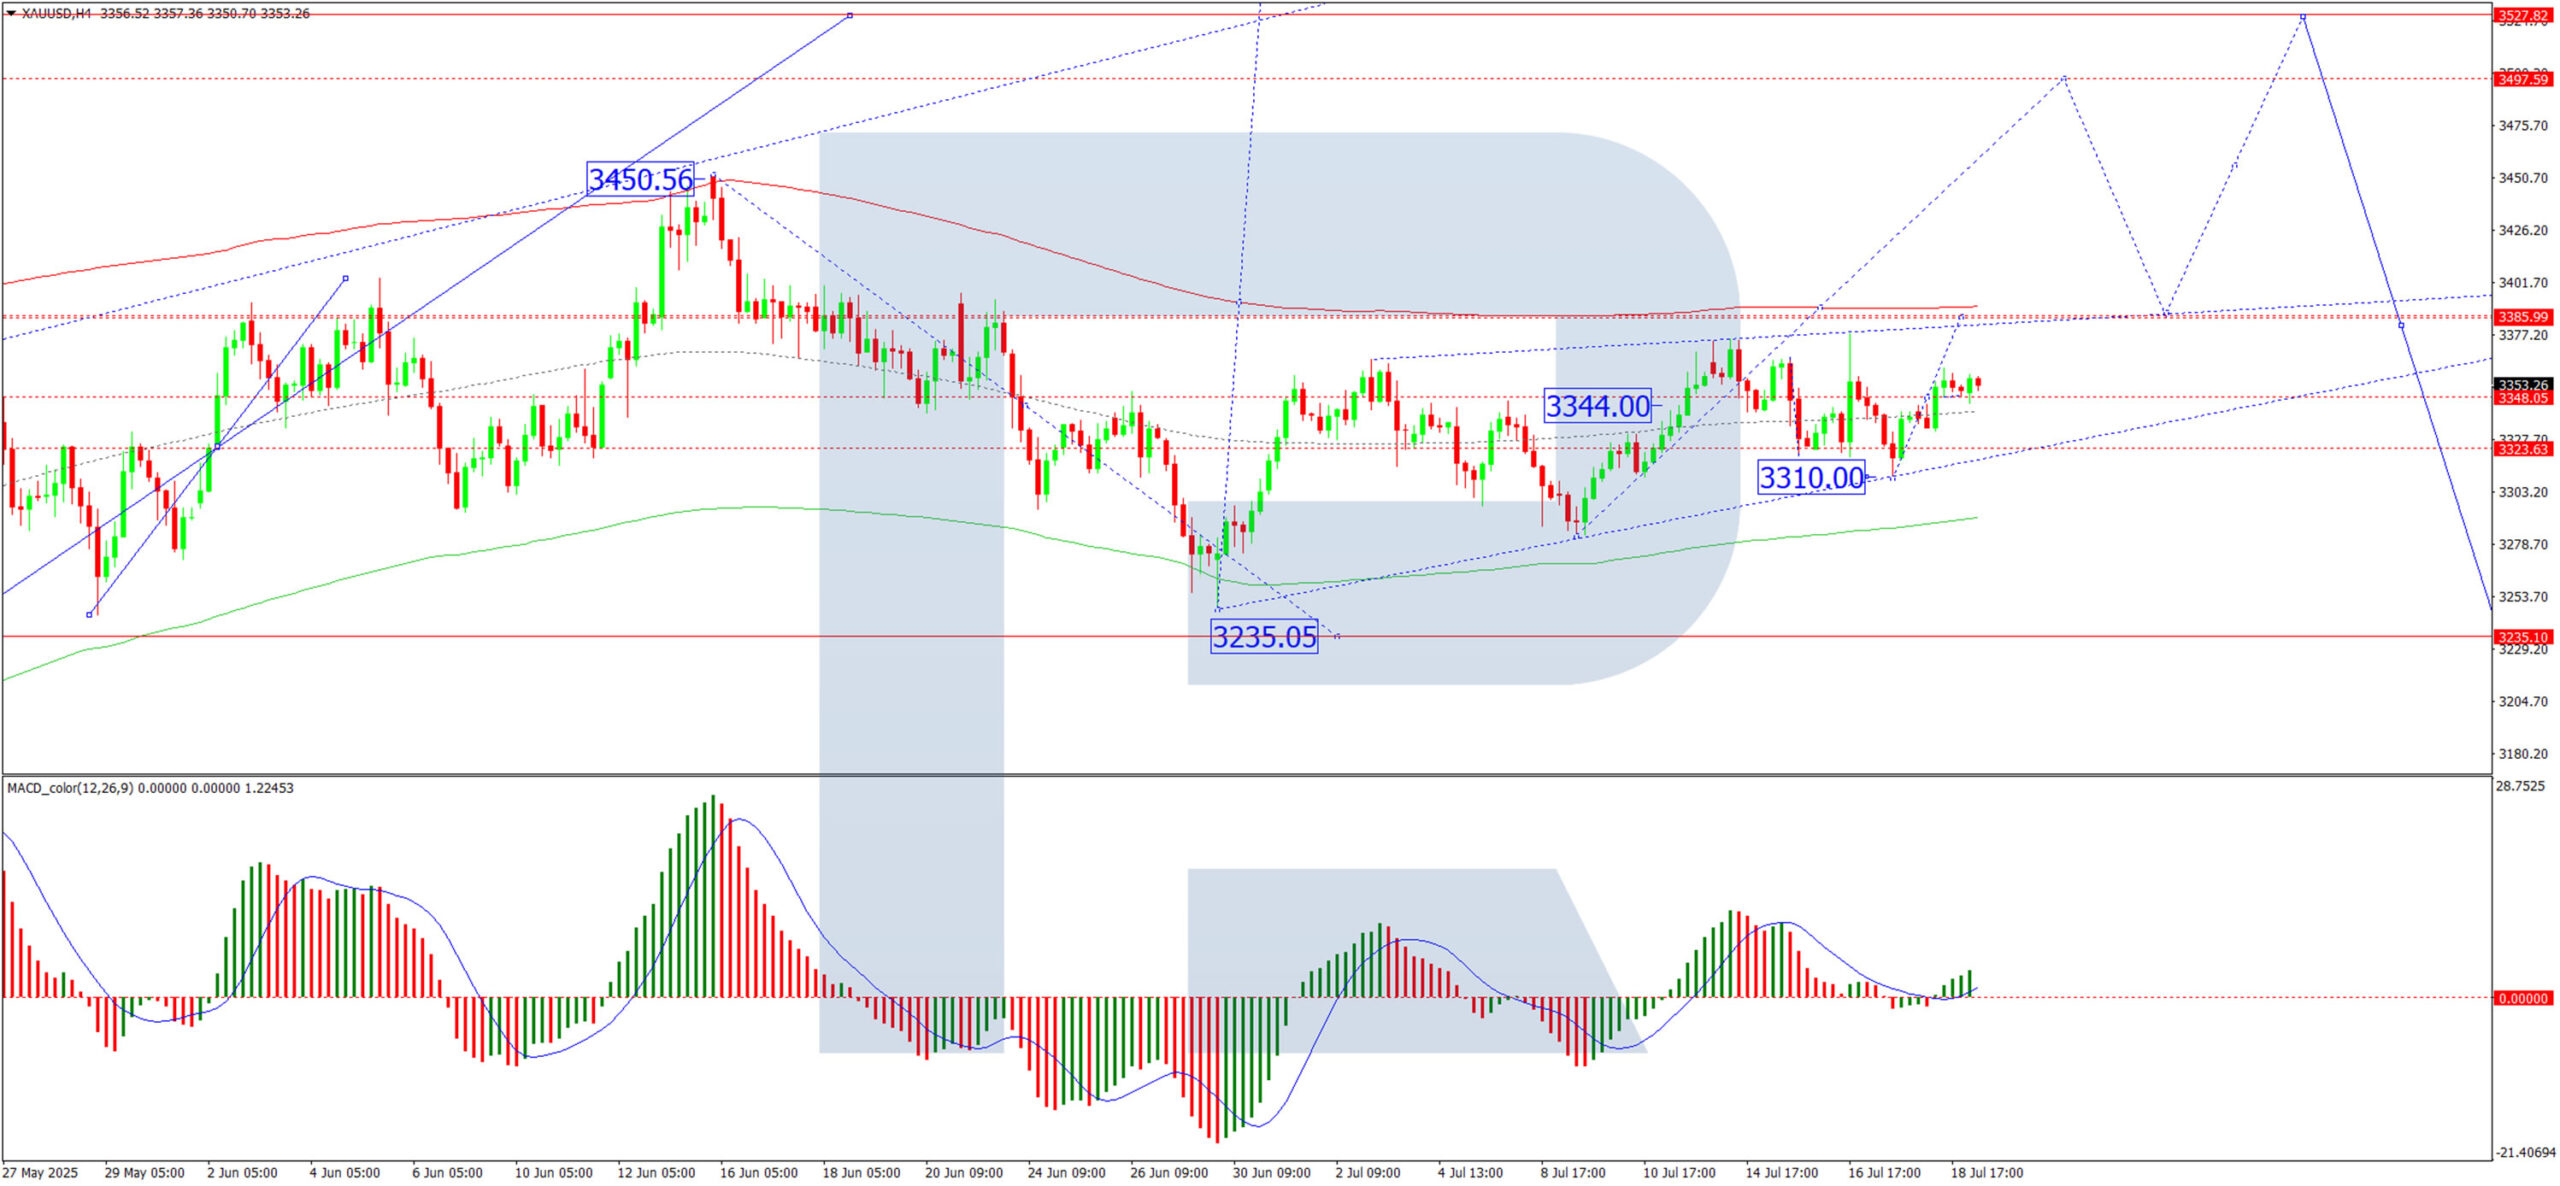
H1 Chart:
On the H1 chart, XAU/USD is consolidating around $3,333, having briefly declined to $3,310. The current structure suggests a fresh upward wave towards at least $3,390, followed by a retest of $3,333 from above. The Stochastic oscillator supports this scenario, with its signal line above 50 and rising towards 80.
Conclusion
Gold remains bullish in the short term, driven by tariff-related uncertainty, though expectations regarding Fed policy may limit further gains. Traders should monitor key resistance at $3,384 and support at $3,333 for directional cues.
ECB SAFE survey: Firms see slower inflation, trade shocks reorder priorities
The ECB’s latest SAFE (Survey on the Access to Finance of Enterprises) report showed that Eurozone firms have revised down their short-term inflation expectations while maintaining a cautious view on long-term price pressures. The median forecast for inflation one year ahead dropped to 2.5% from 2.9%. Expectations for three- and five-year horizons remained steady at 3.0%.
When asked about risks to five-year inflation, 52% of firms still viewed them as skewed to the upside, though that figure declined slightly from 55%. The share of firms seeing balanced risks increased to 33%, while those perceiving downside risks remained unchanged at 14%.
This round also included ad hoc questions about the impact of rising trade tensions, particularly recent US tariff announcements. The survey revealed uneven exposure across firms, with exporters to the US and manufacturing companies facing the greatest challenges. About 30% of respondents reported concerns over supply chain disruptions, including delays and shortages.
In response, many businesses are already pivoting. Firms cited plans to reorient sales toward domestic and EU markets and restructure supply chains to reduce dependency on vulnerable links.
Full ECB Survey on the Access to Finance of Enterprise here.
Japan’s Coalition Loses Majority, Yen Higher
The Japanese yen has started the week with strong gains. In the European session, USD/JPY is trading at 147.71, down 0.73% on the day.
Japanese PM on shaky ground after election drubbing
Japanese Prime Minister Ishiba's ruling coalition failed to win a majority in the election for the upper house of parliament on Sunday. The result is a humiliating blow to Ishiba, as the government lost its majority in the lower house in October.
The stinging defeat could be the end of the road for Ishiba. The Prime Minister has declared he will remain in office, but there is bound to be pressure from within the coalition for Ishiba to resign.
The election result was not a surprise, as voters were expected to punish the government at the ballot box due to the high cost of food and falling incomes. The price of rice, a staple food, has soared 100% in a year, causing a full-blown crisis for the government, which has resorted to selling stockpiled rice from national reserves to the public.
The election has greatly weakened Ishiba's standing, which is bad news as Japan is locked in intense trade talks with the US. President Trump has warned that he will impose 25% tariffs on Japanese goods if a deal isn't reached by August 1. Japan is particularly concerned about its automobile industry, the driver of its export-reliant economy.
Bank of Japan expected to stay pat
The Bank of Japan meets on July 31 and is widely expected to continue its wait-and-see stance on rate policy. The BoJ has been an outlier among major central banks as it looks to normalize policy and raise interest rates. However, with the economic turbulence and uncertainty due to President Trump's erratic tariff policy, the Bank has stayed on the sidelines and hasn't raised rates since January. Japan releases Tokyo Core CPI on Friday, the last tier-1 event before the rate meeting.
USD/JPY Technical
- There is resistance at 148.39 and 149.08
- 147.95 and 147.70 are the next support levels
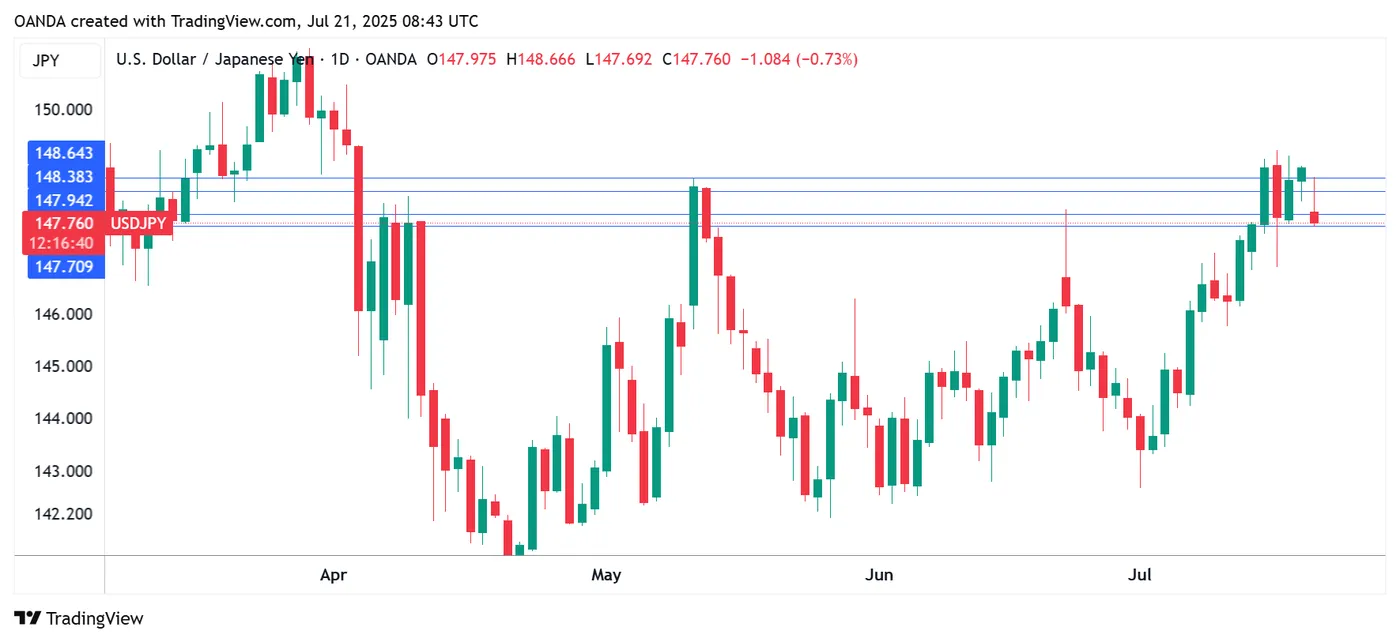
USDJPY 1-Day Chart, July 21, 2025
ETH/USD Rate Surges Over 50% Since Early July
Back in May, we reported that the Ethereum network had successfully undergone a major upgrade named Pectra, which triggered a surge in demand for Ethereum and a confident upward movement in the ETH/USD rate (indicated by the arrow on the chart).
At the time, we also suggested that the $1,800 to $2,300 range could be considered a broad bullish Fair Value Gap, meaning it could act as a support zone for ETH/USD in the event of a pullback.
Indeed, the price did retreat into the $1,800–$2,300 zone, with the B→C correction forming a textbook 50% retracement of the A→B impulse. After a brief consolidation, the upward trend resumed. Bullish sentiment was further supported by regulatory improvements in the US, particularly the passing of legislation on stablecoins, which fostered a more favourable environment for the development of new projects on the Ethereum blockchain.
These and other fundamental drivers contributed to a more than 50% increase in ETH/USD throughout July.
Technical Analysis of the ETH/USD Chart
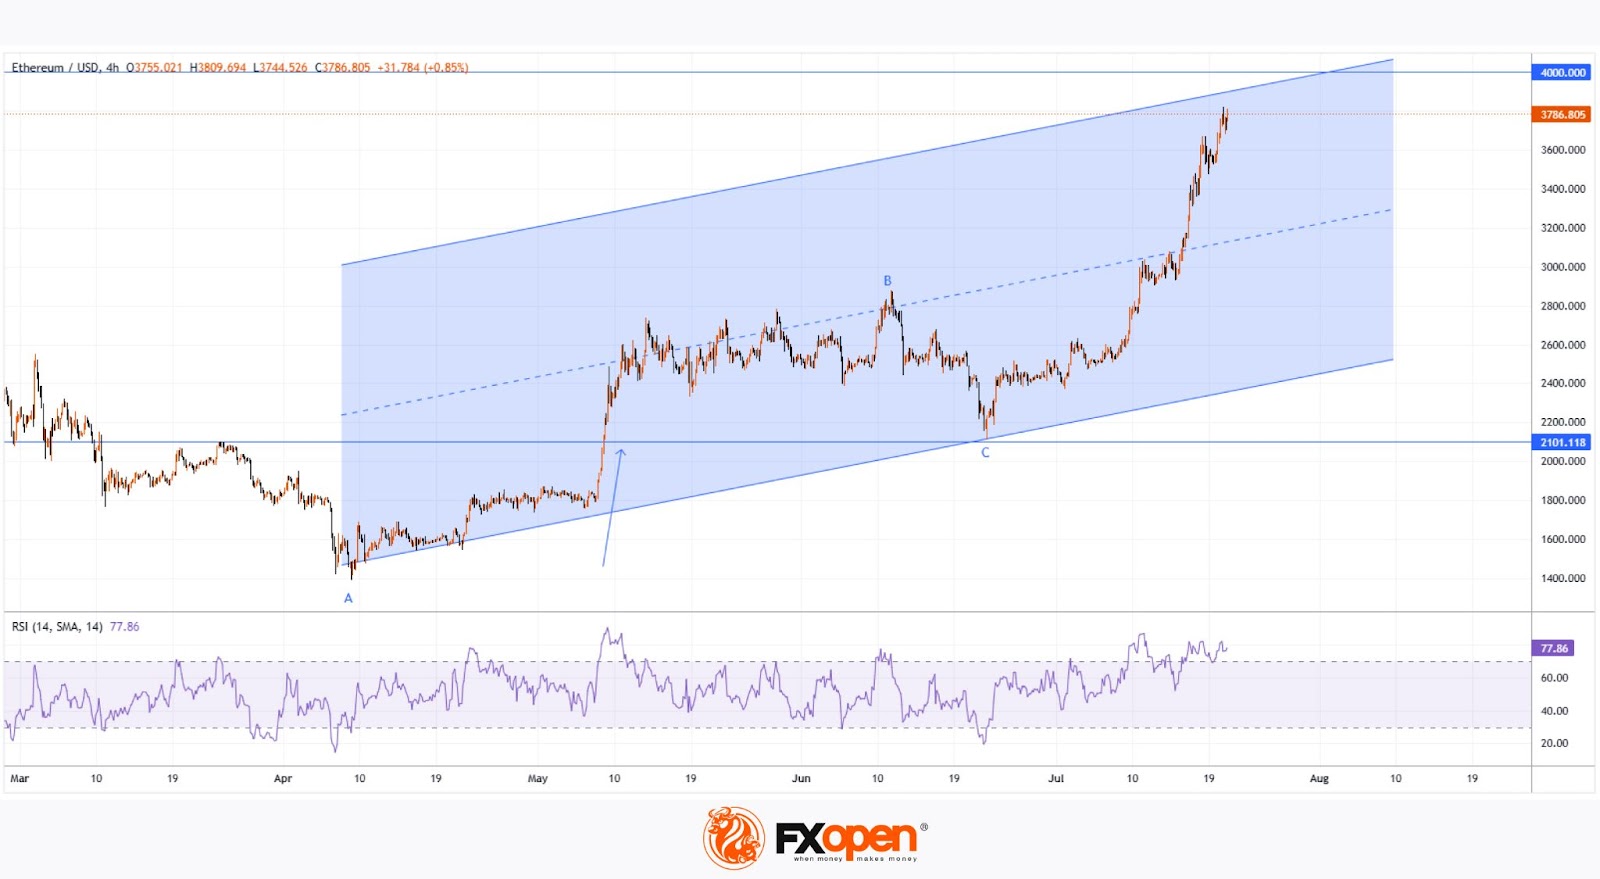
Since April, ETH/USD price movements have been forming an ascending channel (highlighted in blue), with the price entering the upper half of the channel by mid-July. This move was accompanied by the formation of new highs without significant pullbacks—an indication of strong demand.
Given the inherent inertia of financial markets, it is difficult to imagine a sharp reversal from a bullish to a bearish trend. However, there are reasons to believe that the steep upward movement in ETH’s price may slow in the near term:
→ the price is approaching the upper boundary of the channel, which typically acts as resistance;
→ the RSI indicator has remained in overbought territory for several days;
→ the psychologically significant $4,000 level may also act as resistance, as it has on previous occasions (e.g., in December 2024).
FXOpen offers the world's most popular cryptocurrency CFDs*, including Bitcoin and Ethereum. Floating spreads, 1:2 leverage — at your service. Open your trading account now or learn more about crypto CFD trading with FXOpen.
*Important: At FXOpen UK, Cryptocurrency trading via CFDs is only available to our Professional clients. They are not available for trading by Retail clients. To find out more information about how this may affect you, please get in touch with our team.
This article represents the opinion of the Companies operating under the FXOpen brand only. It is not to be construed as an offer, solicitation, or recommendation with respect to products and services provided by the Companies operating under the FXOpen brand, nor is it to be considered financial advice.
GBP/USD Dips Further While USD/CAD Consolidates Gains
GBP/USD started a downside correction from the 1.3620 zone. USD/CAD declined and now consolidates below the 1.3750 level.
Important Takeaways for GBP/USD and USD/CAD Analysis Today
- The British Pound started a fresh decline and settled below the 1.3500 zone.
- There is a connecting bullish trend line forming with support at 1.3415 on the hourly chart of GBP/USD at FXOpen.
- USD/CAD started a fresh decline after it failed to clear the 1.3775 resistance.
- There is a key bullish trend line forming with support at 1.3715 on the hourly chart at FXOpen.
GBP/USD Technical Analysis
On the hourly chart of GBP/USD at FXOpen, the pair struggled above the 1.3600 zone. The British Pound started a fresh decline below the 1.3550 pivot level against the US Dollar, as discussed in the previous analysis.
The pair dipped below the 1.3500 and 1.3450 levels. A low was formed at 1.3364 and the pair is now consolidating losses. On the upside, it is facing resistance near the 1.3475 level. The next key resistance is near 1.3490 and the 50% Fib retracement level of the downward move from the 1.3619 swing high to the 1.3364 low.
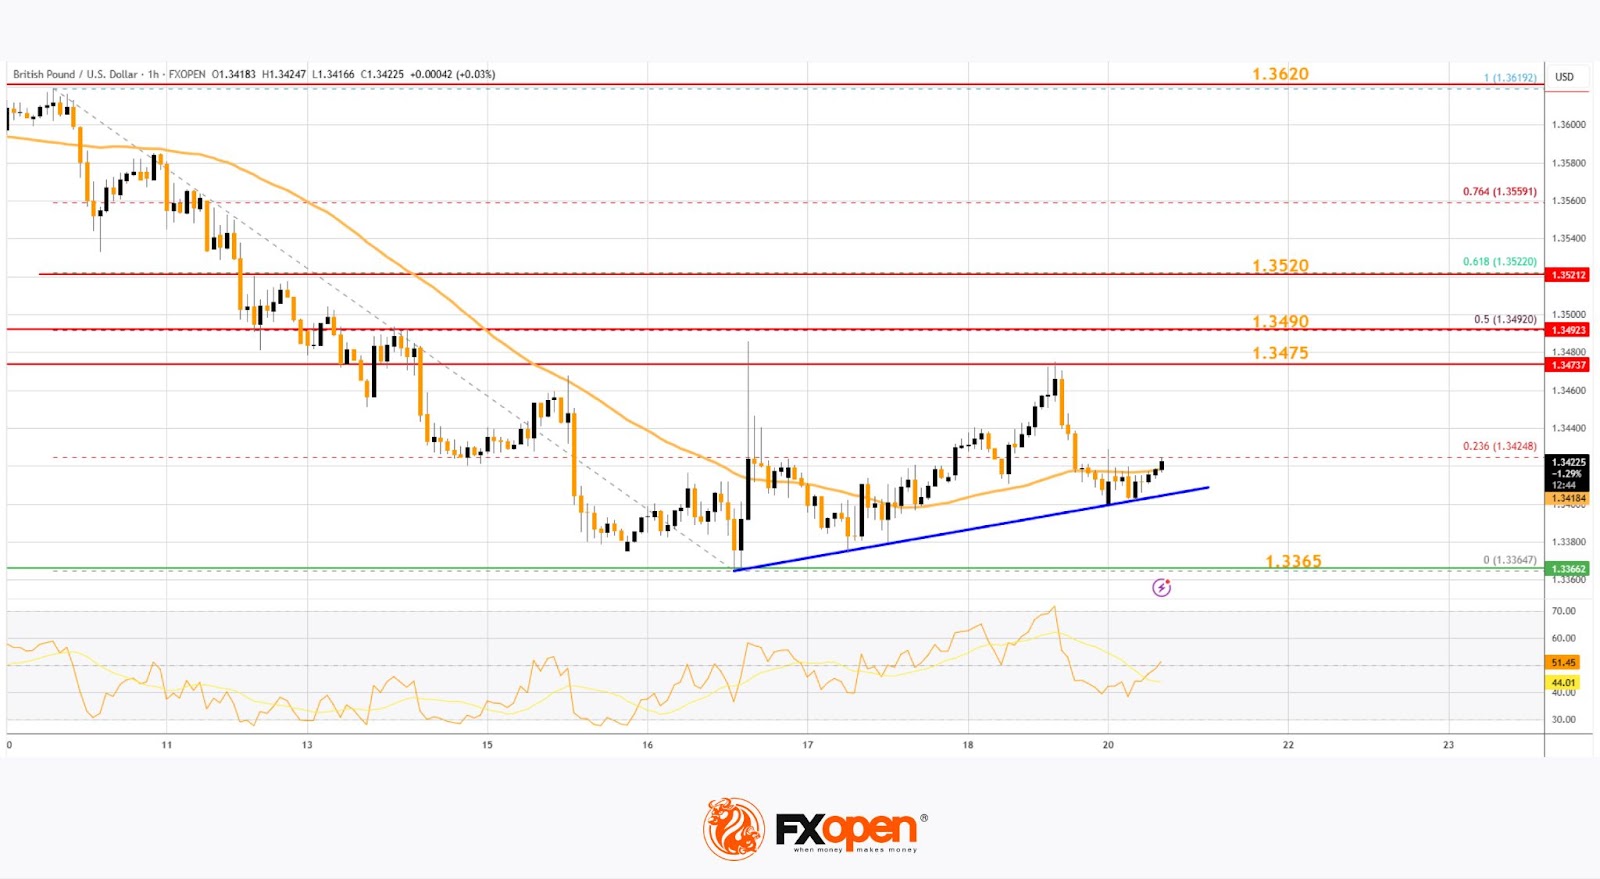
An upside break above the 1.3490 zone could send the pair toward 1.3520 and the 61.8% Fib retracement level.
More gains might open the doors for a test of 1.3620. If there is another decline, the pair could find support near the 1.3415 level and a connecting bullish trend line. The first major support sits near the 1.3365 zone.
The next major support is 1.3350. If there is a break below 1.3350, the pair could extend the decline. The next key support is near the 1.3320 level. Any more losses might call for a test of 1.3250.
USD/CAD Technical Analysis
On the hourly chart of USD/CAD at FXOpen, the pair climbed toward the 1.3775 resistance zone before the bears appeared. The US Dollar formed a swing high near 1.3774 and recently declined below the 1.3750 support against the Canadian Dollar.
There was also a close below the 50-hour simple moving average and 1.3735. The pair is now consolidating losses below the 50% Fib retracement level of the downward move from the 1.3774 swing high to the 1.3695 low. But the bulls are active near the 1.3700 level.
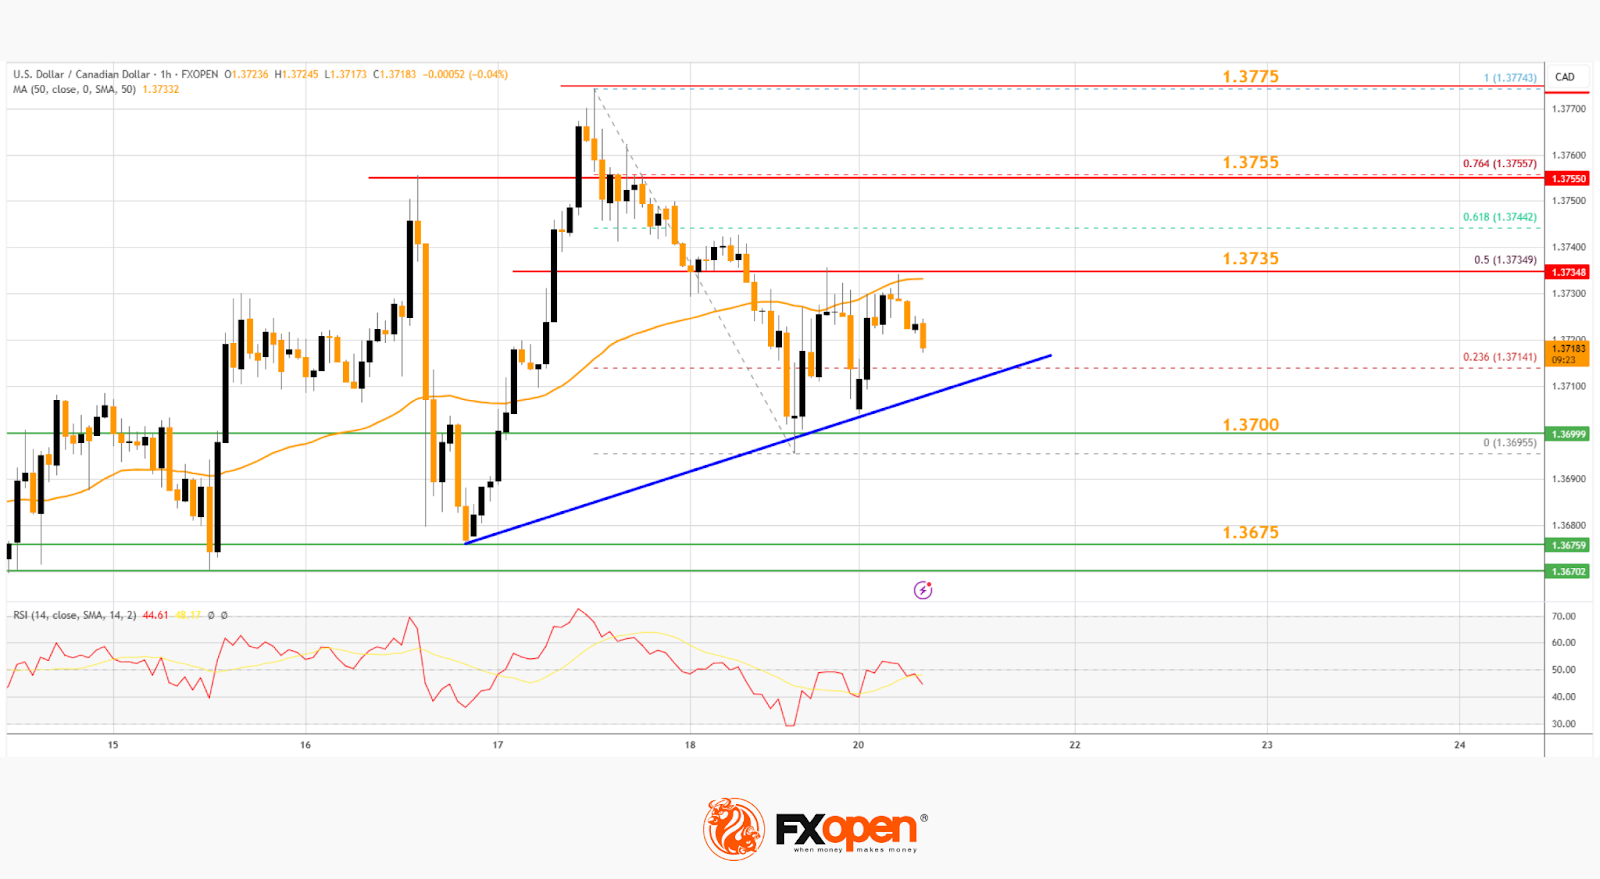
If there is a fresh increase, the pair could face resistance near the 1.3735 level. The next key resistance on the USD/CAD chart is near the 1.3755 level or the 61.8% Fib retracement level.
If there is an upside break above 1.3755, the pair could rise toward 1.3775. The next major resistance is near the 1.3800 zone, above which it could rise steadily toward 1.3880.
Immediate support is near the 1.3715 level and a key bullish trend line. The first major support is near 1.3675. A close below the 1.3675 level might trigger a strong decline. In the stated case, USD/CAD might test 1.3650. Any more losses may possibly open the doors for a drop toward the 1.3620 support.
This article represents the opinion of the Companies operating under the FXOpen brand only. It is not to be construed as an offer, solicitation, or recommendation with respect to products and services provided by the Companies operating under the FXOpen brand, nor is it to be considered financial advice.
Trade over 50 forex markets 24 hours a day with FXOpen. Take advantage of low commissions, deep liquidity, and spreads from 0.0 pips. Open your FXOpen account now or learn more about trading forex with FXOpen.
This article represents the opinion of the Companies operating under the FXOpen brand only. It is not to be construed as an offer, solicitation, or recommendation with respect to products and services provided by the Companies operating under the FXOpen brand, nor is it to be considered financial advice.