

Sample Category Title
EUR/CHF Daily Outlook
Daily Pivots: (S1) 0.9314; (P) 0.9324; (R1) 0.9343; More....
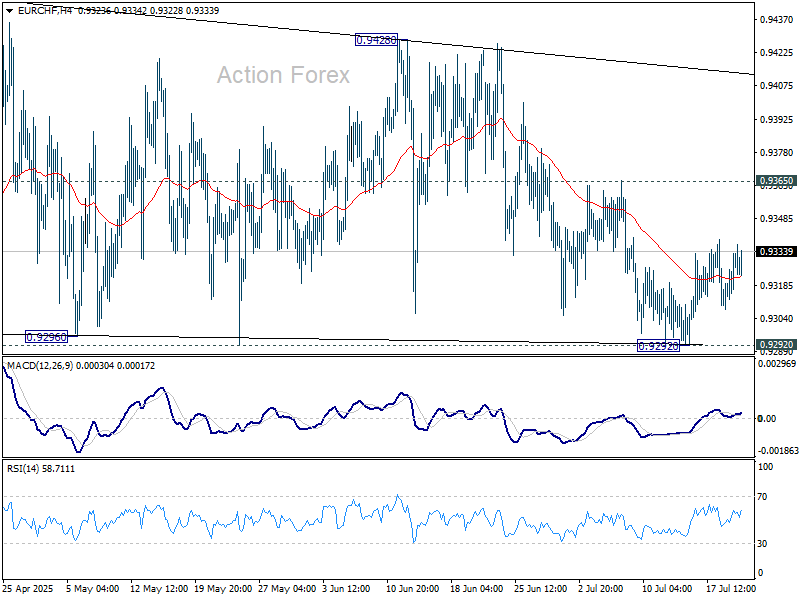
Intraday bias in EUR/CHF stays neutral at this point. On the upside, firm break of 0.9365 resistance will be the first sign that corrective pattern from 0.9445 has already completed. Further rise should then be seen to 0.9428/45 resistance zone. Firm break there will resume the rebound from 0.9218 low. However, firm break of 0.9292 will bring retest of 0.9218 instead.
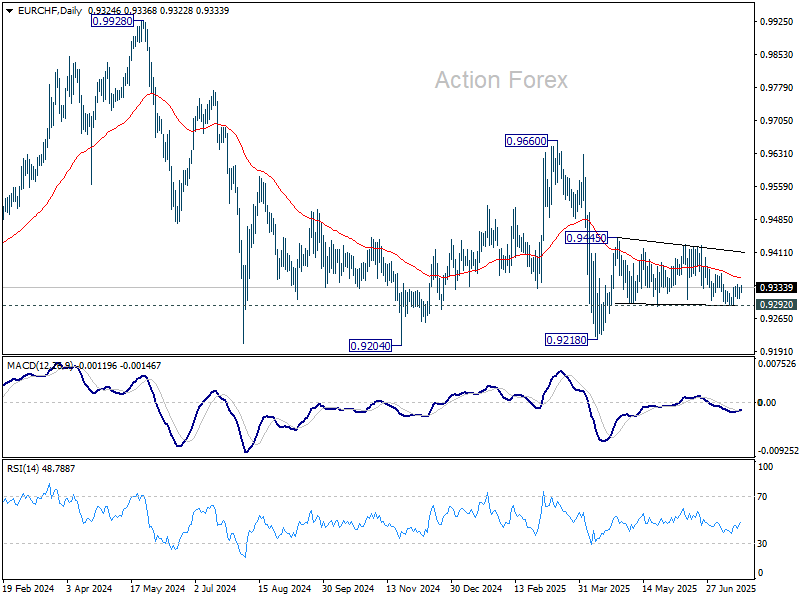
In the bigger picture, while downside momentum has been diminishing as seen in W MACD, there is no sign of bottoming yet. EUR/CHF is still staying below 55 W EMA (now at 0.9424) and well inside long term falling channel. Outlook will stay bearish as long as 0.9660 resistance holds. Break of 0.9204 (2024 low) will confirm resumption of down trend from 1.2004 (2018 high).
EUR/USD Daily Outlook
Daily Pivots: (S1) 1.1635; (P) 1.1676; (R1) 1.1737; More...
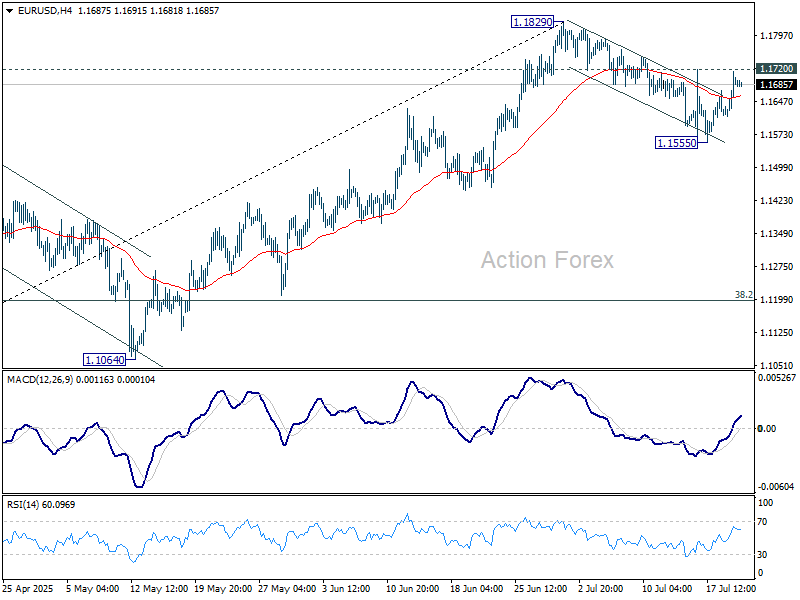
Intraday bias in EUR/USD remains neutral for the moment. On the upside, break of 1.1720 minor resistance will suggest that corrective pullback from 1.1829 has already completed at 1.1555. Intraday bias will be back on the upside for retesting 1.1829. On the downside, below 1.1555 will extend the correction towards 38.2% retracement of 1.0176 to 1.1829 at 1.1198.
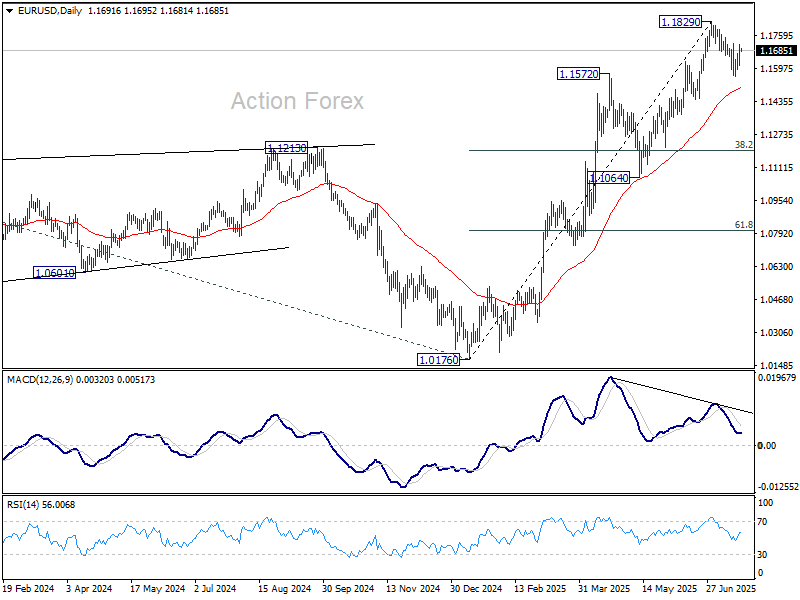
In the bigger picture, rise from 0.9534 long term bottom could be correcting the multi-decade downtrend or the start of a long term up trend. In either case, further rise should be seen to 100% projection of 0.9534 to 1.1274 from 1.0176 at 1.1916. This will remain the favored case as long as 1.1604 support holds.
USD/JPY Daily Outlook
Daily Pivots: (S1) 146.72; (P) 147.70; (R1) 148.31; More...
Intraday bias in USD/JPY remains neutral as consolidations continue below 149.17. Deeper pullback could be seen but further rally is expected as long as 55 D EMA (now at 145.91) holds. On the upside, break of 149.17 will target 100% projection of 139.87 to 148.64 from 142.66 at 151.43. That is close to 61.8% retracement of 158.86 to 139.87 at 151.22.
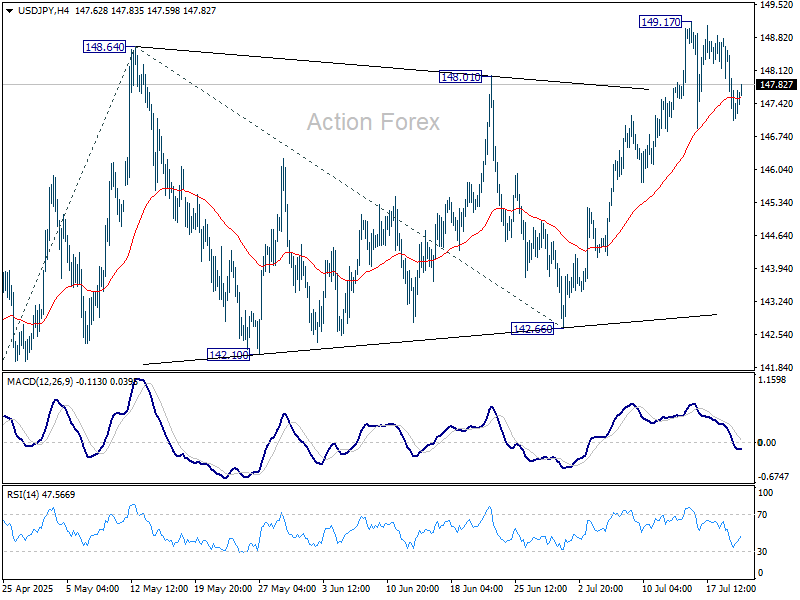
In the bigger picture, price actions from 161.94 (2024 high) are seen as a corrective pattern to rise from 102.58 (2021 low). There is no clear sign that the pattern has completed yet. But still, strong support is expected from 38.2% retracement of 102.58 to 161.94 at 139.26 to bring rebound.
GBP/USD Daily Outlook
Daily Pivots: (S1) 1.3426; (P) 1.3468; (R1) 1.3535; More...
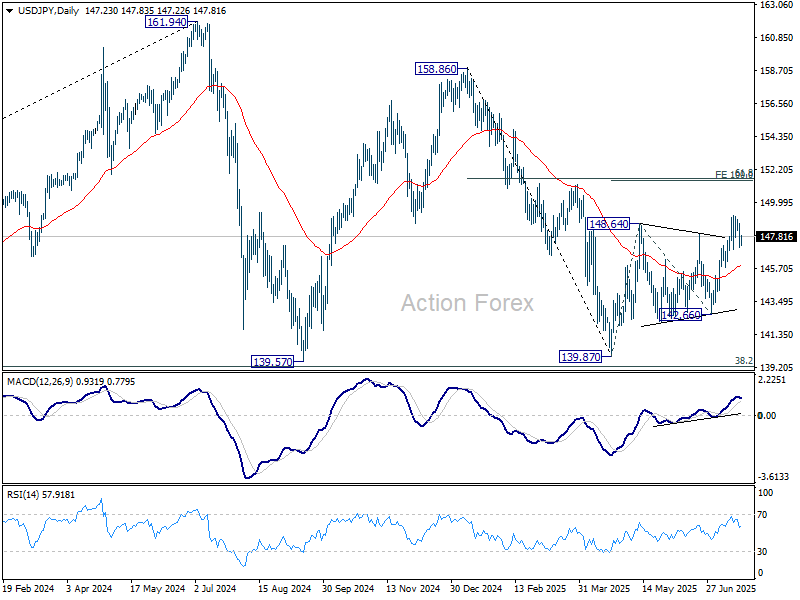
Intraday bias in GBP/USD remains neutral and outlook is unchanged. On the upside, firm break of 1.3561 support turned resistance will argue that correction from 1.3787 has already completed after hitting 1.3369 support. Intraday bias will be back on the upside for retesting 1.3787. Nevertheless, firm break of 1.3363/9 will bring deeper correction to 1.3138 cluster support (38.2% retracement of 1.2099 to 1.3787 at 1.3142).

In the bigger picture, up trend from 1.3051 (2022 low) is in progress. Next medium term target is 61.8% projection of 1.0351 to 1.3433 from 1.2099 at 1.4004. Outlook will now stay bullish as long as 55 W EMA (now at 1.3017) holds, even in case of deep pullback.
USD/CHF Daily Outlook
Daily Pivots: (S1) 0.7957; (P) 0.7990; (R1) 0.8014; More….
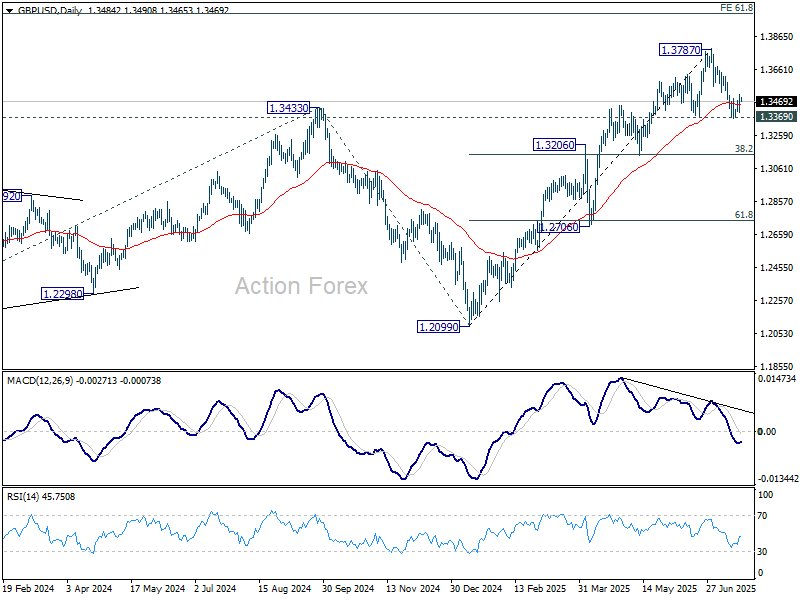
Intraday bias in USD/CHF remains neutral and outlook is unchanged. On the downside, break of 0.7946 support will argue that correction from 0.7871 has completed at 0.8063 after rejection by 0.8054 support turned resistance. Intraday bias will be back on the downside for retesting 0.7871. Nevertheless, firm break of 0.8054/63 will bring stronger rebound to 55 D EMA (now at 0.8139).

In the bigger picture, long term down trend from 1.0342 (2017 high) is still in progress. Next target is 100% projection of 1.0146 (2022 high) to 0.8332 from 0.9200 at 0.7382. In any case, outlook will stay bearish as long as 0.8475 resistance holds.
USD/CAD Daily Outlook
Daily Pivots: (S1) 1.3662; (P) 1.3698; (R1) 1.3719; More...
Intraday bias in USD/CAD remains neutral at this point. Corrective pattern from 1.3538 could extend further with another rise. On the upside, above 1.3773 will target 1.3797 and possibly above. On the downside, break of 1.3650 support will bring retest of 1.3538/55 support zone.
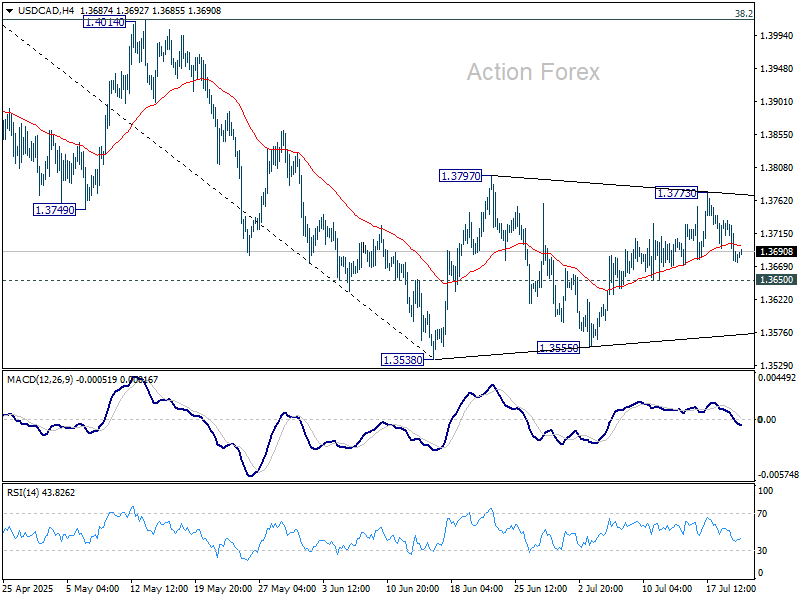
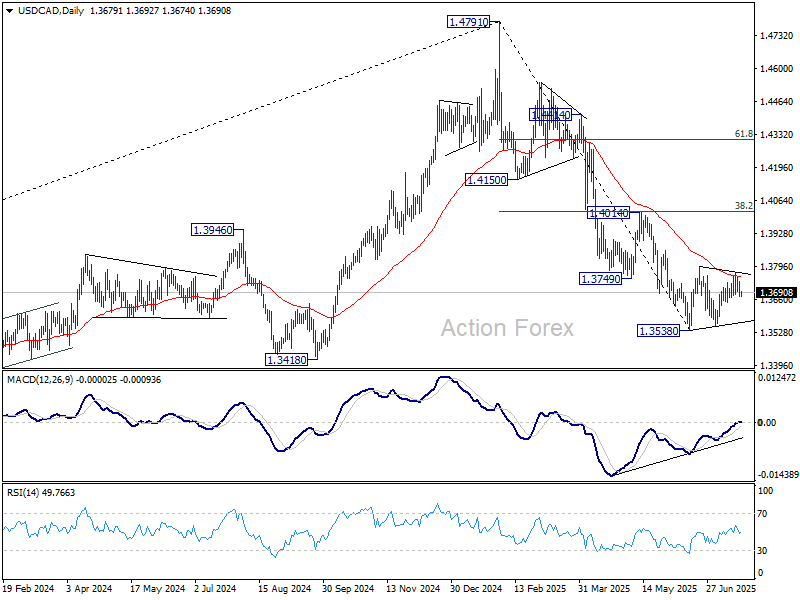
In the bigger picture, price actions from 1.4791 medium term top could either be a correction to rise from 1.2005 (2021 low), or trend reversal. In either case, further decline is expected as long as 1.4014 resistance holds. Next target is 61.8% retracement of 1.2005 (2021 low) to 1.4791 at 1.3069.
AUD/USD Daily Report
Daily Pivots: (S1) 0.6478; (P) 0.6509; (R1) 0.6539; More...
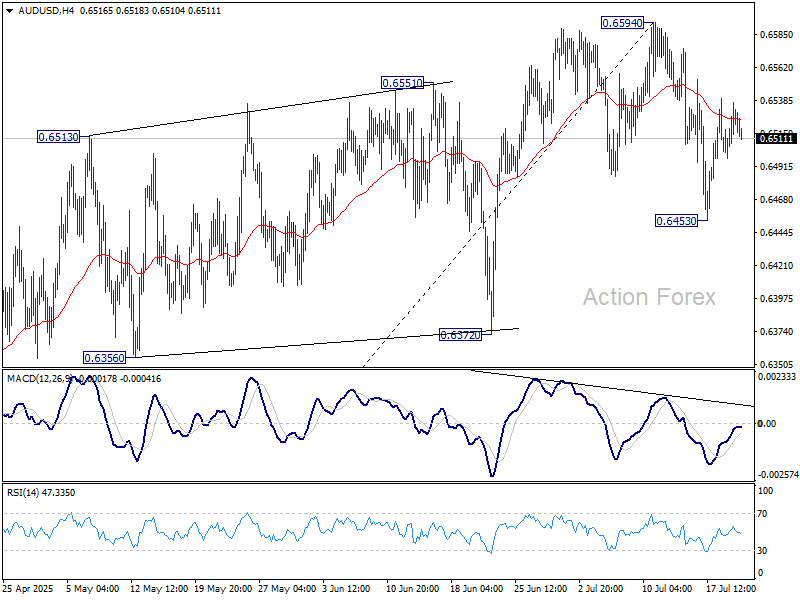
AUD/USD's dips mildly after failing to break through 55 4H EMA (now at 0.6524) decisively. Intraday bias remains neutral first. The corrective fall from 0.6594 short term top could extend lower. On the downside, break of 0.6453 will target 38.2% retracement of 0.5913 to 0.6594 at 0.6334, as a correction to the whole rally from 0.5913. Risk will stay mildly on the downside for now as long as 0.6594 resistance holds, in case of stronger recovery.
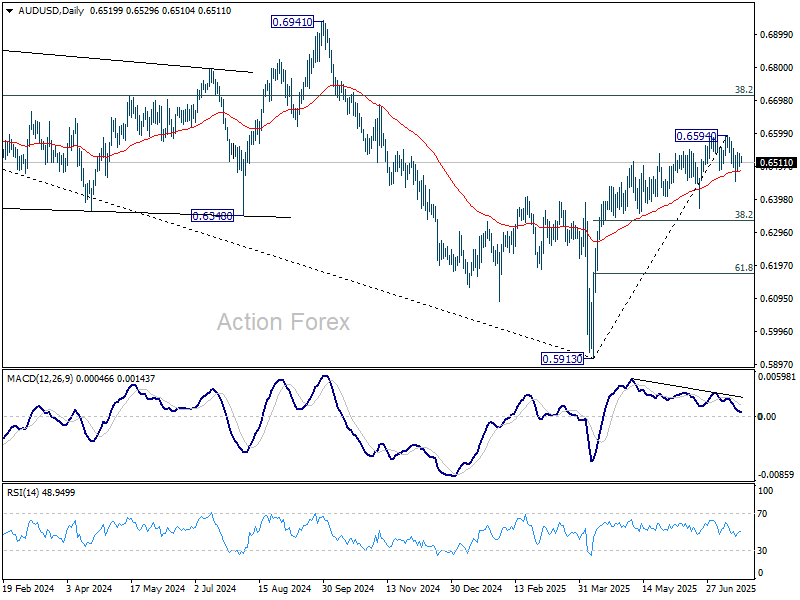
In the bigger picture, there is no clear sign that down trend from 0.8006 (2021 high) has completed. Rebound from 0.5913 is seen as a corrective move. While stronger rally cannot be ruled out, outlook will remain bearish as long as 38.2% retracement of 0.8006 to 0.5913 at 0.6713 holds. Nevertheless, considering bullish convergence condition in W MACD, even in case of another fall through 0.5913, downside should be contained above 0.5506 (2020 low).
RBA Signals More Cuts, Trade Risk Looms Across Asia
Aussie edged lower in Tuesday’s Asian session after minutes from the RBA’s July meeting confirmed a dovish bias, despite the surprise interest rate hold. The Board remains inclined to ease further, with the debate centered around timing rather than direction. Markets are leaning heavily toward an August rate cut, especially if Q2 CPI doesn’t deliver any upside surprises. Meanwhile, Kiwi underperformed despite robust trade data, while post-election short covering in the Yen appears to be fading. Swiss Franc leads on the day, followed by Dollar and Loonie, while Euro and Sterling stay in the middle.
On the trade front, U.S. Treasury Secretary Scott Bessent confirmed that August 1 remains the activation date for sweeping new tariffs. Though he characterized the move more as a negotiating lever than a final deadline. In an interview with CNBC, Bessent said, “The important thing here is the quality of the deal,” reinforcing the Trump administration's position that the tariffs are primarily about leverage, not timing.
In South Korea, the newly appointed economic leadership is scrambling to respond. Finance Minister Koo Yun-cheol and Trade Minister Yeo Han-koo will meet top US officials in Washington this week, as Seoul seeks to contain the damage from tariffs. President Lee Jae Myung's administration is under pressure to deliver quickly, with multiple cabinet-level visits planned for the coming days to shape a coordinated trade response.
Japan, too, is back at the negotiating table. Chief trade envoy Akazawa Ryosei has returned to Washington for the eighth time, seeking to restart stalled talks following a bruising election result for the ruling coalition. Japan is hoping to secure an agreement that will avert 25% auto tariffs by Trump’s August 1 deadline. Officials are signaling flexibility, but insist that any deal must protect core Japanese interests.
India, on the other hand, appears stuck. Sources say the latest talks in Washington failed to resolve differences on auto parts, steel, and agricultural tariffs. With no breakthrough and the US delegation not expected in Delhi until mid-August, India faces the very real possibility of being hit with a 26% blanket tariff. That puts additional pressure on Prime Minister Narendra Modi’s economic team as the clock ticks down.
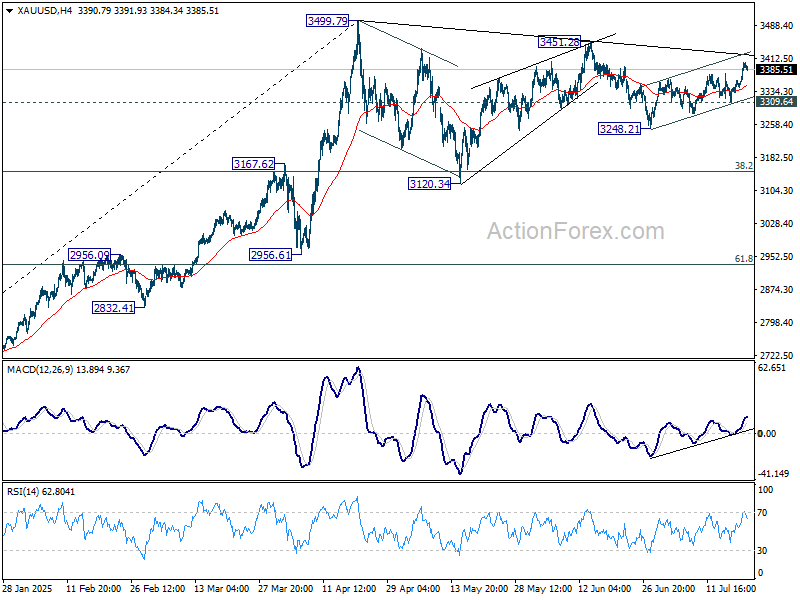
Technically, Gold's rebound from 3248.21 resumed this week and breached 3400 handle briefly. Still, overall price actions suggest that it's still extending the corrective pattern from 3499.79 high. There is no clear momentum for an imminent breakout. As for the current rebound, strong resistance should emerge around 3451.28 to limit upside. Break of 3309.64 support will start another downleg in the pattern and target 3248.21 and below.
In Asia, at the time of writing, Nikkei is down -0.27%. Hong Kong HSI is up 0.36%. China Shanghai SSE is up 0.59%. Singapore Strait Times is down -0.18%. Japan 10-year JGB yield is down -0.026 at 1.507. Overnight, DOW fell -0.04%. S&P 500 rose 0.14%. NASDAQ rose 0.38%. 10-year yield fell -0.060 to 4.372.
RBA minutes: Case for easing intact, but timing still debated
Minutes from the RBA’s July 7–8 meeting reveal a Board broadly aligned on the view that there will be "some additional reduction in interest rates over time". Yet, the board is divided on the "appropriate timing and extent of further easing". The majority ultimately judged it prudent to keep the cash rate steady at 3.85%.
The decision to hold reflected stronger-than-expected recent data, including "a little stronger than expected" private demand in Q1 and resilient labor market that " has not eased as anticipated". Monthly inflation readings had also been "marginally higher" than staff projections. Additionally, Members noted that reduced global risks allowed greater confidence in the RBA’s baseline forecasts, rather than the worst-case scenario.
Still, the minutes make clear that the RBA remains on an easing path. Some members argued there was already enough evidence to justify a cut now, but the Board as a whole leaned toward keeping a cautious, gradual approach, which is inconsistent with a third rate cut within the space of four meetings at that time.
New Zealand imports jump 19% yoy in June, while exports rise 10% yoy
New Zealand posted a trade surplus of NZD 142m in June, falling well short of market expectations for NZD 1.02B. The softer balance came despite solid annual growth in both exports and imports. Goods exports rose 10% yoy to NZD 6.6B and imports surging 19% to NZD 6.5B.
Regionally, exports to the EU jumped 38% yoy, followed by gains to China (11% yoy) and Australia (16% yoy). However, exports to the US and Japan declined -8.8% yoy and -4.7% yoy respectively.
The strength in exports was not enough to offset the broader pressure from surging imports, particularly as US ( 21% yoy) and South Korean (40% yoy) shipments rose sharply. Imports from EU (0.8% yoy), Australia (6.8% yoy) and China (9.1% yoy) also grew.
AUD/USD Daily Report
Daily Pivots: (S1) 0.6478; (P) 0.6509; (R1) 0.6539; More...
AUD/USD's dips mildly after failing to break through 55 4H EMA (now at 0.6524) decisively. Intraday bias remains neutral first. The corrective fall from 0.6594 short term top could extend lower. On the downside, break of 0.6453 will target 38.2% retracement of 0.5913 to 0.6594 at 0.6334, as a correction to the whole rally from 0.5913. Risk will stay mildly on the downside for now as long as 0.6594 resistance holds, in case of stronger recovery.
In the bigger picture, there is no clear sign that down trend from 0.8006 (2021 high) has completed. Rebound from 0.5913 is seen as a corrective move. While stronger rally cannot be ruled out, outlook will remain bearish as long as 38.2% retracement of 0.8006 to 0.5913 at 0.6713 holds. Nevertheless, considering bullish convergence condition in W MACD, even in case of another fall through 0.5913, downside should be contained above 0.5506 (2020 low).
USD/JPY Technical: Bearish Reversal Below Key 149.60 Range Resistance
The recent three-week rally of 4.5% in the USD/JPY, from its 1 July 2025 low of 142.68 to the 16 July 2025 high of 149.19 (a three-month peak), has reached a potential inflection zone of 149.00/149.60, where the next probable move is a decline back towards the bottom of a three-month ascending sideways range configuration in place since 22 April 2025.
USD/JPY bearish reaction at range resistance
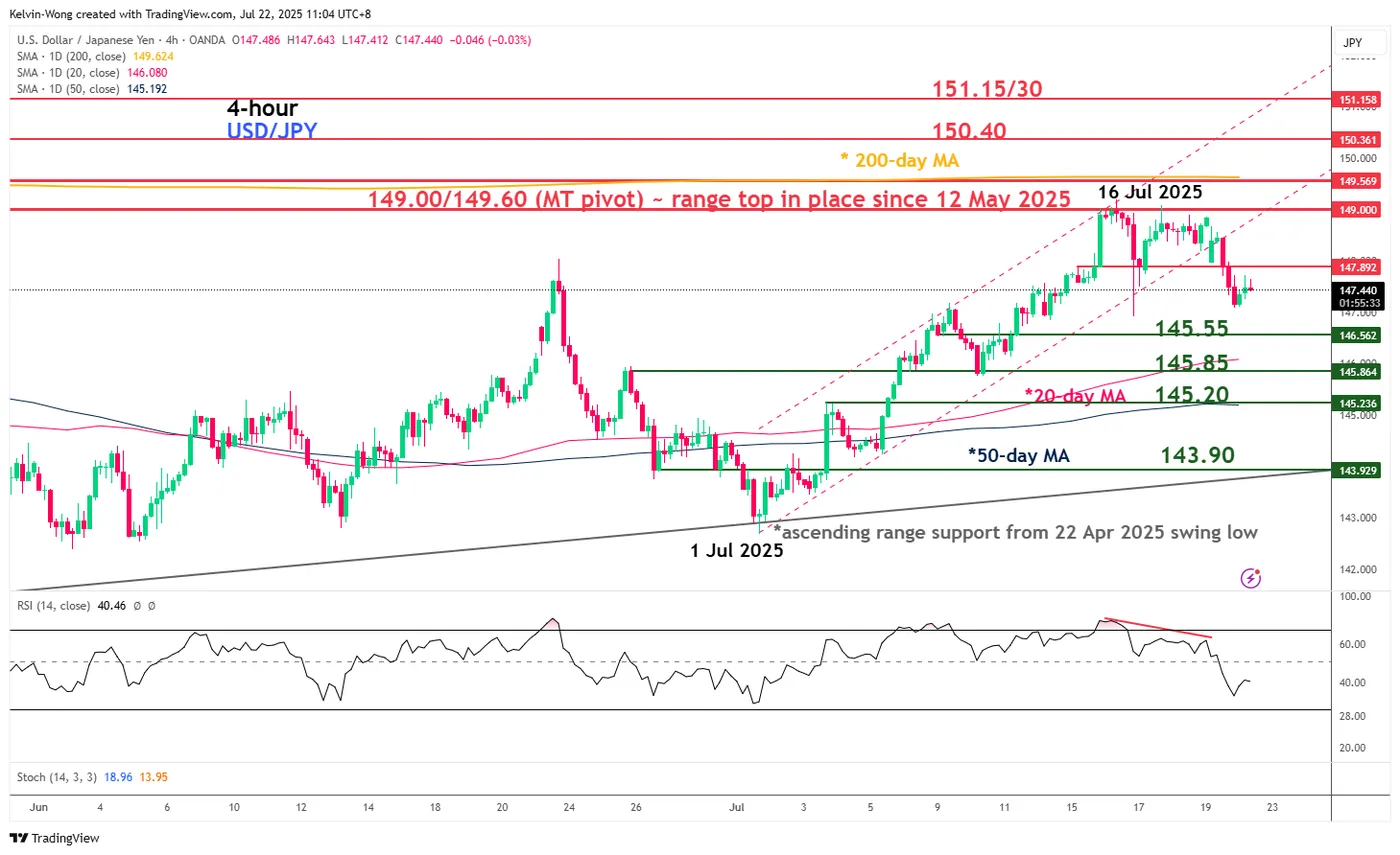
Fig 1: USD/JPY medium-term trend as of 22 July 2025 (Source: TradingView)
Preferred trend bias (1-3 weeks)
Bearish bias with key medium-term pivotal resistance at 149.00/149.60 for the next supports to come in at 145.55, 145.85 (also the 20-day moving average), and 145.20 (also the 50-day moving average).
Key elements
- The key inflection zone/resistance of 140.00/149.60 on the USD/JPY is defined by a medium-range top in place since May 12, 2025, the 200-day moving average, and a Fibonacci extension level.
- The 4-hour RSI momentum indicator has traced out a recent bearish divergence condition at its overbought region from 15 July to 18 July, which suggests that the upside momentum of the up move in the price actions of USD/JPY from 1 July to 16 July has waned.
- Price actions have gapped down below the minor ascending channel support from 1 July low on Monday, 21 July Asian session in reaction to Sunday’s Japan upper house election results, retested pull-back resistance of the former minor ascending channel support before it inched low by 0.9% to print an intraday low of 147.08 during the US session.
Alternative trend bias (1 to 3 weeks)
A clearance above 149.60 shifts the focus back to the bulls for a range breakout scenario to propel the USD/JPY higher for the next resistances to come in at 150.40 and 151.15/30 (medium-term swing highs of 3 March/27 March 2025).
Gold Regains Momentum—Bulls Back In The Game
Key Highlights
- Gold started a fresh increase above the $3,375 resistance.
- A key bullish trend line is forming with support at $3,345 on the 4-hour chart.
- WTI Crude Oil prices could restart decline and trade below $66.50.
- USD/JPY is consolidating gains below the 148.50 resistance.
Gold Price Technical Analysis
Gold prices formed a base above $3,300 and started a fresh increase. The bulls gained strength and were able to push the price above the $3,375 resistance.
The 4-hour chart of XAU/USD indicates that the price settled above the $3,380 level, the 100 Simple Moving Average (red, 4 hours), and the 200 Simple Moving Average (green, 4 hours). A high was formed at $3,402 and the price is now consolidating gains.
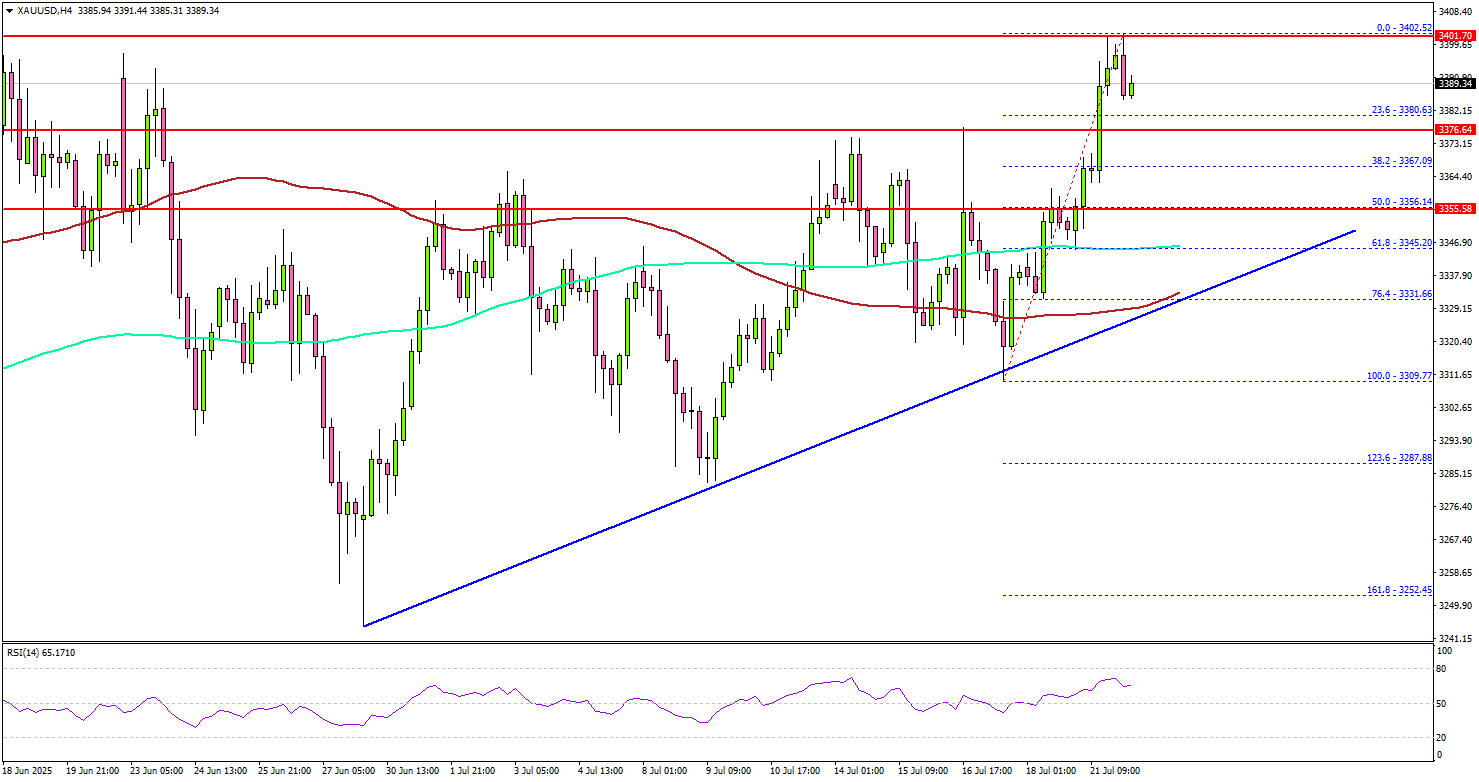
On the downside, initial support is near the $3,380 level. The first key support is $3,368. The next major support is near the $3,355 level. The main support is now $3,345. There is also a key bullish trend line forming with support at $3,345 on the same chart.
A downside break below the $3,345 support might call for more downsides. The next major support is near the $3,320 level. On the upside, immediate resistance is near the $3,400 level.
The next major resistance sits near the $3,412 level. The main barrier could be $3,420. A clear move above the $3,420 resistance could open the doors for more upsides. The next major resistance could be $3,440, above which the price could rally toward the milestone level of $3,450.
Looking at WTI Crude Oil, the price shows many bearish signs and could decline further below the $65.00 support zone.
Economic Releases to Watch Today
- BoE's Governor Bailey speech.
- Fed's Chair Powell speech.