Sample Category Title
USD/CHF Mid-Day Outlook
Daily Pivots: (S1) 0.7897; (P) 0.7945; (R1) 0.7969; More….
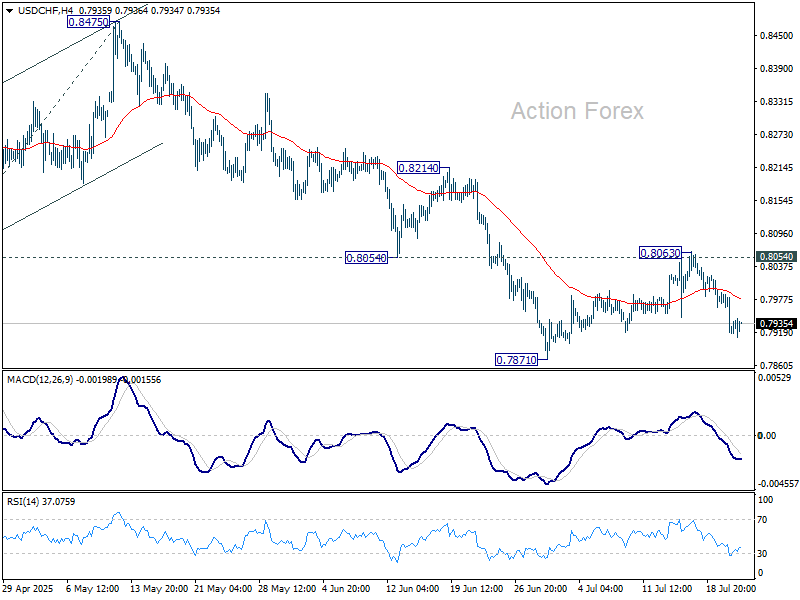
Intraday bias in USD/CHF remains on the downside for retesting 0.7871 support. Firm break there will resume larger down trend and target 61.8% projection of 0.9200 to 0.8038 from 0.8475 at 0.7757. For now, risk will stay on the downside as long as 0.8063 resistance holds, in case of recovery.
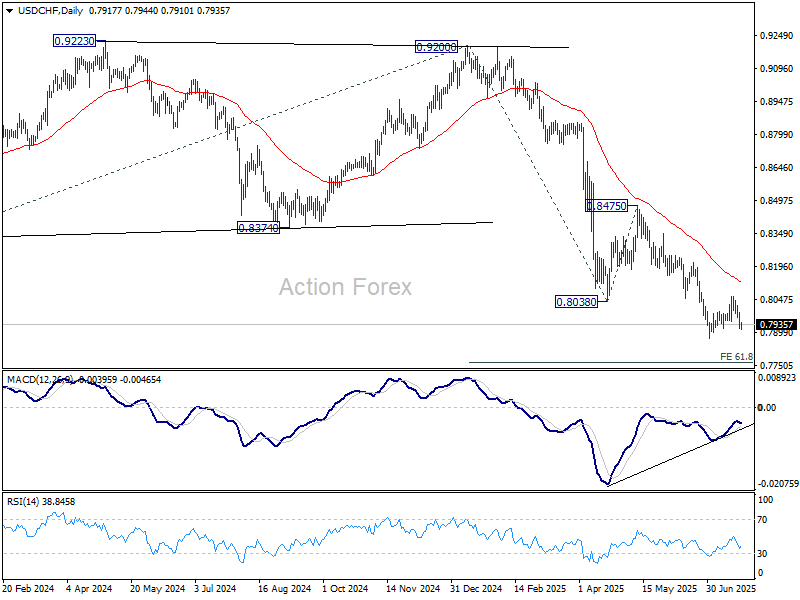
In the bigger picture, long term down trend from 1.0342 (2017 high) is still in progress. Next target is 100% projection of 1.0146 (2022 high) to 0.8332 from 0.9200 at 0.7382. In any case, outlook will stay bearish as long as 0.8475 resistance holds.
USD/JPY Mid-Day Outlook
Daily Pivots: (S1) 145.99; (P) 146.96; (R1) 147.62; More...
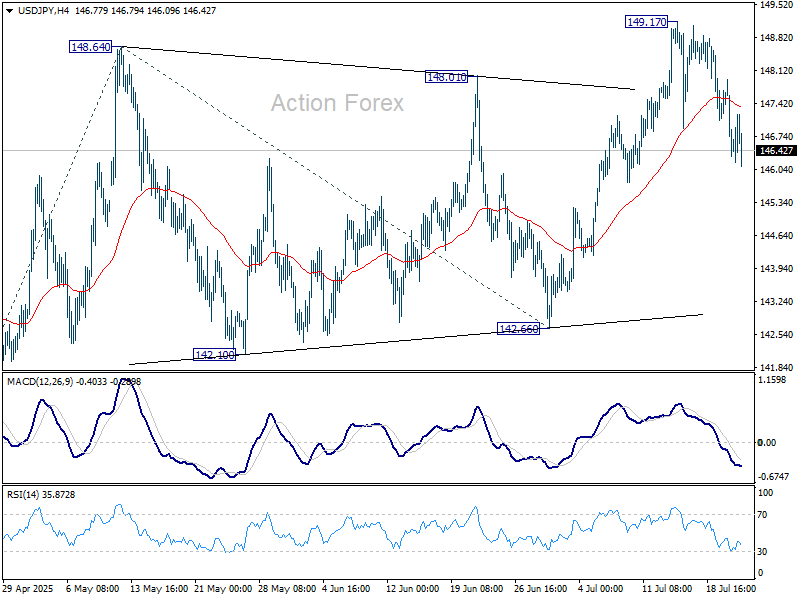
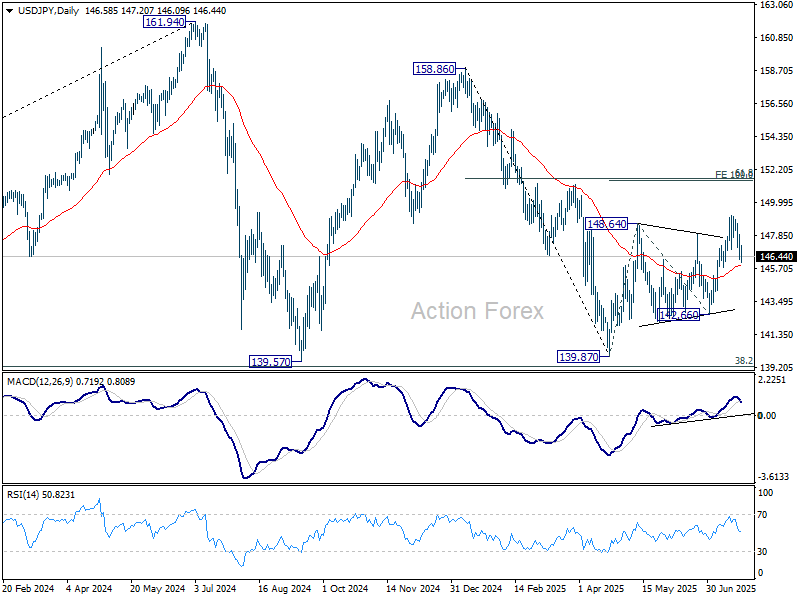
No change in USD/JPY's outlook and intraday bias stays neutral. Corrective pattern from 149.17 might extend, but further rally is expected as long as 55 D EMA (now at 145.91) holds. On the upside, break of 149.17 will target 100% projection of 139.87 to 148.64 from 142.66 at 151.43. That is close to 61.8% retracement of 158.86 to 139.87 at 151.22. However, sustained trading below 55 D EMA will argue that the whole rebound from 139.87 might have completed and target 142.66 support for confirmation.
In the bigger picture, price actions from 161.94 (2024 high) are seen as a corrective pattern to rise from 102.58 (2021 low). There is no clear sign that the pattern has completed yet. But still, strong support is expected from 38.2% retracement of 102.58 to 161.94 at 139.26 to bring rebound. in case of another fall.
AUD/USD Mid-Day Report
Daily Pivots: (S1) 0.6521; (P) 0.6539; (R1) 0.6575; More...
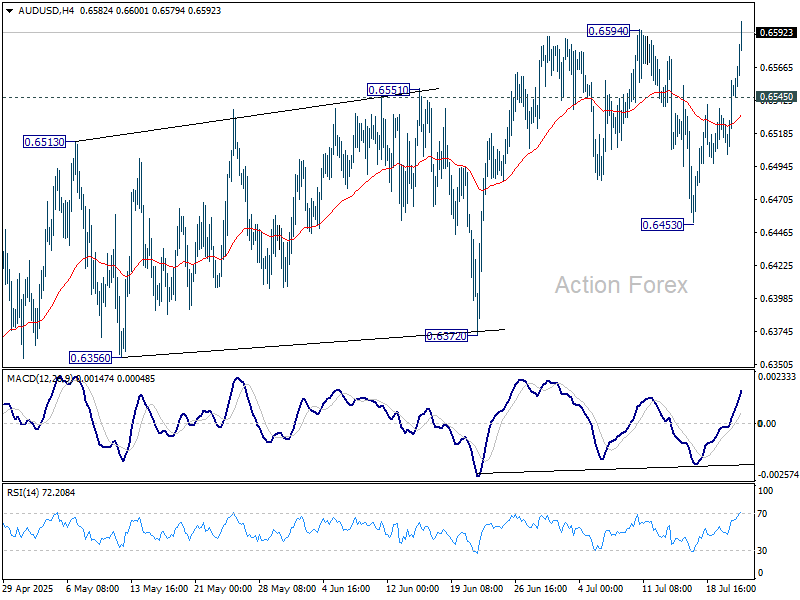
AUD/USD's break of 0.6594 confirms resumption of whole rise form 0.5913. Intraday bias is back on the upside. Further rally should be seen to 0.6713 fibonacci level. On the downside, below 0.6545 minor support will turn intraday bias neutral again. But near term outlook will continue to stay bullish as long as 0.6453 support holds.
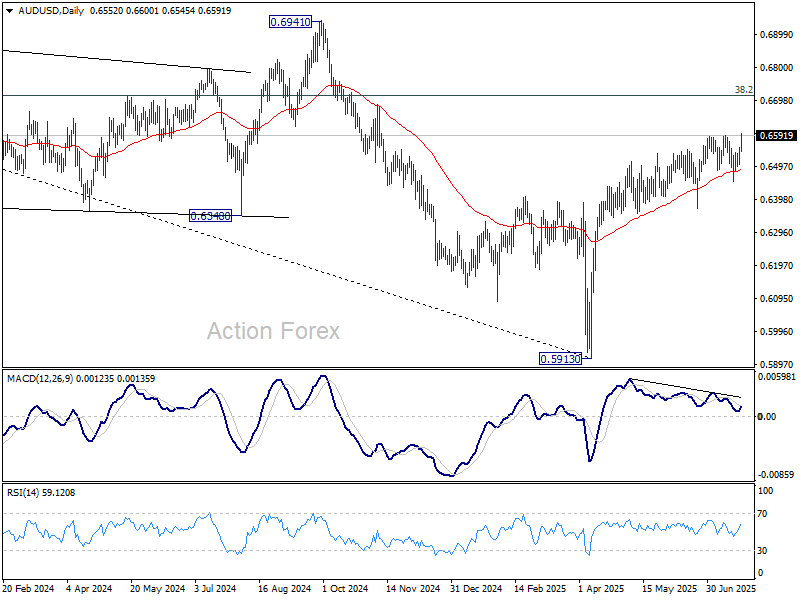
In the bigger picture, there is no clear sign that down trend from 0.8006 (2021 high) has completed. Rebound from 0.5913 is seen as a corrective move. While stronger rally cannot be ruled out, outlook will remain bearish as long as 38.2% retracement of 0.8006 to 0.5913 at 0.6713 holds. Nevertheless, considering bullish convergence condition in W MACD, even in case of another fall through 0.5913, downside should be contained above 0.5506 (2020 low).
Global Risk Rally Fueled by US-Japan Deal, Hopes Rise for EU Breakthrough
A wave of optimism rippled through global markets Wednesday after the U.S. and Japan finalized a trade agreement slashing tariffs and easing trade tensions. The Nikkei jumped 3.51%, setting the tone across Asia, while European stocks and US futures are also trading higher. Hopes are growing that other trade partners, notably the EU, may also secure deals before the looming August tariff deadlines.
In currencies, risk-sensitive Kiwi and Aussie led gains, followed by Yen — itself a reflection of Japan’s improving trade outlook. On the other end, Euro, Swiss Franc, and Dollar lagged, consistent with an unwinding of safe-haven positions. Sterling and Loonie are positioning in the middle .
The core of the Japan deal includes a reduction of US tariffs on autos from 27.5% to 15%, and other goods from 25% to 15%. While still high, these levels are considered manageable and far better than the maximum threat levels. Investors are encouraged by the return of predictability, which had been absent during months of escalating trade rhetoric.
Yet, the threat of elevated tariffs still looms large. Canada faces potential 35% duties, and the EU could be hit with 30% unless a deal is reached. China remains under pressure as well, with the August 12 expiration of the 90-day truce fast approaching. If no resolution is found, tariffs could revert to a punishing 145% on U.S. goods and 125% on Chinese exports.
Despite these risks, traders are betting on progress. US Treasury Secretary Scott Bessent said talks with the EU are “going better than they had been”. But he emphasized that Japan's favorable 15% rate was linked to a creative package involving equity stakes, credit guarantees, and investment pledges. EU negotiators will need to match that innovation to reach a similar outcome.
The European Commission, for its part, is continuing parallel preparations for retaliation. Trade Commissioner Maros Sefcovic is scheduled to speak with Commerce Secretary Howard Lutnick later today. Brussels will consolidate two proposed tariff lists worth EUR 93B into a single countermeasure plan for member approval. These measures could be enacted as early as August 7 if no deal is reached.
Technically, NZD/USD's extended rebound and strong break of 55 4H EMA suggests that correction from 0.6119 has already completed at 0.5904 already. Further rise should now be seen to retest 0.6119 high first. Firm break there will resume whole rally from 0.5484. Next target is 38.2% retracement of 0.7463 to 0.5484 at 0.6240.


In Europe, at the time of writing, FTSE is up 0.49%. DAX is up 0.59%. CAC is up 1.11%. UK 10-year yield is up 0.043 at 4.618. Germany 10-year yield is up 0.019 at 2.611. Earlier in Asia, Nikkei rose 3.51%. Hong Kong HSI rose 1.62%. China Shanghai SSE rose 0.01%. Singapore Strait Times rose 0.55%. Japan 10-year JGB yield rose 0.09 to 1.597.
BoJ's Uchida see moderate growth and temporarily sluggish inflation
BoJ Deputy Governor Shinichi Uchida said in a speech today that Japan's economy is likely to "moderate" amid slowing global growth, with underlying inflation remaining "sluggish temporarily". He added that downside risks dominate the outlook, particularly due to high uncertainty surrounding global trade policy and its spillover effects on both domestic and external demand.
Still, Uchida maintained that if the Bank's baseline outlook holds, gradual rate hikes will continue. With real interest rates deeply negative, the BoJ is positioned to adjust its accommodative stance, but only as long as the economic and inflation path improves as expected.
He also highlighted the crosscurrents in Japan’s inflation profile—cost-push pressures from food remain elevated, while demand-side forces are weak. How businesses adjust wages and prices in response to these forces will be central to determining the sustainability of price growth.
Australia Westpac leading index falls to 0.03%, signals weak H2
Australia’s Westpac Leading Index slipped from 0.11% to just 0.03% in May, continuing a six-month slide that points to weakening momentum heading into the second half of 2025. The index, which provides a guide to economic activity three to nine months ahead, has lost altitude from 0.33% in December, with five of eight components dragging—particularly commodity prices, consumer sentiment, and hours worked.
Westpac noted that the shift from modestly above-trend growth to an “around trend” signal marks a clear step-down in economic momentum. The bank now expects the economy to expand by only 1.7% in 2025, a slight pickup from 1.3% in 2024, but still well below historical averages.
With the RBA set to meet on August 11–12, the Leading Index adds to the case for renewed policy easing. Westpac sees the June quarter CPI, due next week, as the key swing factor. A benign reading would likely clear the way for a 25bp cut in August, followed by another in November and two further cuts in H1 2026 as the central bank gradually loosens policy amid persistent growth headwinds.
AUD/USD Mid-Day Report
Daily Pivots: (S1) 0.6521; (P) 0.6539; (R1) 0.6575; More...
AUD/USD's break of 0.6594 confirms resumption of whole rise form 0.5913. Intraday bias is back on the upside. Further rally should be seen to 0.6713 fibonacci level. On the downside, below 0.6545 minor support will turn intraday bias neutral again. But near term outlook will continue to stay bullish as long as 0.6453 support holds.
In the bigger picture, there is no clear sign that down trend from 0.8006 (2021 high) has completed. Rebound from 0.5913 is seen as a corrective move. While stronger rally cannot be ruled out, outlook will remain bearish as long as 38.2% retracement of 0.8006 to 0.5913 at 0.6713 holds. Nevertheless, considering bullish convergence condition in W MACD, even in case of another fall through 0.5913, downside should be contained above 0.5506 (2020 low).
July Flashlight for the FOMC Blackout Period
Summary
- We expect the FOMC to hold the fed funds rate steady at 4.25%-4.50% for a fifth consecutive meeting at the conclusion of its upcoming gathering on July 30. Data over the inter-meeting period suggest the labor market remains roughly at "full employment," while inflation has edged up slightly and continues to run higher than the FOMC's 2% target. As such, most members are likely to support policy remaining "modestly" or "moderately" restrictive at this time.
- That said, a split has emerged on the Committee about how to balance current risks to the outlook and the near-term path of rates. Some Committee members, most notably Governors Waller and Bowman, see risks to the labor market over-shadowing risks to inflation and appear supportive of a rate cut at the upcoming meeting. But, the majority of the Committee seems reluctant to resume rate cuts given the lingering upside risks to inflation generated by higher tariffs, relatively easy financial conditions and resilient economic activity.
- With the July jobs report and a number of key trade deadlines falling shortly after the July FOMC meeting concludes, we do not expect the Committee to signal easing is forthcoming at its next meeting on September 16-17. Rather, we expect to see fairly minimal changes to the post-meeting statement to help the Committee preserve optionality about future policy decisions.
- Public pressure from the Trump administration for the FOMC to lower rates and discussions of replacing Chair Powell have intensified since the Committee's last meeting, putting the question of the central bank's independence in the spotlight. The Federal Reserve has never been fully separate from the political process, but a combination of laws, agreements and norms permit a significant amount of independence when it comes to setting monetary policy. Will policy setting stay independent in the months ahead?
- Our expectation is that Chair Powell will serve out the remainder of his current term, which expires in May 2026. The next Chair will likely lead the central bank in a more dovish direction, but we expect changes will be gradual rather than a complete departure from recent convention. The Committee is comprised of a mix of 12 voting members from the Board of Governors and regional Federal Reserve Banks, and decisions are made by consensus. One person, even the Chair, can only change monetary policy so far and so fast.
- An overly-dovish bias of the next Fed Chair could prove counterproductive to the administration's aims. If the FOMC were to lose its inflation-fighting credibility, less foreign demand for U.S. assets, higher inflation expectations and a steeper yield curve strike us as plausible outcomes. In our view, moderate long-term interest rates are predicated on a credible, independent Federal Reserve and well-anchored inflation expectations.
- Most Committee members already seem inclined to cut rates this year, as illustrated in the June Summary of Economic Projections and recent Fed speak. We expect the resumption of policy easing this autumn to alleviate some of the current political pressure on the Committee in the months ahead.
"I'm Not Thinking About That"
Ahead of the FOMC's July 29-30 meeting, the race to become the next Chair and the fate of the current Chair have dominated Fed-related headlines. Yet, we expect Chair Powell and the rest of the Committee to be squarely focused on the job at hand: restoring price stability while maintaining full employment during a time of significant changes to and uncertainty around economic policy.
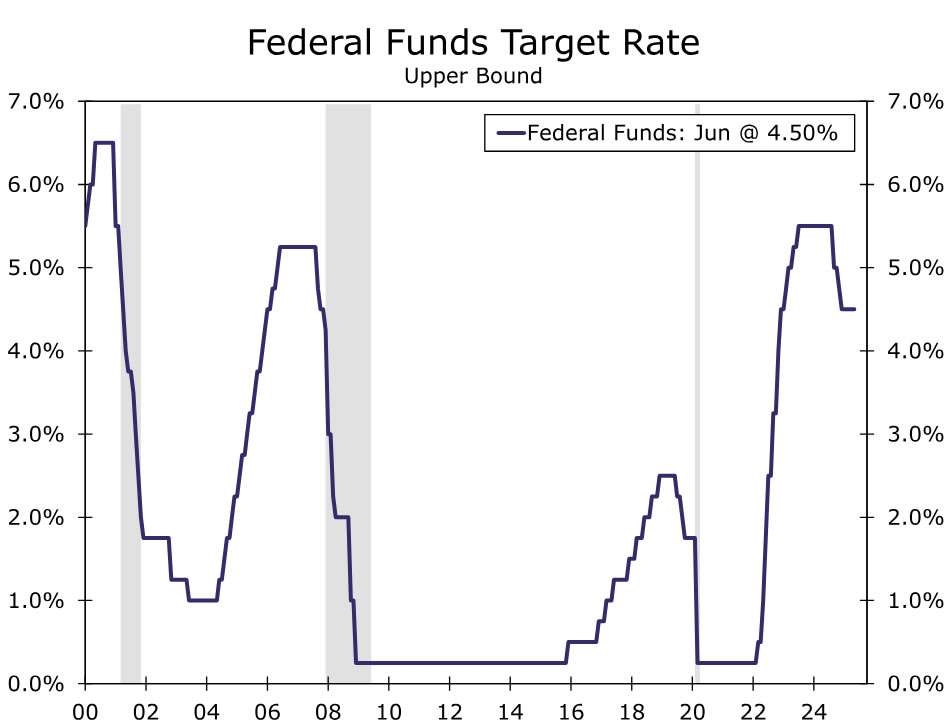
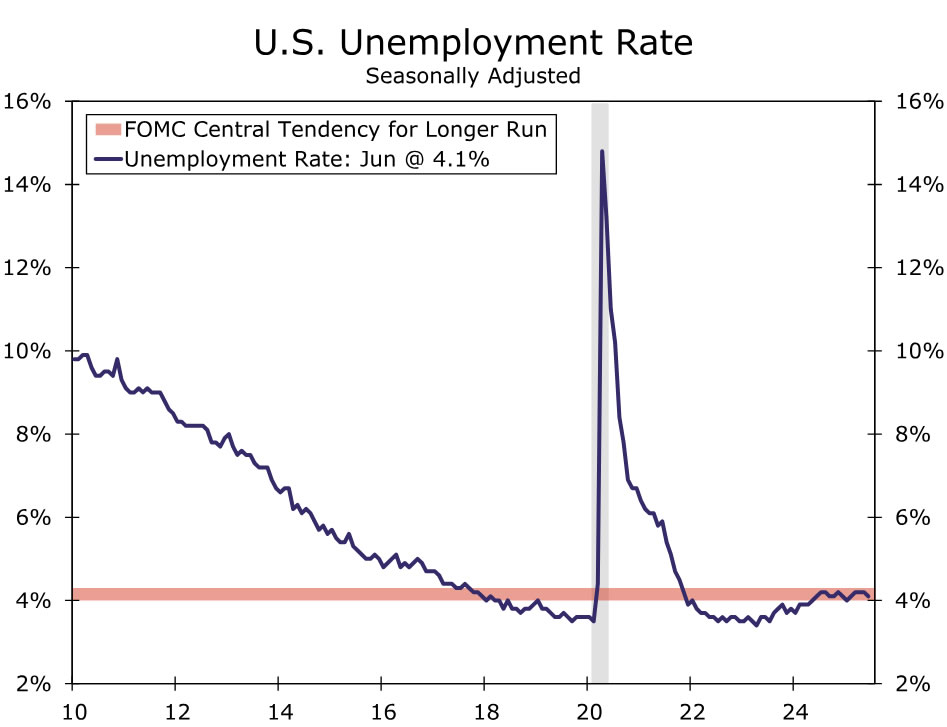
At 4.25%-4.50%, the fed funds target range has been unchanged since December (Figure 1). We expect the Committee to once again hold rates steady at the conclusion of its upcoming meeting on July 30. Members continued to view the labor market as "solid" at the June FOMC meeting, and data over the inter-meeting period give little reason to alter this characterization. Payroll growth has steadied around a 150K monthly pace since April even as gains have become more narrowly based across industries. While demand for workers continues to gradually subside, slower growth in labor supply helped to reduce the unemployment rate to 4.1% in June, putting it a tick below the Committee's median longer-run estimate (Figure 2). In other words, the maximum employment side of the Fed's mandate continues to be met.
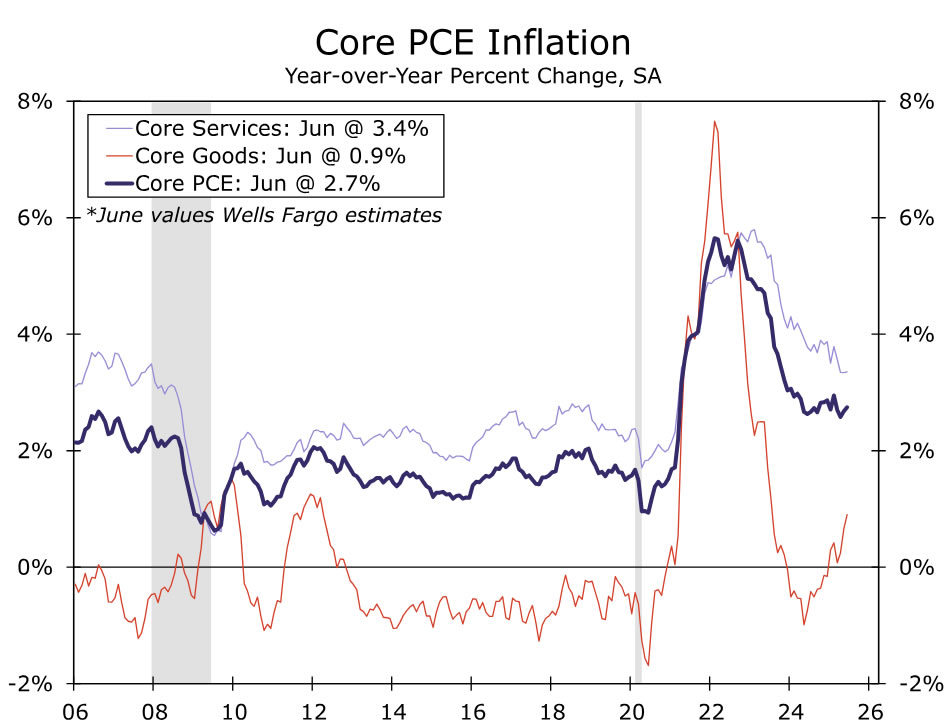
That said, inflation continues to run above the Committee's 2% target. The Consumer Price and Producer Price indices for June point to the Fed's preferred measure of inflation, the PCE deflator, picking back up to a year-over-year rate of 2.5%. For the core inflation measure, the renewed uptrend in goods inflation has been thus far largely offset by softening in services inflation (Figure 3). But, Fed officials remain on guard about the upward pressure on inflation stemming from higher tariffs. While noting the uncertainty that surrounds the timing and magnitude of the effects of tariffs on inflation, all FOMC participants in the June Summary of Economic Projections estimated PCE inflation would end the year above its current 2.3% year-over-year rate.
How Split?
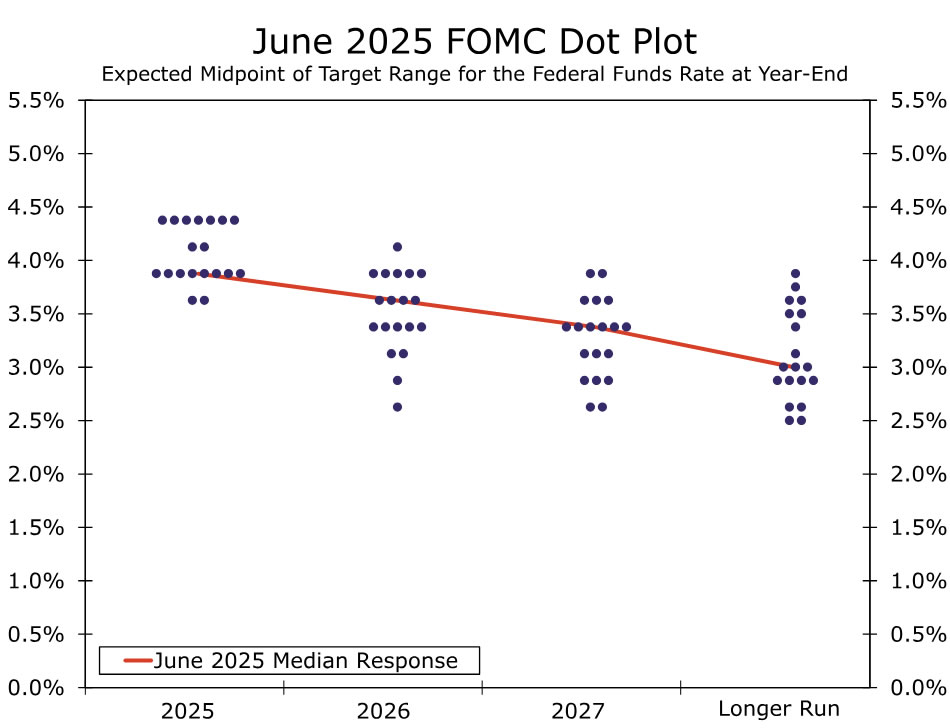
While the FOMC unanimously decided to leave the fed funds range unchanged at its prior meeting in June, a split in the Committee has emerged about the path of rates going forward. In the June Summary of Economic Projections, seven participants saw no cuts as likely to be appropriate this year, while eight aligned with the median of two 25 bps cuts (Figure 4). A couple of participants saw the prospect for three cuts this year. Governors Bowman and Waller made headlines shortly after the June meeting by opening the door to a rate cut as soon as the July meeting. In a speech late last week, Governor Waller pointedly said, "I believe it makes sense to cut the FOMC's policy rate by 25 basis points" at the upcoming meeting.
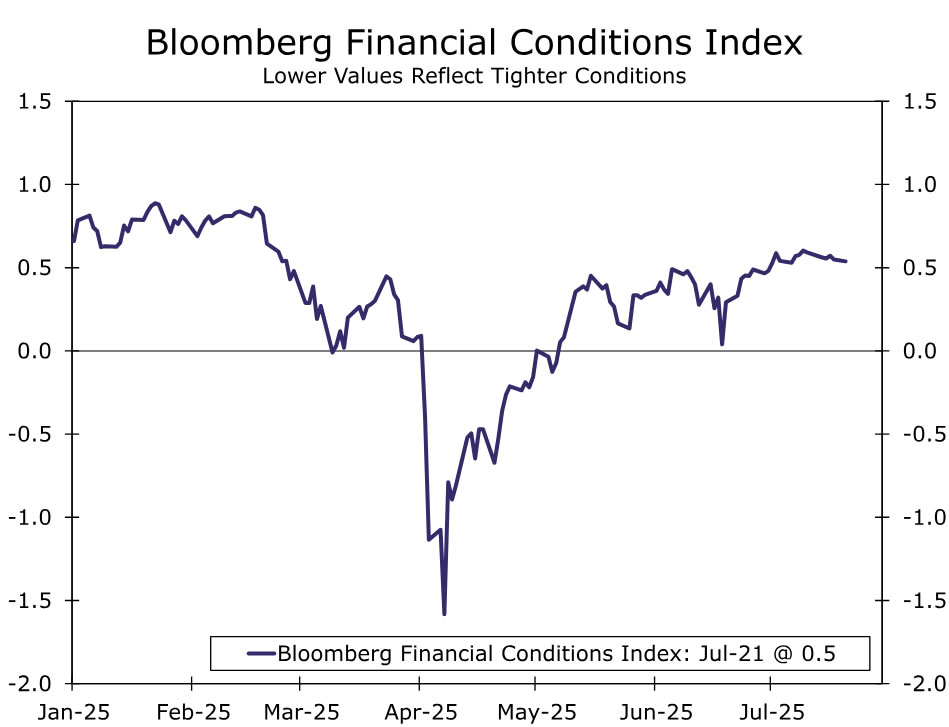
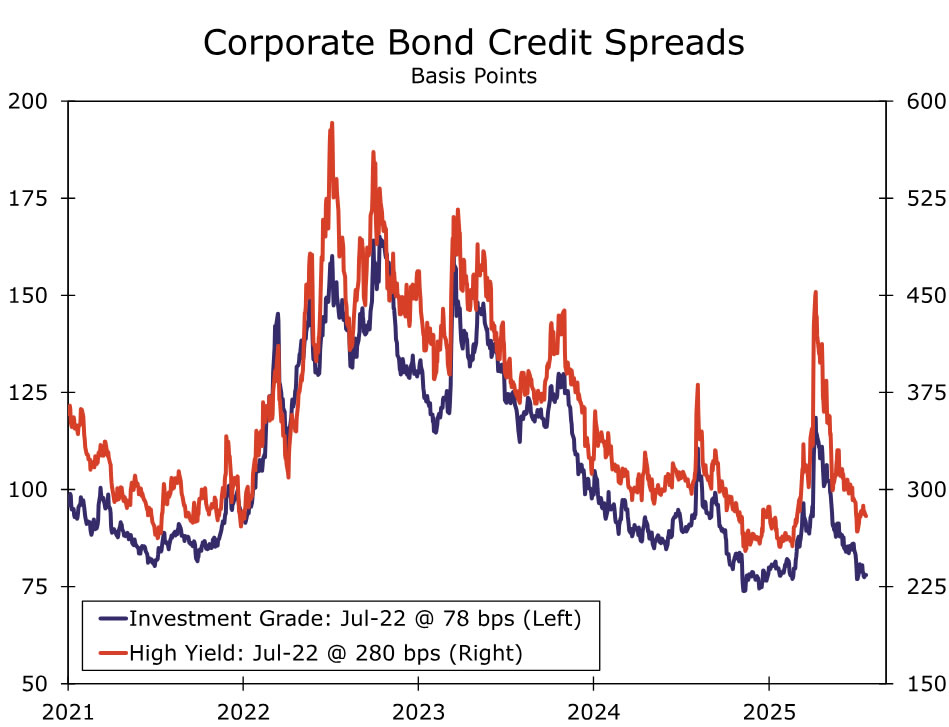
However, the vast majority of the Committee is not as ready to begin resuming rate cuts. The June meeting minutes and recent Fed speak show more Committee members view the upside risks to inflation as being greater than the downside risks to employment at this juncture. After the 2021-2022 spike in inflation proved more severe and longer-lasting than Fed officials first assumed, many are mindful of the risk that tariff-induced inflation may prove more persistent and long-lasting. Moreover, with most officials viewing policy as only "moderately" or "modestly" restrictive, expectations persist for activity to remain resilient in the near term. The view that policy is not overly restrictive is backed by the behavior of financial conditions, which have eased considerably in recent months (Figure 5). U.S. equity markets are once again at all-time highs, while credit spreads are back near multi-year tights (Figure 6). Shortly before the blackout period, FOMC Vice Chair & New York Fed President John Williams, who we view as a centrist on the Committee, stated that the current restrictiveness of policy is "entirely appropriate" amid his expectations for tariffs to generate a lift to inflation in the coming months.
As such, we do not expect any hints in the post-meeting statement or press conference that a resumption of policy easing is around the corner. The outlook for trade policy remains highly uncertain and makes forward guidance challenging. Only days after the July FOMC meeting concludes are deadlines for settling "reciprocal" tariffs (Aug. 1 for most nations; Aug. 12 for China) and the start of the court case to determine whether the "reciprocal" tariffs are legal under the International Emergency Powers Act (July 31). Officials also will receive two more months of inflation and labor market data before their next meeting on September 17. We suspect that will be enough to keep most participants comfortable in wait-and-see mode somewhat longer.
Governor Waller seems all but assured to dissent and may be joined by Governor Bowman, but the bulk of the Committee looks poised to keep their options open for the future path of rates. Note that two governors (i.e., not regional Fed presidents) dissenting is unusual: it last occurred in December 1993. Multiple governors dissenting would be another sign of the current split within the Committee regarding the appropriate path of monetary policy.
The post-meeting statement could include a slight downgrade to the characterization of recent activity (e.g., from a "solid" to "moderate" pace") following a slower pace of consumer spending reported since the June FOMC meeting, but the prior characterization of the labor market as "solid" and inflation as "somewhat elevated" still holds, in our view. The only other change we expect to see is around uncertainty about the outlook no longer described as "having diminished."
Federal Reserve Independence: A Refresher
With most FOMC members signaling that the inflation and labor market backdrop warrants keeping rates steady somewhat longer, pressure from the Trump administration to lower the fed funds rate has intensified. This has put the topic of monetary policy independence front and center.
As an institution, the Federal Reserve's independence has evolved over time, but it has never been fully separate from the political process. The president appoints the governors to the Federal Reserve Board, including the Chair, and the Senate votes to confirm these individuals. Congress sets the Federal Reserve's goals and mandates through law. The Federal Reserve was established by an act of Congress, and subsequent Congresses have changed the Federal Reserve's structure and objectives. The Fed's dual mandate for full employment and price stability, for example, was established by Congress in 1977.
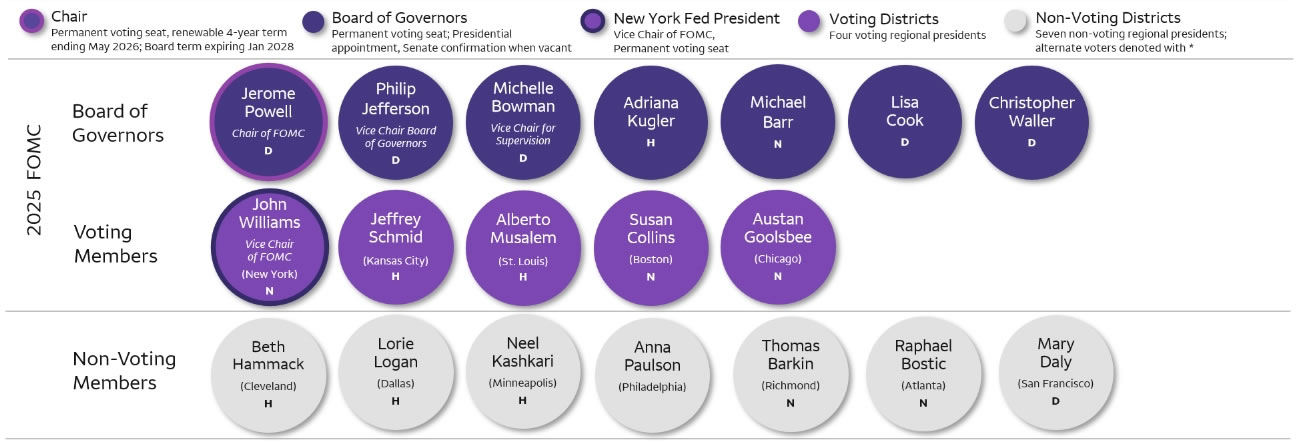
That said, a combination of laws, agreements and norms permit the Federal Reserve a significant amount of independence when it comes to setting monetary policy. The 12 regional Federal Reserve Bank presidents are not appointed by the president but instead are selected by their boards, with the latter typically made up of individuals working in business, finance and other local community leaders. Governors receive 14-year terms, and the seven governors' terms are staggered every two years, helping to ensure the Board has appointees from multiple presidents (Figure 7). In addition, the Federal Reserve is self-funded and does not receive explicit appropriations from Congress.
During World War II, the U.S. Treasury and Federal Reserve explicitly cooperated, with the central bank agreeing to buy U.S. Treasury securities in enormous quantities to help finance the war effort. After the war, an agreement between the Treasury and Fed was eventually reached, known as the Treasury-Fed accord. This accord helped establish the Federal Reserve that we know today: one where monetary policy decisions are made in response to economic conditions such as unemployment and inflation, rather than fiscal needs.
What Does the Pressure Mean for the Path of the Fed Funds Rate?
A full review of the many twists and turns in the Fed's tug of war over its independence is beyond the purview of this note. More directly, the question we have gotten most often from clients lately has boiled down to more or less the following: will the next Fed Chair dramatically alter the course of monetary policy, i.e., will policy setting still be independent? Although it is still somewhat premature to say given that we do not know who the selection will be, our sense is that the next Chair will lead the central bank in a more dovish direction. Yet, we expect changes will be gradual and still within the general consensus of economists and financial markets, rather than a complete departure from recent convention.
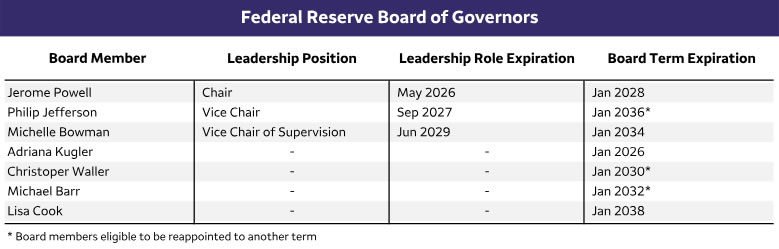
The Chair is the most important member of the FOMC, but it is still a Committee that requires consensus to act. If a new Chair came to the FOMC and attempted to alter course in a dramatic way, we suspect there would be push-back from much of the rest of the Committee, limiting the policy change. Assuming Chair Powell and Vice Chair Jefferson resign from the Board when their leadership positions expire in May 2026 and September 2027, respectively, President Trump will have three open seats to fill over his four-year term, conditional on no other unexpected vacancies (Figure 8). But, that still leaves four other governors as well as the 12 regional Fed presidents in a position to continue to influence monetary policy via their seats at the table.
If a new Chair came to the FOMC and attempted to alter course in a dramatic way, we suspect there would be push-back from much of the rest of the Committee, limiting the policy change.
Furthermore, the current Committee already seems inclined to cut rates over the next year or two. As discussed earlier, the dot plot from June had a median projection of 50 bps of easing this year and 100 bps of cumulative easing through 2027. We think the political pressure for the FOMC to cut rates will be reduced if Fed leaders cut rates by 50-100 bps at some point over the next few quarters, as is our current base case forecast. We also think the pressure to cut rates will ease somewhat if a more clear acceleration in consumer prices takes hold.
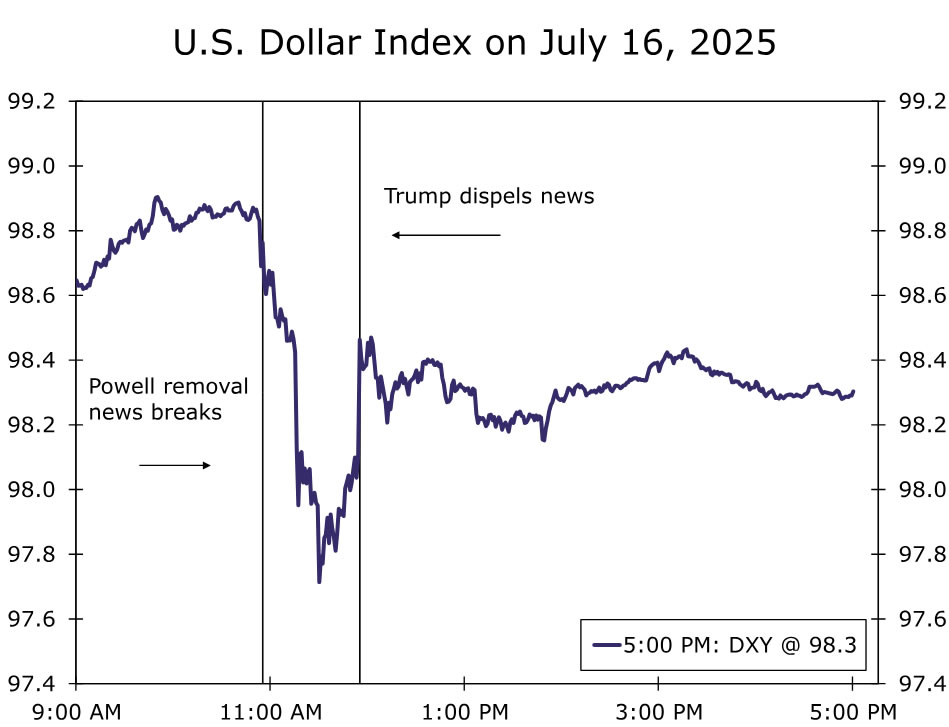
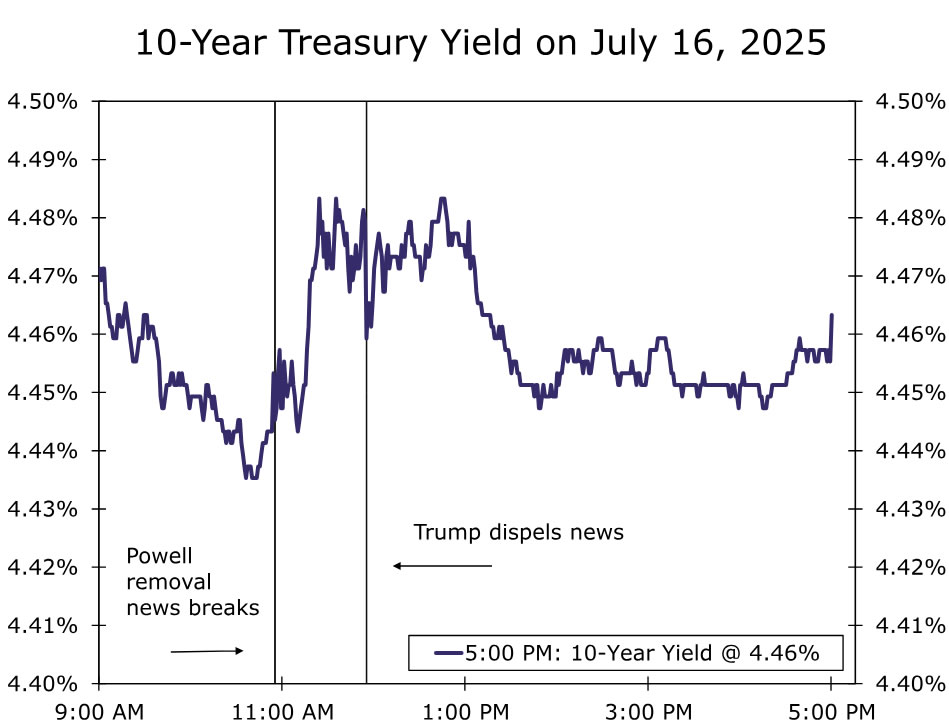
Finally, if the FOMC were to adopt an overly-aggressive dovish bias, it is not immediately clear to us that it would produce the financial market outcomes desired by the Trump administration. On July 16, breaking news headlines seemed to suggest that President Trump was actively considering removing Chair Powell from his position. About an hour later, the president dispelled this report, but the initial reaction in financial markets was lower equity prices, a weaker dollar and higher long-term interest rates (Figures 9, 10). Admittedly, this was a short-lived event and is only one episode of data. But, if the FOMC were to lose its inflation-fighting credibility, less foreign demand for U.S. assets, higher inflation expectations and a steeper yield curve strike us as plausible outcomes. In our view, moderate long-term interest rates are predicated on a credible, independent Federal Reserve and well-anchored inflation expectations.
Thus, for the time being, we are not inclined to make any major forecast changes to our outlook for the federal funds rate in light of the incoming change in Fed leadership. It remains to be seen who the president will select and who the Senate will confirm, and one person, even the Chair, can only change monetary policy so far and so fast. Furthermore, our expectation that the FOMC will cut the fed funds rate by 75 bps by year-end should help alleviate some of the pressure on the Committee. That said, this is clearly a major risk to the financial market and economic outlook as 2026 comes closer into view. As the President's thinking on the candidates evolves, we will have more to say on the subject in future reports.
Is Fed Behind the Curve?
- Fed is under increasing scrutiny about its decision to delay rate cuts.
- Ongoing tariff uncertainty and resilient economy support Fed’s case for pause.
- But Fed may have left it too late amid some cracks in labour market.
Trump steps up attack on Fed
US President Donald Trump has been relentless in his criticism of the Federal Reserve chair, Jerome Powell, since his return to the White House. From name calling him everything from ‘stupid’ to ‘Mr. Too Late’, Trump has been very public about his dissatisfaction with the Fed going on pause just as he took office.
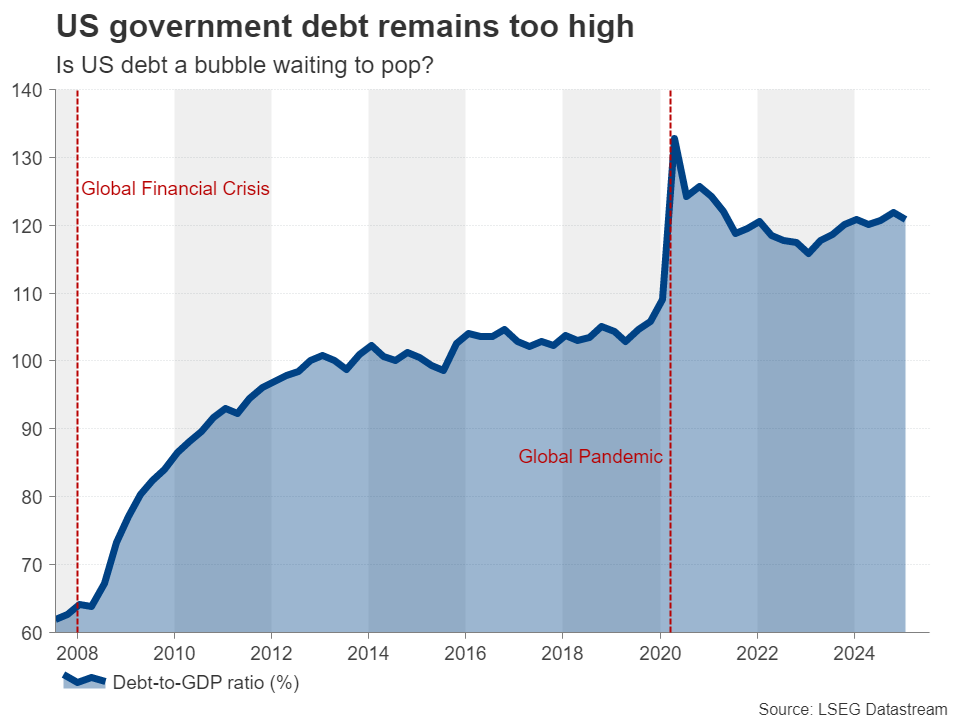
On the face of it, one might assume that growth concerns are the primary reason why the President is pressing Jay Powell to cut interest rates amid a slowing economy that’s battling heightened trade uncertainty. But Trump’s main worry is the high interest that the federal government has to pay on its debt. Following Congress’s passing of Trump’s ‘Big Beautiful Bill’, which looks set to raise total debt by at least $3 trillion, some analysts are predicting that the annual cost of financing debt interest and repayments will reach $10 trillion. Investors were hoping that a Republican trifecta would lower the debt-to-GDP ratio, not raise it. Instead, the risk of a future US debt crisis has only increased.
The Fed’s dual mandate dilemma
Still, does Trump have a point or is Powell right to stick to his guns on inflation? The Fed has a dual mandate of maintaining price stability while achieving maximum employment. But if policymakers have to prioritize one over the other, inflation always comes out top as without price stability, it would not be possible to have a healthy labour market. Central banks only tend to overlook short-term inflation risks if they can be confident that price pressures will ease over the medium term.
That’s not the case right now for the Fed, as Trump’s trade rampage has clouded the outlook, giving policymakers little clarity about future tariff levels. Powell has been quite explicit in his warning that inflation is expected to head higher over the summer, as the baseline 10% levy rate on most imports introduced on April 2 starts to filter through consumer prices.
Waiting for the tariffs impact
However, several officials believe that any uptick in inflation is likely to be temporary, although this will depend on whether or not further tariff hikes will be announced. On that front, it’s not looking good. While the UK and China won significant tariff reprieves in their respective deals, the Trump administration has been in a less generous mood since those agreements were announced.
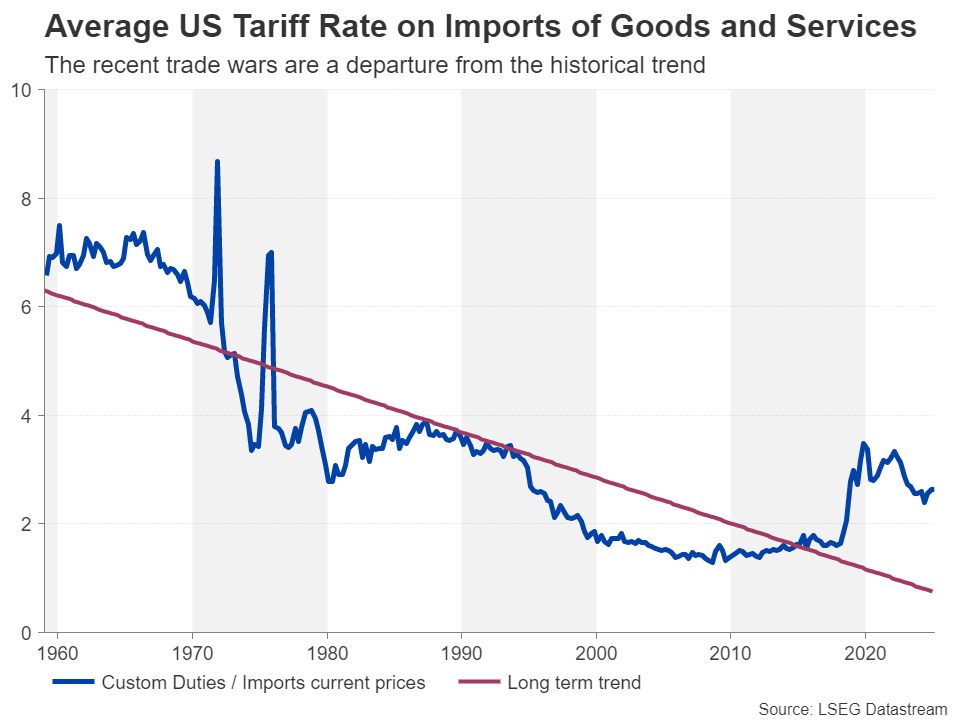
Close ally Japan settled for 15% tariffs, Vietnam has been forced to make do with a 20% rate in its deal, while Indonesia’s 19% levy is also almost double the 10% universal duty. More significantly, Trump is threatening its key trading partner, the European Union, tariffs of 30%.
The prospects of lower tariffs for Mexico and Canada are also not great, as Trump has signalled tariffs of 30% for the former and 35% for the latter for goods not covered under the USMCA pact. Moreover, the White House also seems to have set its sights on a blanket levy that exceeds 10% on the remaining, mostly smaller nations that have yet to be notified of their tariffs in a letter.
Are markets hoping for the best?
The hope is that the big trading partners like the EU, Mexico, Canada and India will reach favourable deals that resemble the one that the US signed with the UK before the August 1 deadline. If that turns out to be the case, then there’s a good chance that inflation will rise only modestly over the coming months before falling back. This would pave the way for the Fed to resume its easing cycle in September, as many policymakers are currently flagging.
But what would happen if Trump doesn’t back down over his threats and the average tariff rate on the majority of imports entering the US is set well above 10% and further steep sectoral tariffs are announced? At the moment, all the indications are that businesses are absorbing much of the higher import charges while passing on the remaining costs onto the consumer. If those costs increase further, it will be more difficult for them to absorb the additional expenses and more of the burden will fall on the consumer.
This risk supports the Fed’s caution and the concerns of the more hawkish FOMC members who fear that tariffs may lead to a more persistent pickup in prices. The hawks might even push for a rate increase if inflation continues to accelerate towards the year end instead of receding.
A pause is probably the Fed’s only option
On balance, however, the Fed’s wait-and-see stance appears to be the right one, as the upside risks to inflation far outweigh the downside risks to growth at this point. But this could change, while a handful of market participants think the economy is already headed for recession and are therefore arguing that the Fed has fallen behind the curve.
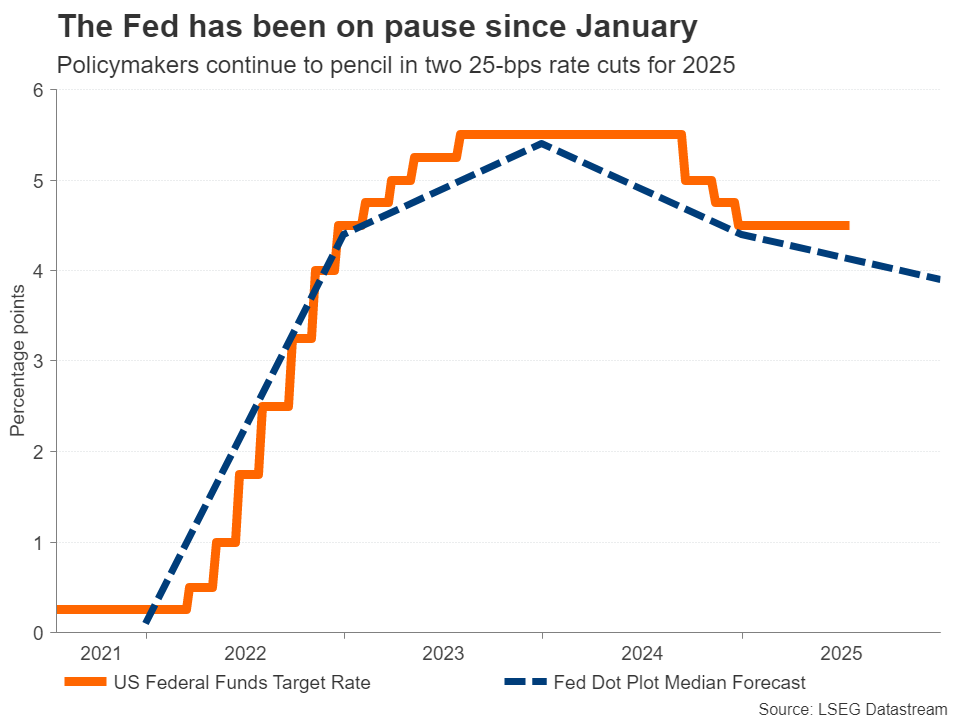
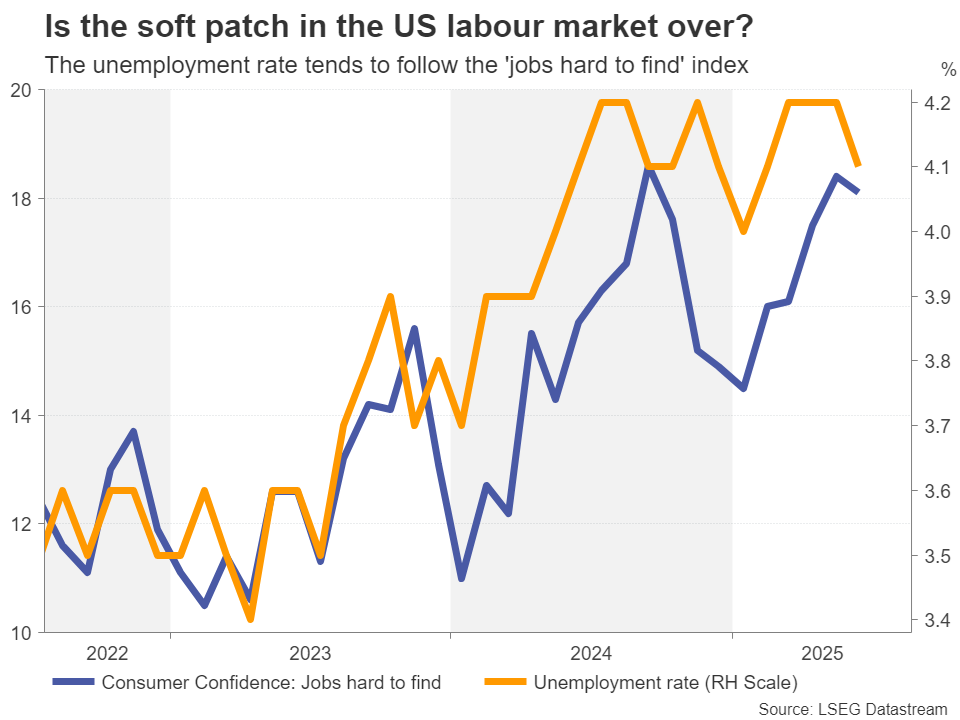
Looking at the data, there is no conclusive evidence either way that the economy, or specifically the labour market, is in grave danger. Whilst there’s been a notable slowdown in the jobs market, more recently, there appears to be some stabilization. The unemployment rate edged lower to 4.1% in June, potentially peaking at 4.2%. A similar trend can also be observed with a key subindex of the Conference Board’s consumer confidence survey – the jobs hard to find index. Weekly jobless claims have also fallen lately, further underscoring the view that although hiring has slowed, there are no mass layoffs as of yet.
Other indicators are a bit worrying though, such as the ISM’s employment indices for manufacturing and services, both of which have been in contraction territory for much of the past four months. Consumer spending has also been weakening, while the once red-hot housing market is undergoing a soft patch of its own.
Disinflation risks may be underrated
But the arguments for the Fed to cut rates sooner rather than later are not just based around the cooldowns in consumption and the labour market. The inflation hawks may be ignoring some of the disinflationary risks such as the decline in energy prices and China’s deflation problem. Aside from domestic deflationary pressures, China may be inducing price reductions globally by dumping the products it’s no longer able to sell to the US due to the higher tariffs onto other countries.
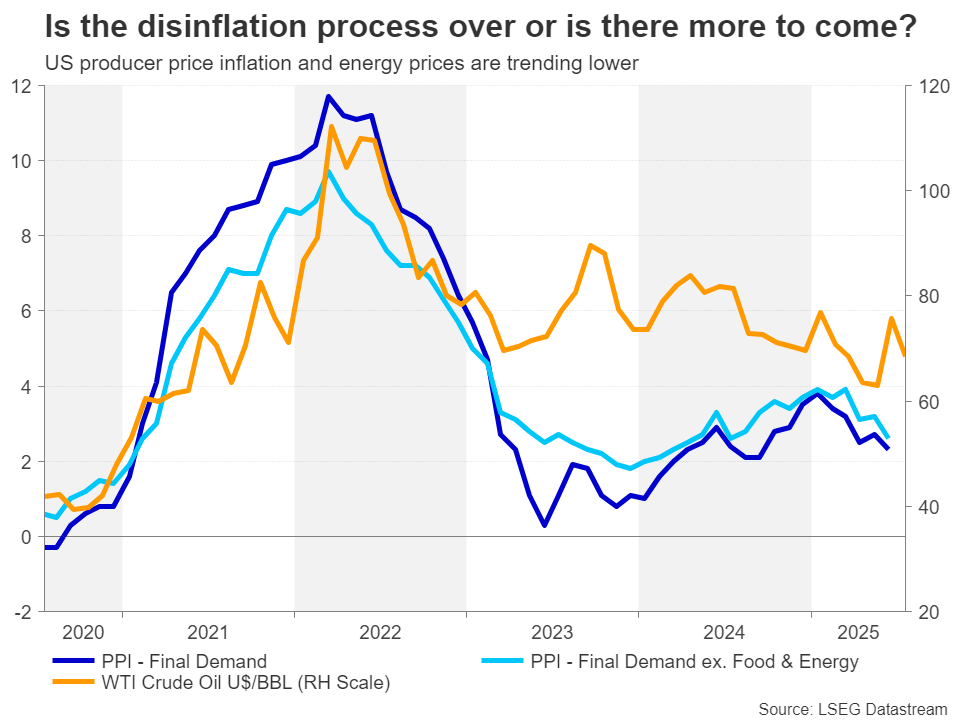
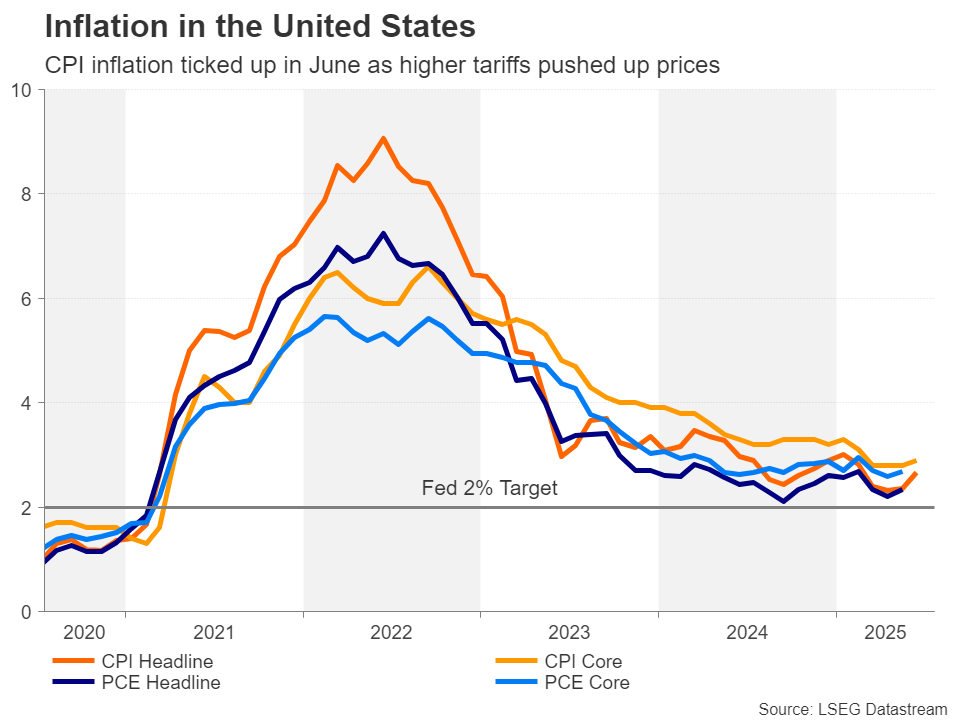
However, with most US inflation metrics still hovering above the Fed's 2% target and core readings printing closer to 3%, Powell’s hawkish inclination is understandable. Another reason for the Fed’s caution has been the upward trend in various measures of inflation expectations. Policymakers will want to see some signs that inflation expectations have peaked on the back of the incoming trade deals before feeling comfortable voting for a rate cut.
Fed’s credibility is at stake
In a stagflationary-type environment such as this, many would argue that the central bank maintaining its credibility on inflation is far more important than preventing a recession, especially when politicians are the source of the economy’s problems. Time will tell if the Fed was prudent to stay on pause for as long as it has, or if Trump’s interference in monetary policy skewed Powell’s judgement in his bid to appear independent from the White House’s influence.
Crypto Market Hesitant to Cross the $4 Trillion Cap Threshold
Market Overview
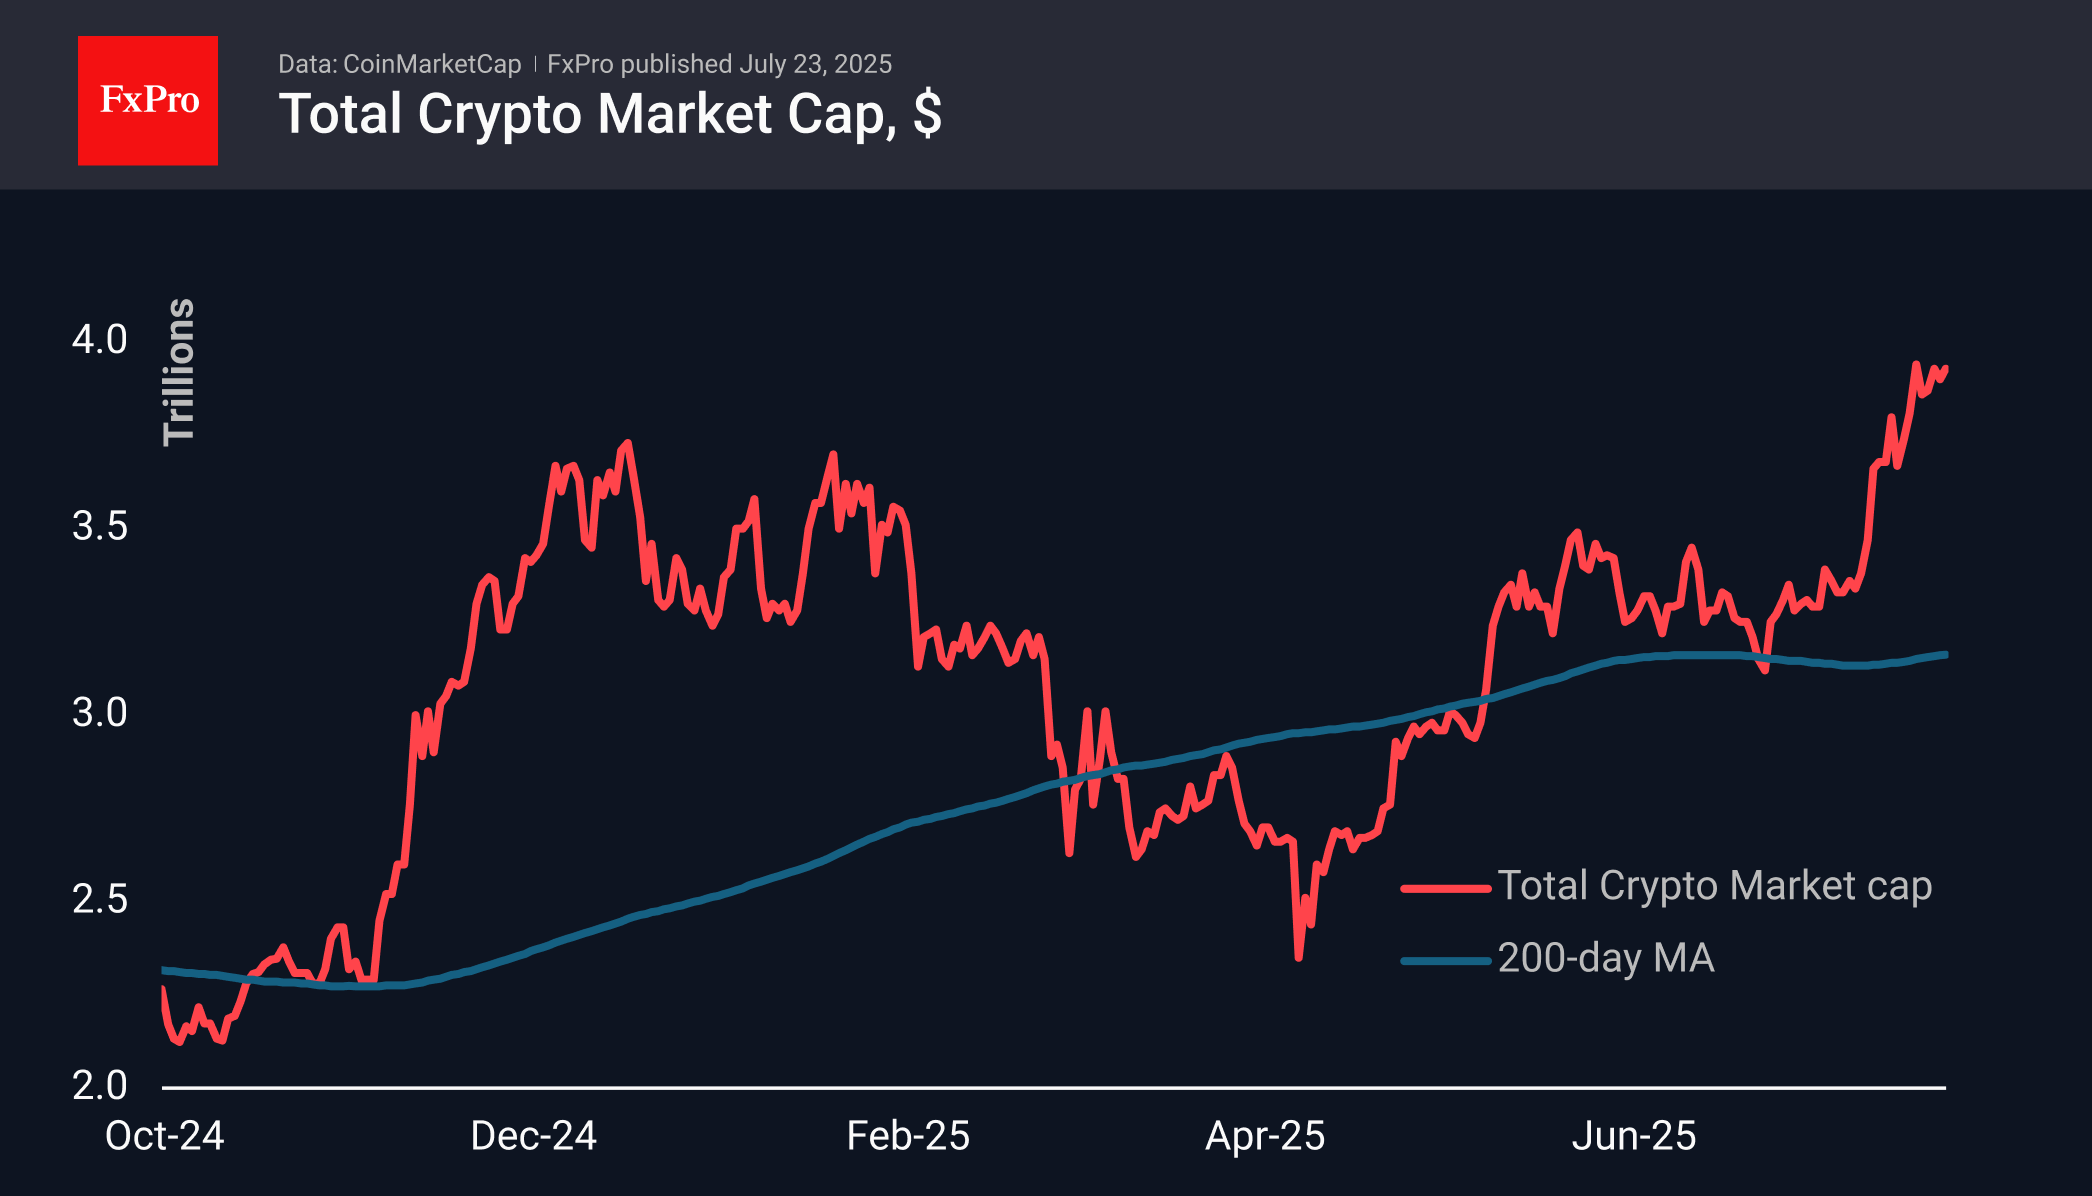
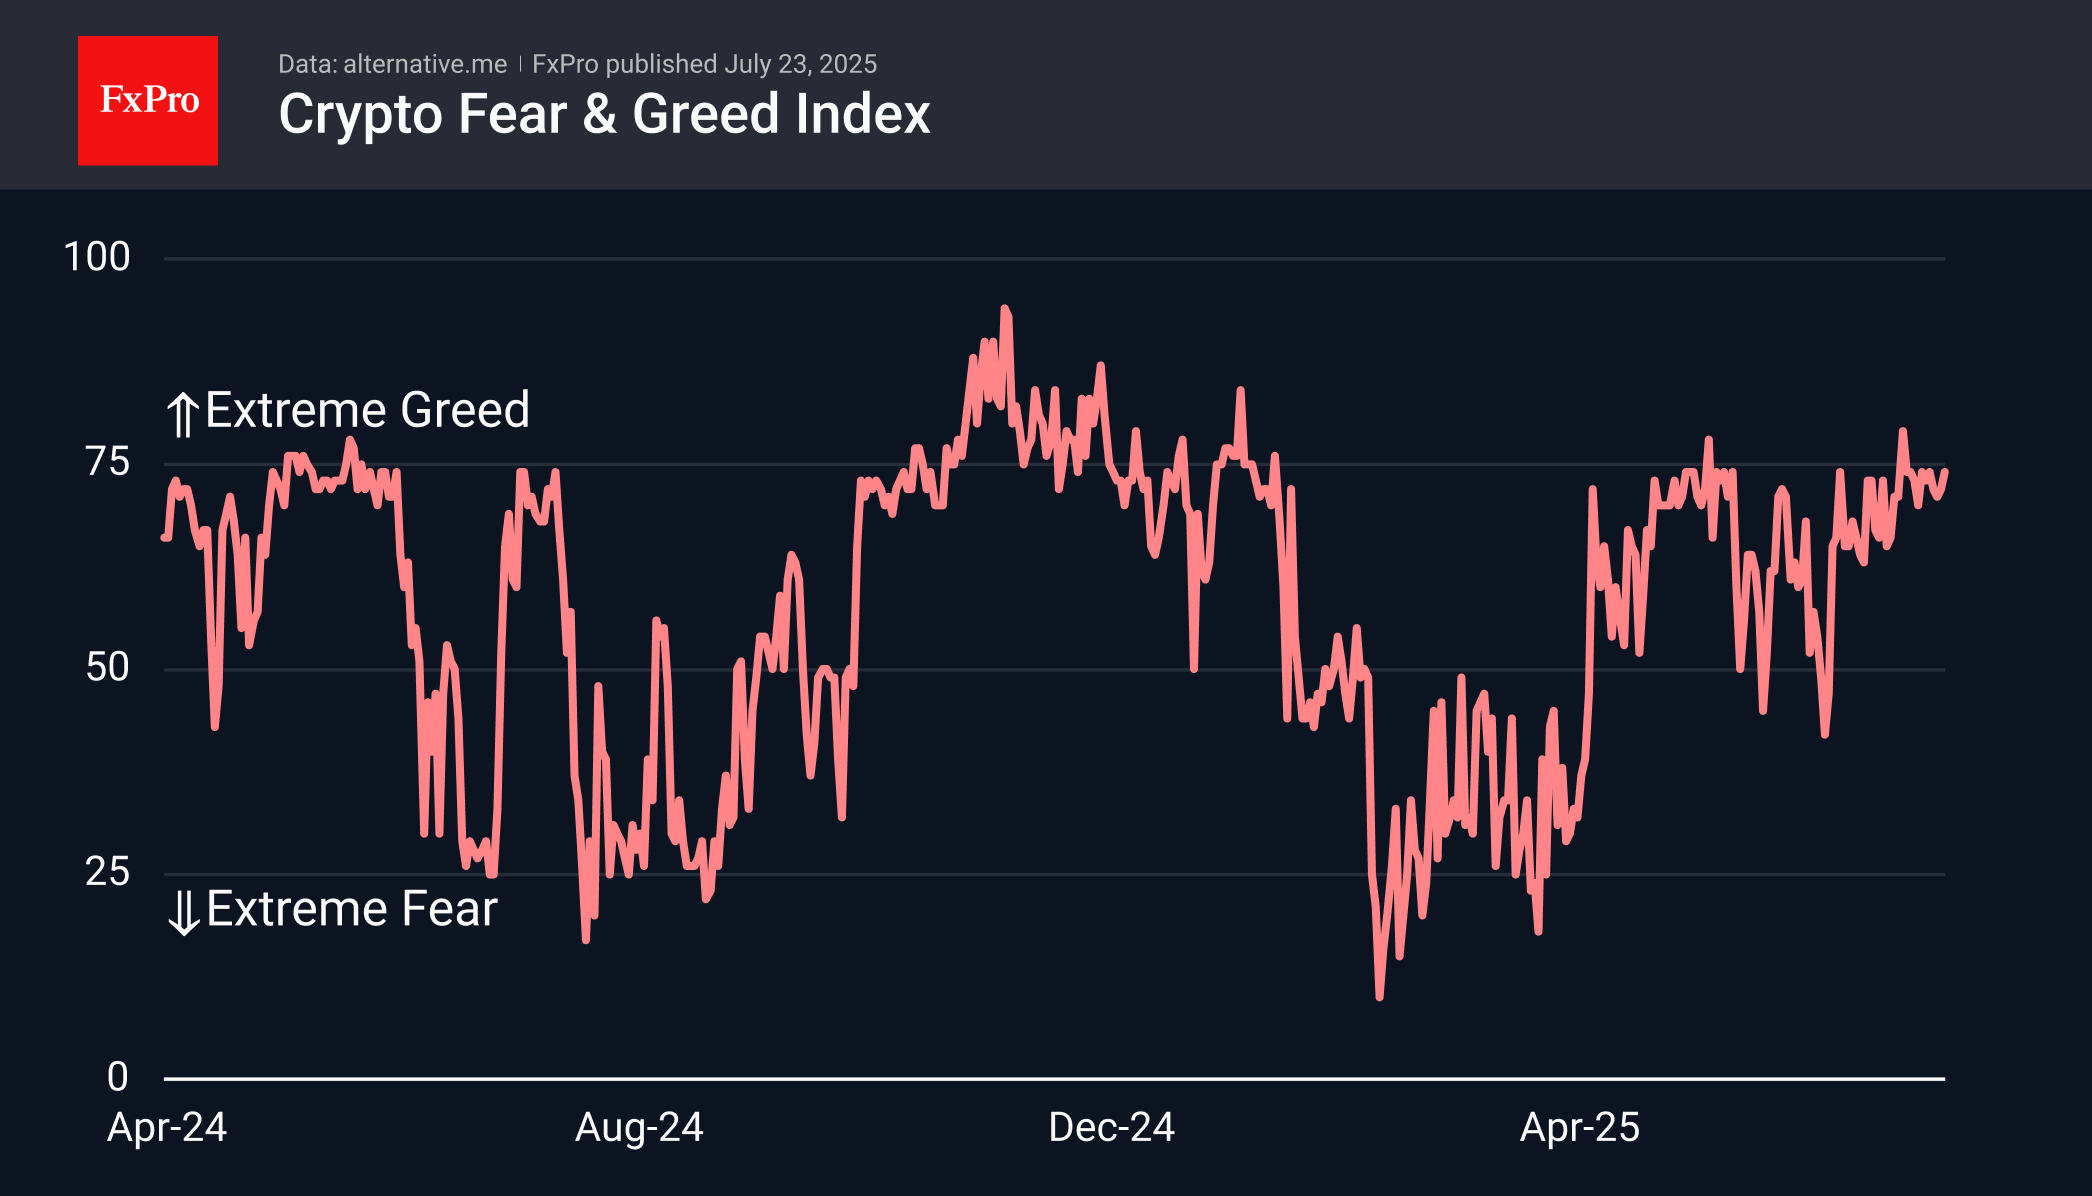
The crypto market cap continues to hover around $4 trillion, hesitant to cross this threshold. It is currently standing at $3.93 trillion. This is reminiscent of the stagnation we also saw at the end of last month. It seems that we are seeing calendar rhythms, with increased inflows at the beginning of the month and caution at the end. Cryptocurrencies are ignoring the positive sentiment on the stock markets: technical factors are temporarily dominating the agenda.
The sentiment index rose to 74, suggesting that bullish sentiment will continue and even strengthen. The lack of new significant reasons on the horizon is preventing cryptocurrencies from entering the territory of extreme greed (>75). Such a reason could be the approval of an ETF with staking or the expansion of the set of altcoins in exchange-traded funds.
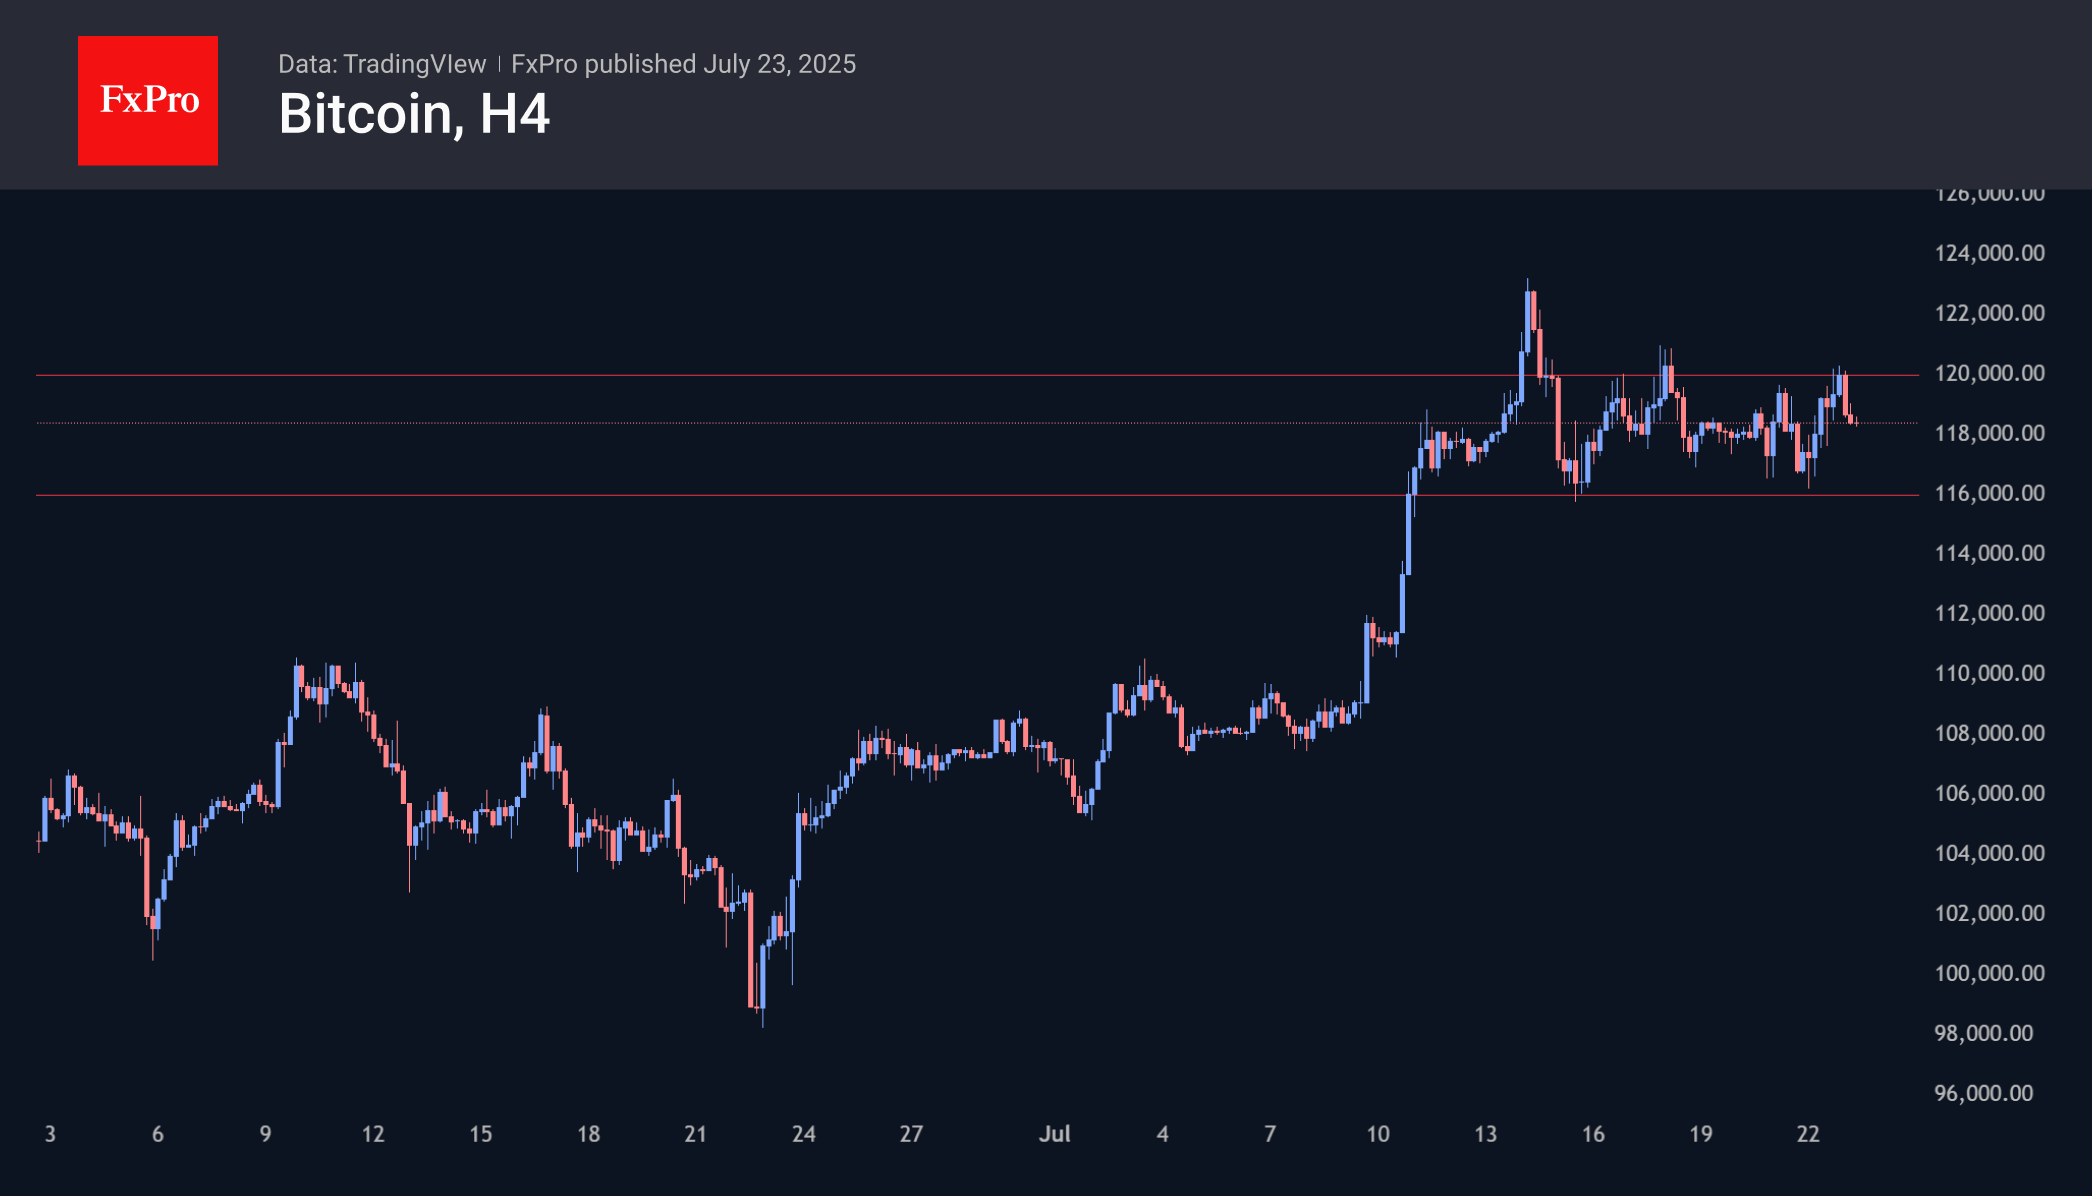
Over the past 24 hours, Bitcoin has moved from the lower to the upper limit of the $116-120K trading range and has again rolled back to its centre. This dynamic confirms the market consolidation pattern. However, this inability to grow further is now affecting altcoins, where upward movement has similarly stalled.
News Background
Dogecoin jumped 40% in a week amid growing chances of the launch of spot Dogecoin ETFs. In addition, mining company Bit Origin announced a strategy to replenish its DOGE reserves by $500 million. The firm has already made its first purchase of $40.5 million.
Strategy additionally purchased 6,222 BTC last week at an average price of $118,940, according to Michael Saylor. The company now owns 607,770 BTC at an average price of $71,755 and a total value of over $43 billion.
SharpLink Gaming, led by Ethereum co-founder Joseph Lubin, purchased 79,949 ETH for $258 million last week. The average purchase price was $3,238 per coin.
The largest US crypto exchange, Coinbase, has launched trading in perpetual futures on Bitcoin and Ethereum for US users. US traders previously did not have access to perpetual futures due to a complex regulatory framework.
The non-custodial TON Wallet is now available to US residents. Wallet options include cryptocurrency transfers in Telegram chats, built-in trading and analytical tools, staking, transaction signing, direct deposit, and withdrawal of funds to bank cards.
Nikkei 225 Index Surges Above 41,000 Points
As the chart indicates, the value of the Nikkei 225 stock index (Japan 225 on FXOpen) has risen above the 41,000-point level — its highest mark since July 2024.
The primary bullish driver is the conclusion of a trade agreement between the United States and Japan. According to media reports, the deal will involve Japan paying a 15% duty on exports to the US, down from the previous 25% tariff. Shares of automotive companies are among the top gainers on the Japanese stock market.
European stock indices have also risen, as EU officials are scheduled to visit Washington on Wednesday, raising hopes for a potential US-EU trade agreement.
Technical Analysis of the Nikkei 225 Chart
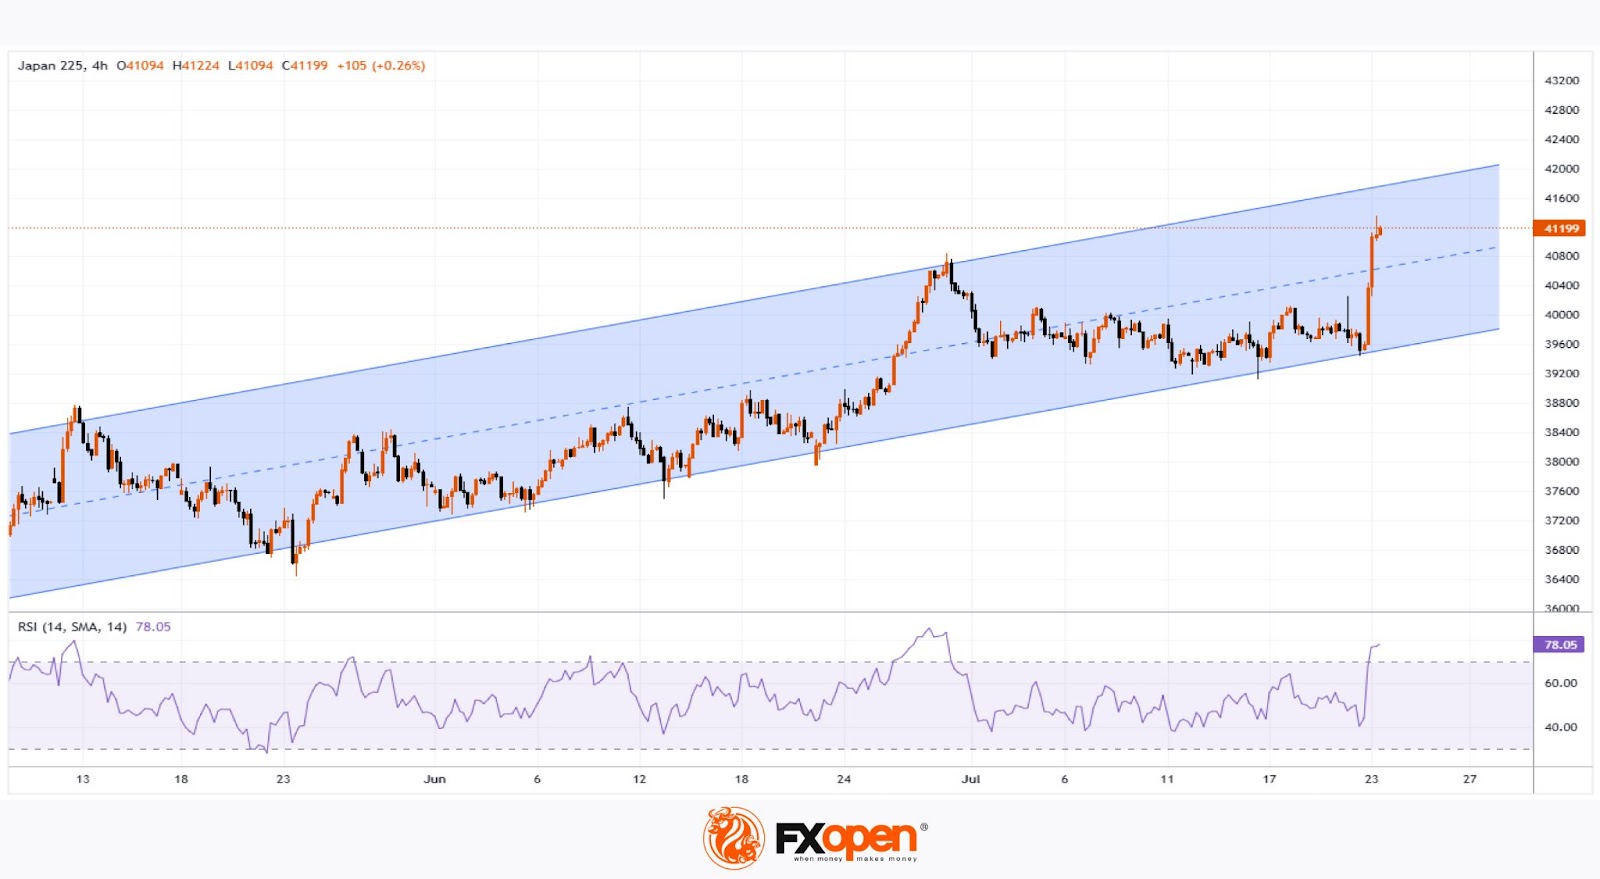
Approximately a month ago, we outlined an ascending channel based on the price fluctuations observed in 2025. This formation remains relevant, and:
→ The price has moved into the upper half of the channel, suggesting that the median line may act as a support level going forward.
→ The nature of the latest price action is worth noting: as an immediate reaction to the news of the deal, two long bullish candles formed on the chart. However, once the price reached its 2025 high, upward momentum slowed sharply.
→ The RSI indicator signals overbought conditions.
Thus, it is reasonable to assume that, following an approximate 3.6% surge over an eight-hour period, the bullish momentum may have largely been exhausted. Nikkei 225 (Japan 225 on FXOpen) could now be vulnerable to a pullback, potentially towards the median line. Nonetheless, the ultimate direction will be shaped primarily by fundamental news.
Trade global index CFDs with zero commission and tight spreads. Open your FXOpen account now or learn more about trading index CFDs with FXOpen.
This article represents the opinion of the Companies operating under the FXOpen brand only. It is not to be construed as an offer, solicitation, or recommendation with respect to products and services provided by the Companies operating under the FXOpen brand, nor is it to be considered financial advice.
XAU/USD Chart Analysis: Volatility at Its Lowest in a Year
When analysing the XAU/USD chart last week, we:
→ noted that the ADX indicator had reached its lowest level since the beginning of 2025 – a clear sign of declining gold price volatility;
→ highlighted the formation of a large-scale triangle with its axis around the $3,333 level, bounded by a resistance line (marked in red) and the lower boundary of the ascending channel.
Since then, the price has climbed above $3,400 – reaching its highest level since mid-June. According to media reports, the uptick in demand may be driven by escalating geopolitical risks, renewed optimism regarding potential monetary policy easing in the US, and consistent gold buying from central banks.
This suggests that the balance has shifted in favour of the bulls, who have made an attempt to break through the resistance line – an attempt that, so far, appears promising and points towards a potential resumption of the upward trend.
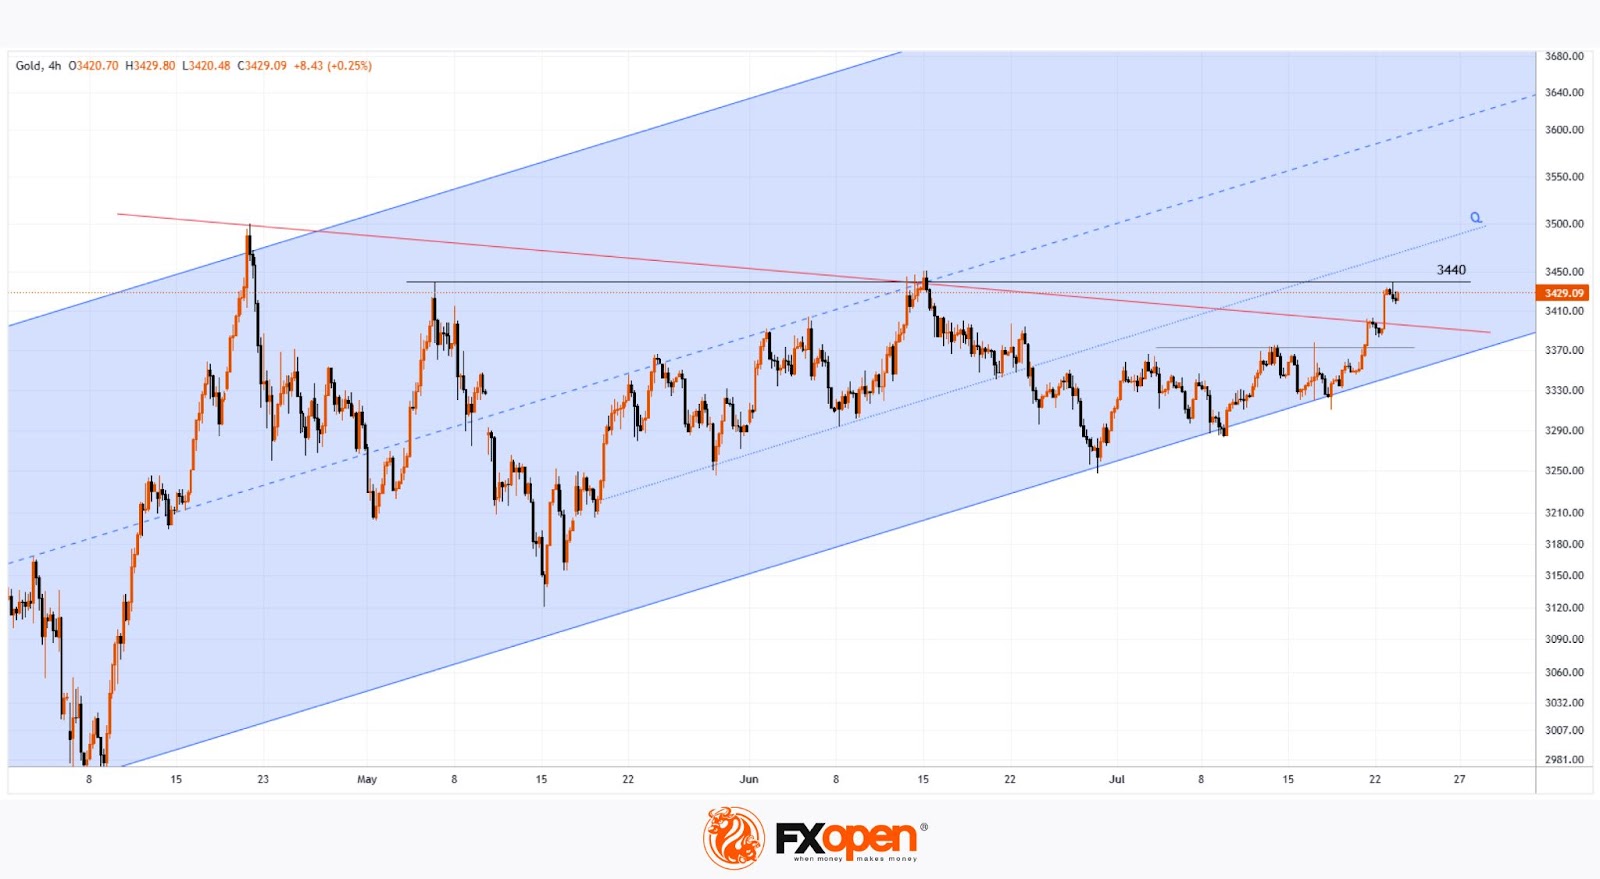
However, today's XAU/USD chart shows that the bulls are now facing a key resistance level at $3,440 – a level that has reversed gold prices downward both in May and June. What will happen in July?
It is possible that, following a prolonged consolidation near the lower boundary of the channel, the bulls have built up sufficient momentum to finally break through this critical level and push gold prices towards line Q, which divides the lower half of the long-term channel into two quarters.
Start trading commodity CFDs with tight spreads. Open your trading account now or learn more about trading commodity CFDs with FXOpen.
This article represents the opinion of the Companies operating under the FXOpen brand only. It is not to be construed as an offer, solicitation, or recommendation with respect to products and services provided by the Companies operating under the FXOpen brand, nor is it to be considered financial advice.
AUD/USD: Rises Further on Fresh Risk Appetite
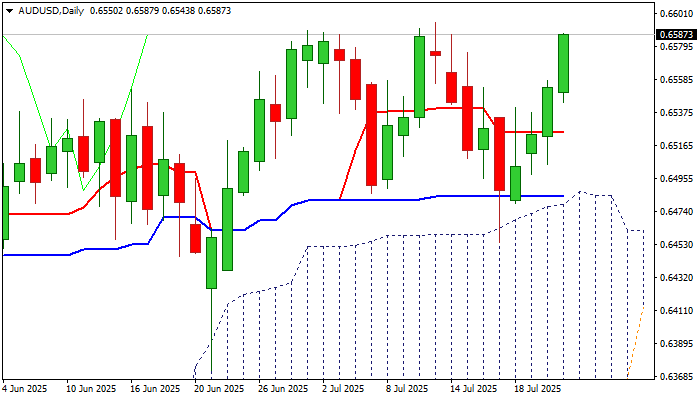
AUDUSD kept firm tone and accelerated higher on Wednesday, extending its latest bull-phase into fourth straight day.
The pair hit the highest levels in over one week, lifted by announcement of US-Japan trade deal that fueled fresh risk appetite.
Bulls pressure 2025 peak at 0.6595 (July 11), violation of which would signal an end of four-week consolidation phase and bullish continuation, with 0.6700 (Fibo 76.4% of larger 0.6942/0.5914 downtrend) expected to come in focus.
Daily studies turned bullish (14-d momentum broke into positive territory / MA’s in full bullish setup / action underpinned by thick daily Ichimoku cloud), however, hesitation at 0.6595 pivot cannot be ruled out as stochastic entered overbought zone.
Potential dips should find ground above daily Tenkan-sen (0.6525) to keep fresh bulls intact.
Res: 0.6595; 0.6628; 0.6648; 0.6682.
Sup: 0.6558; 0.6543; 0.6525; 0.6487.