Sample Category Title
Gold Retraces Slightly But Holds Near Historic Levels
The precious metal has seen a major bounce in the past two days but is currently seeing some heavy selling after the US-Japan Tariff Deals have been reached.
In prior sessions, Gold was profiting from the selloff in the US Dollar but the dynamics have changed today as sentiment on global trade outlook is turning more positive.
Silver, Copper and Palladium are still moving upwards but Platinum and Gold are struggling today.
Let's take a look at multiple timeframes to spot the zones of interest to gain your edge.
Gold multi-timeframe Technical Analysis
Daily Chart
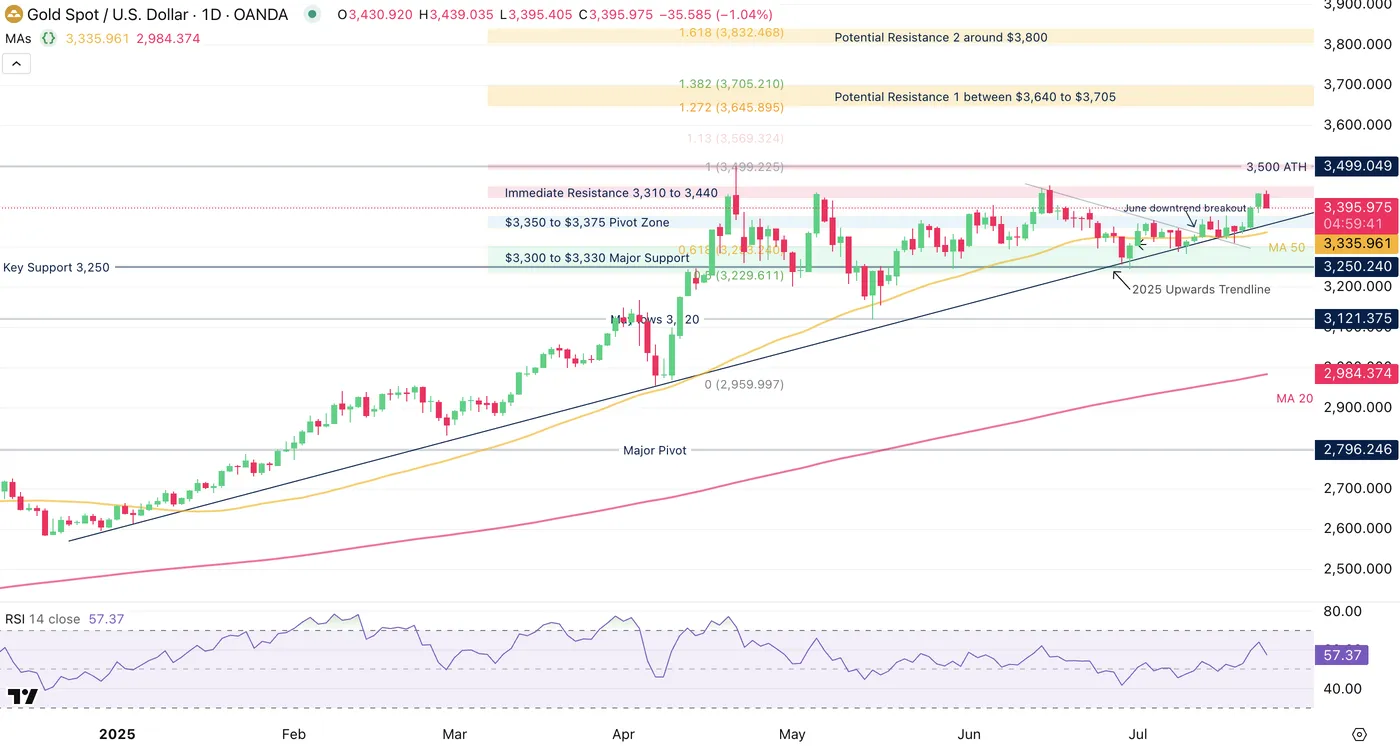
Gold Daily Chart, July 23 2025 – Source: TradingView
Since our preceding analysis, the precious metal had formed multiple small scale bounces on the 2025 upwards trendline and thsi led to Monday's impulsive move up.
On the bigger picture however, the price action is mostly rangebound as prices have failed to breach the Key resistances that would at least point towards another visit to its all-time highs ($3,500)
One thing that can't be said however, is that the price action is looking weak – bounces are usually strong and bulls are in control as long as prices hold above the 3,350 Pivot Zone.
Levels of interest for trading:
Support Levels:
- $3,350 to $3,375 Pivot Zone
- 50-Day MA $3,335
- $3,300 to $3,330 Major Support
- $3,000 Longer-run Psychological Support
Resistance Levels:
- $3,439 Daily highs
- Immediate Resistance Zone 3,410 to 3,440
- $3,500 all-time highs
Potential Resistance Zones in the case of an upside breakout, from Fib Extensions:
- Potential Resistance 1 between $3,640 to $3,705
- Potential Resistance 2 around $3,800
Gold 4H Chart
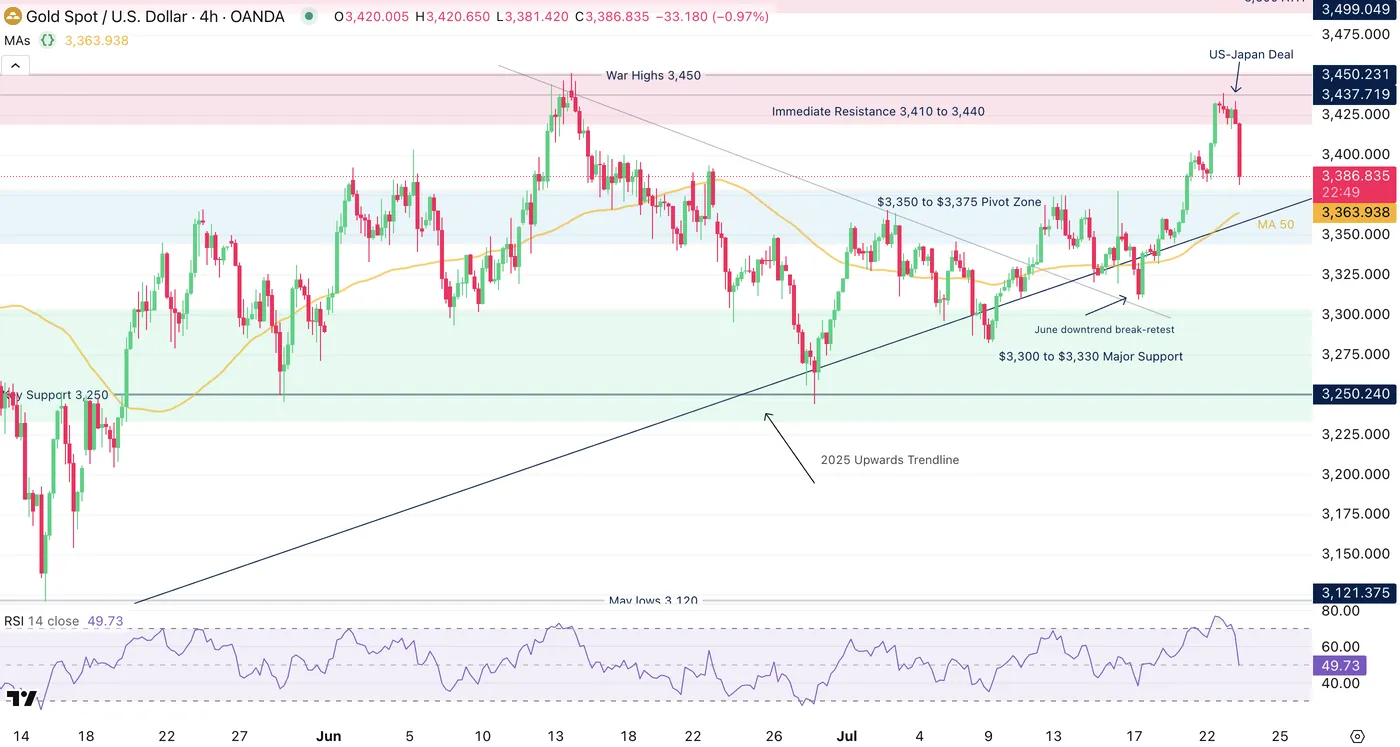
Gold 4H Chart, July 23 2025 – Source: TradingView
Looking closeer, we see how the deal led to the ongoing strong 4H Bear candle after marking daily highs at 3,439, bringing back 4H RSI momentum to neutral
The move from the past few days has been strong but before prices actually breakout, the range is still confirmed.
With prices holding above the Current Pivot Zone, the ball is still in the buyers' hand, with the 4H 50-period MA (currently at 3,363) being a key barometer for the intermediate trend.
If bears fail to close the session around or below the Pivot Zone, bulls will stay in control.
30m Chart
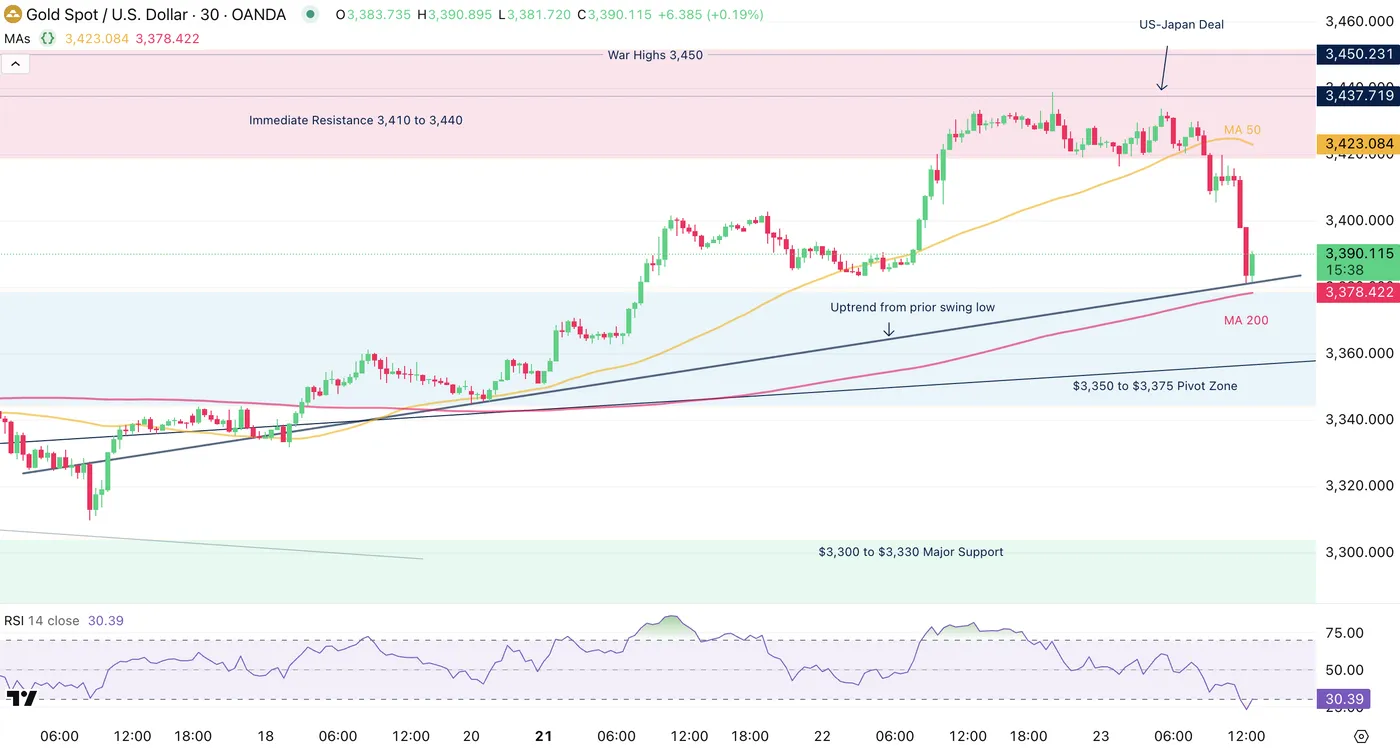
Gold 30m Chart, July 23 2025 – Source: TradingView
Looking closer to the 30-minute chart, the selloff that had started in the past 2 hours is finding some support at the upward intraday trendline formed after the last swing low.
Prices are contained between the 2 key 30m MAs, with the 50 acting as resistance ($3,423) and the 200 acting as immediate support (3,378) – Spot for the breaching of any of these two for relative measurement of bull and bear strength
Safe Trades!
Pump-Fake from US Dollar
One of the themes that had driven markets since the beginning of the month was the US Dollar recovering some strength which marked some tops and bottoms for many Currency pairs.
Starting the 1st of July and amplified by a streak of positive data, the Greenback saw its heavy-selling positioning reverse largely.
Particularly after the NFP report and the July CPI, most flows surrounded a re-shifting of funds back towards the US which notably propelled the Nasdaq and S&P 500 through multiple all-time highs.
This USD strength seems to have been just a temporary retracement however, with the Dollar Index having sold off close to two handles from its Thursday swing high (98.50 highs, currently around 97.20) – That move had much more influence in Forex than stocks.
As a matter of fact, the Dow Jones is flying and trying to catch up to its peers. The industrial-focused index just breached the 45,000 Key landmark and is coming closer to its all-time highs. You can take a look at an in-depth analysis of the Index right here:
Since the last mid-week report, there hasn't been much in terms economic data for either the US or Canada except for a strong beat in US Retail Sales last Thursday (0.6% vs 0.1% expected) which further boosted the run in Equities but did not prevent the profit taking that happened on last Friday.
Although, the week is far from over and between PMI releases and key earnings, Markets should still await some volatility.
North-American Indices Performance
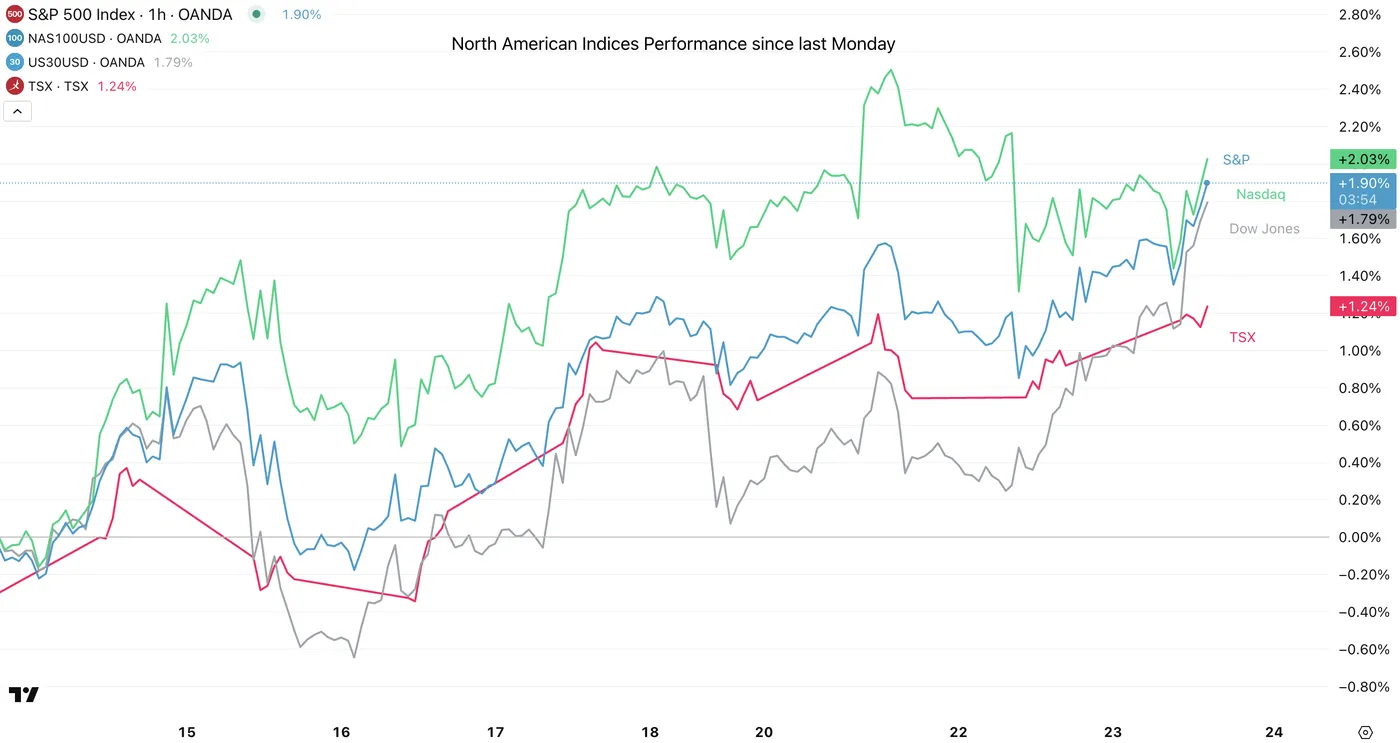
North American Top Indices performance since last Monday, July 23, 2025 – Source: TradingView
The S&P 500 is taking the crown since last Monday, with some choppy retracements but strong bullish moves.
On the current rewiring however, the Dow Jones is catching up with its peers relatively fast – Something to keep in check for the upcoming weeks.
US Dollar Mid-Week Performance vs Majors
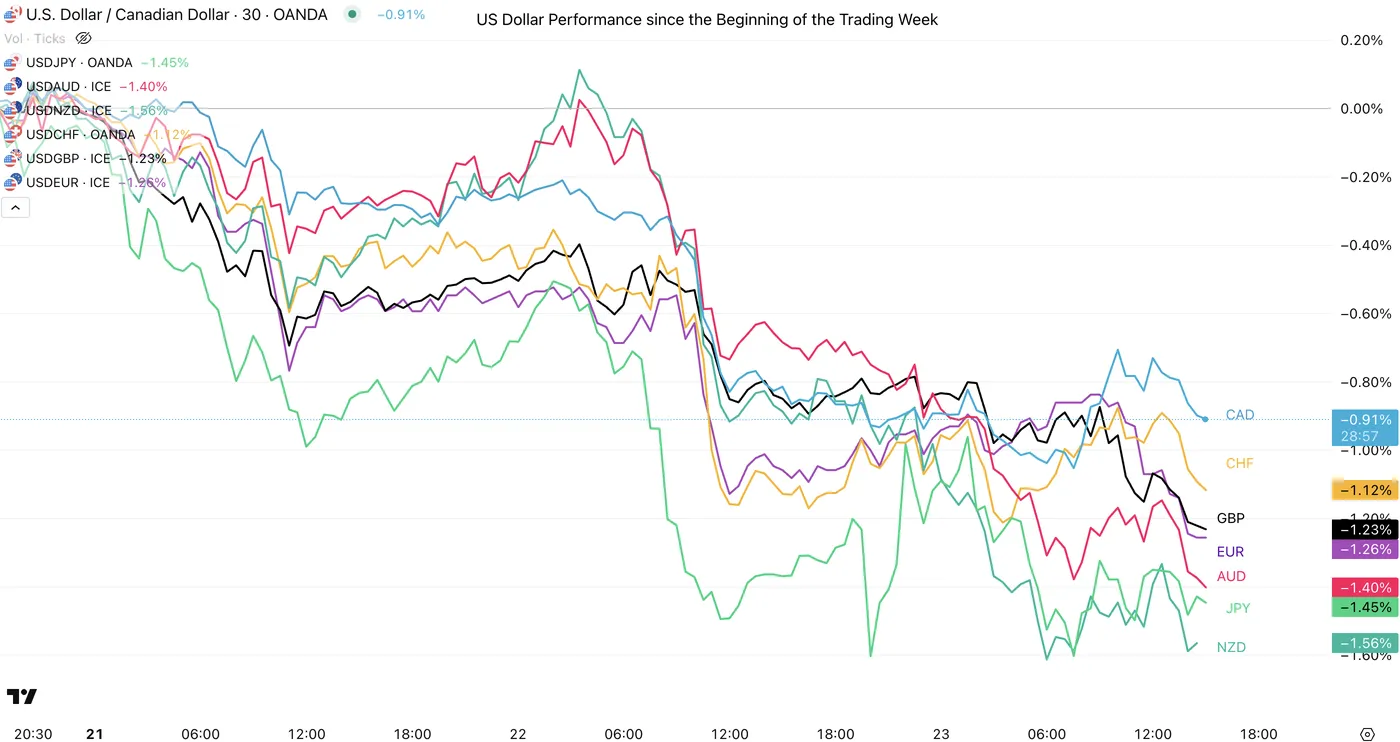
USD vs other Majors, July 23, 2025 - Source: TradingView.
There hasn't been much pity for the Greenback as it gave up most of its gains, back towards July 10th levels.
The USD is down between 0.95% to 1.60% against all of its major counterparts.
Canadian Dollar Mid-Week Performance vs Majors
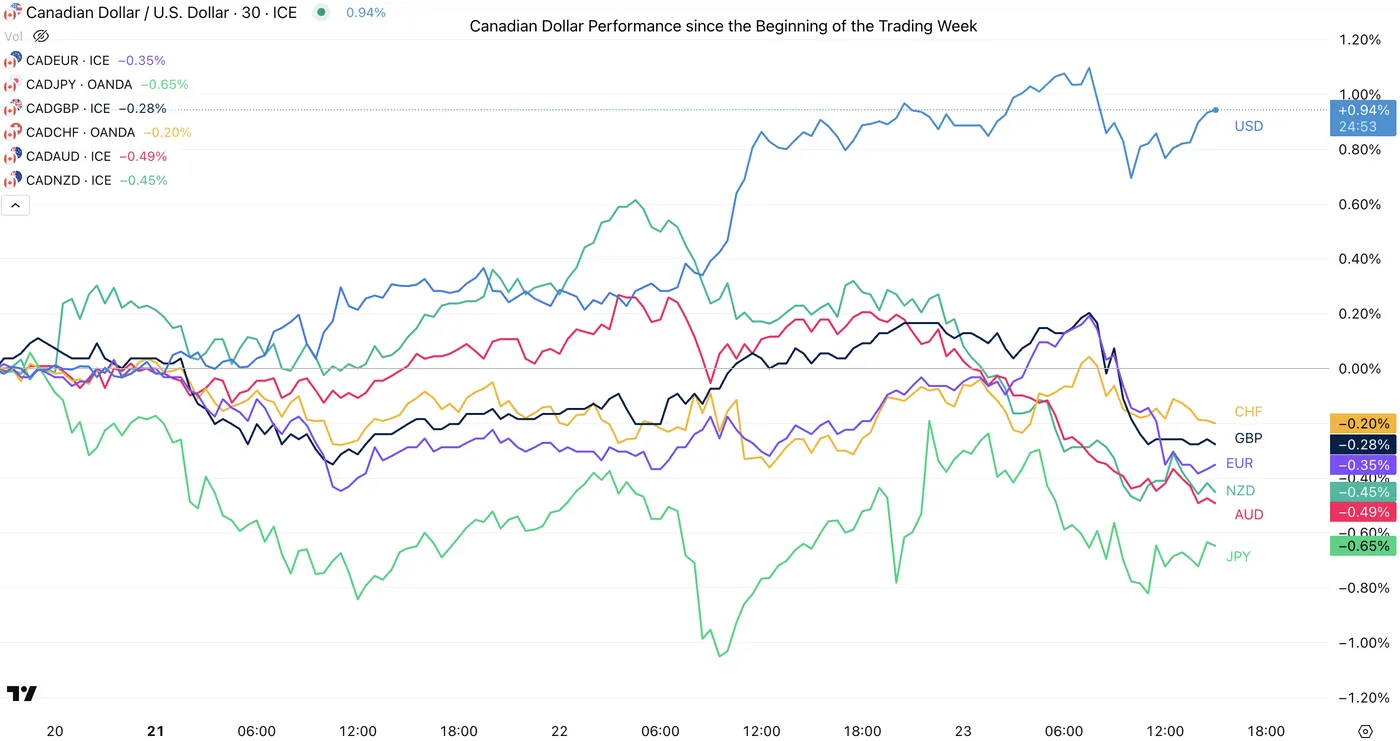
CAD vs other Majors, July 23, 2025 - Source: TradingView.
Its been many weeks now that the Canadian Dollar hasn't seen much independent movement from the US Dollar.
It seems that the ongoing bigger picture in Forex is flows that are moving from Europe to Asia-Pacific Currencies in tandem and dragging both NA Currencies at the same time.
It was almost the contrary last week.
The performance from the Loonie is definitely not as bad as the one from the US Dollar.
Intraday Technical Levels for the USD/CAD
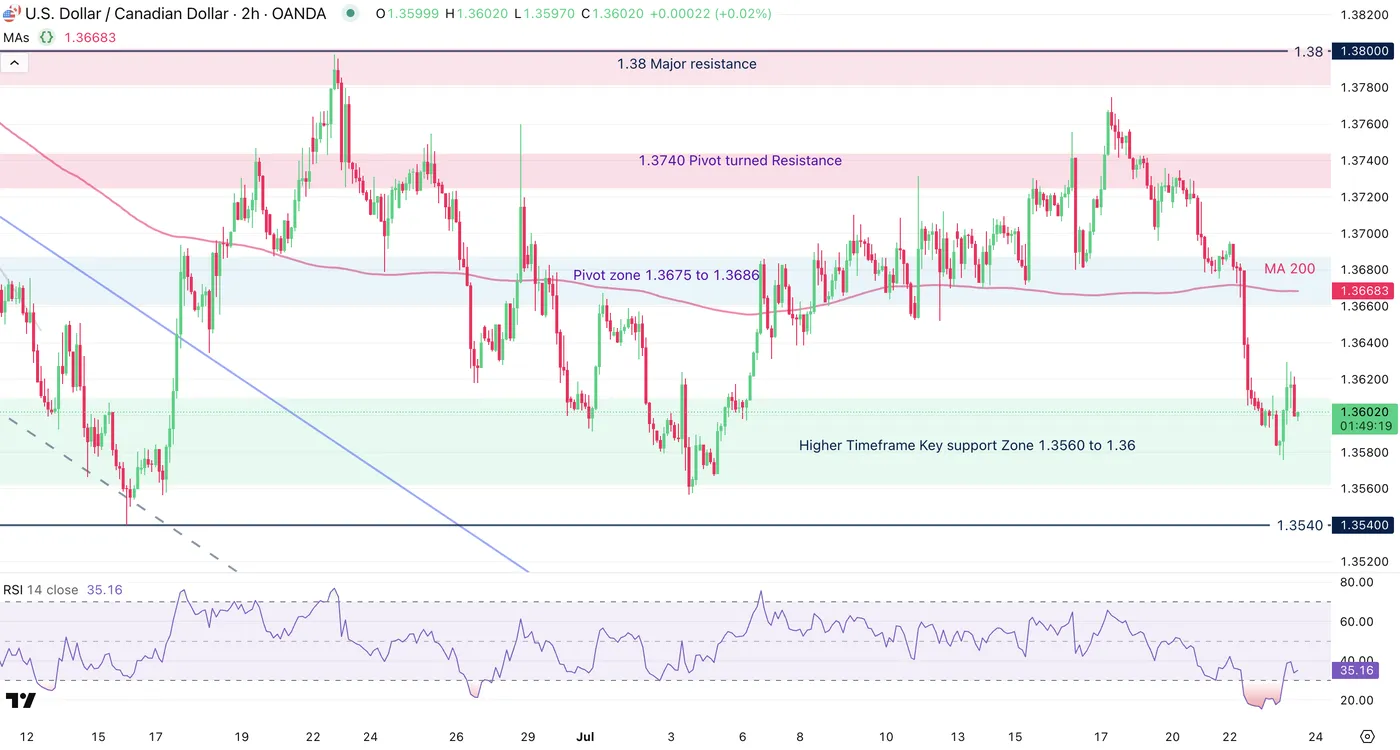
USDCAD 2H Chart, July 16, 2025 – Source: TradingView
Almost nothing has changed since our last analysis of the pair and the action is still rangebound.
The ongoing USD selloff is pretty strong, but odds are not for a breakout as markets tend to consolidate towards incoming key Data (tomorrow will see the release of the US PMIs, more details further in the article)
Support Levels:
- Higher Timeframe Key support Zone 1.3560 to 1.36
- 1.3540 (2025 Lows)
- 1.35 Psychological level
- 1.3450 October 2024 lows
Resistance Levels:
- Pivot zone 1.3675 to 1.3686
- 1.3740 Pivot turned Resistance
- 1.38 Main Resistance
US and Canada Economic Calendar for the Rest of the Week
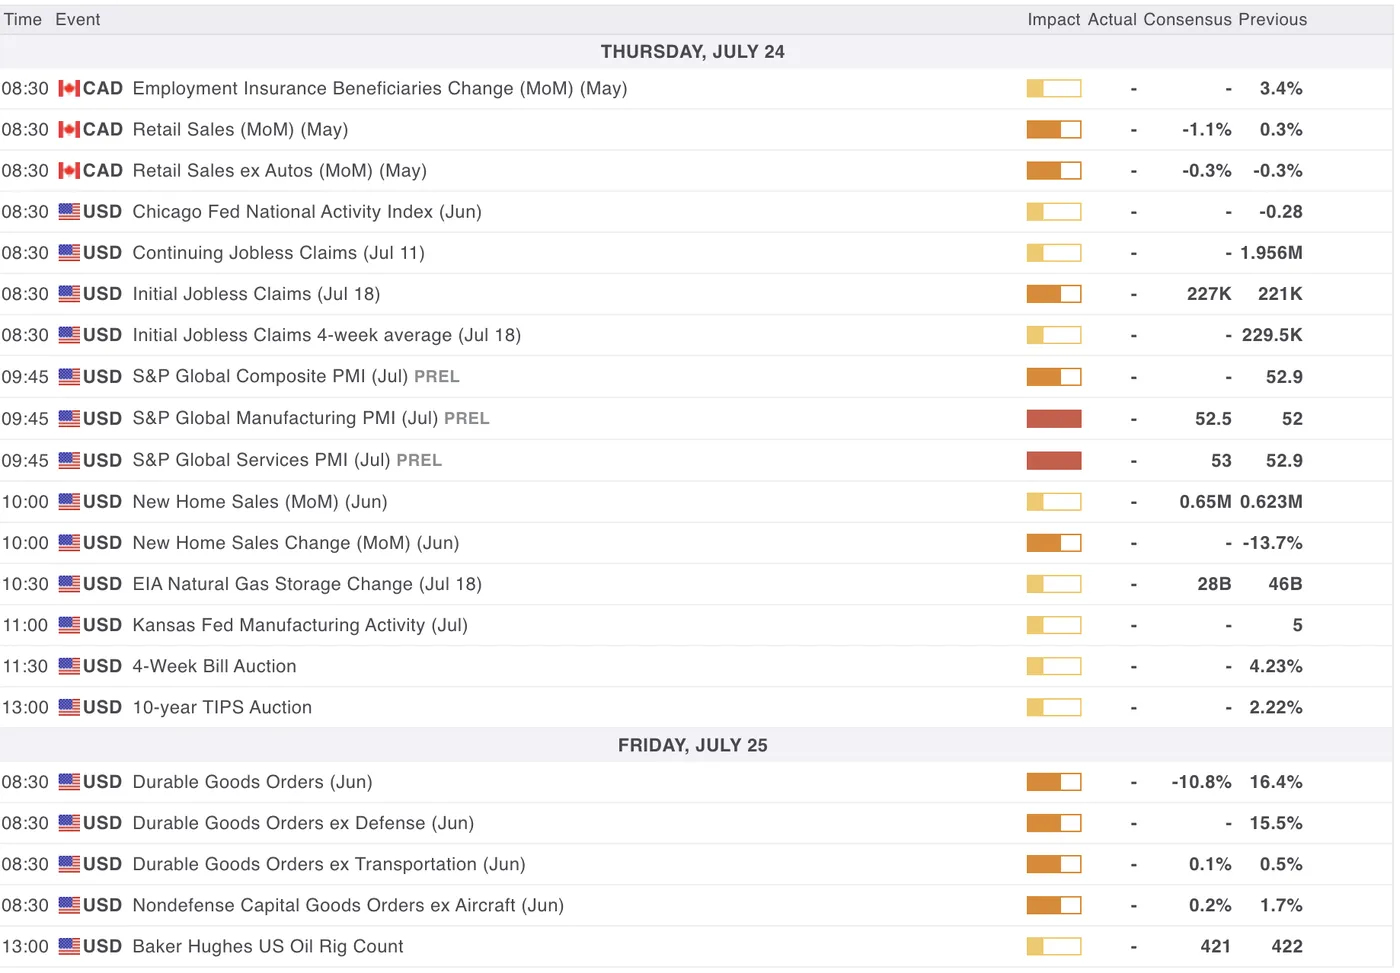
US and Canadian Data for the rest of the week, MarketPulse Economic Calendar
The rest of the week is promised to be more instructive in terms of Economic data releases.
Tomorrow (Thursday 24th) will see the release of Canadian Retail Sales at 8:30 A.M. with the Headline number at -1.1% Consensus.
Do not forget the weekly Jobless Claims (exp 227K)
The day will shortly follow with US Manufacturing (exp 52.5) and Services PMIs (exp 53) at 9:45 A.M. ET.
Friday should be lighter however with mostly the Durable Goods order data, which can be interesting data to look at the impacts of the Trump Policies in further detail.
Oil Traders should also monitor the Baker Hughes Oil Rig Counts at 13:00 on Friday.
Safe Trades for the rest of the week!
Dow Jones Rebalancing Continues After US-Japan Trade Deal
The week has been calm in terms of economic data releases and despite the ongoing Earnings season, Markets have been looking for headlines.
And headlines they received! Yesterday evening saw the announcement of a much anticipated US-Japan Trade Deal that would largely diminish announced tariffs from 25% and more to an actual of 15% on Auto Imports.
You can read more on the deal right here. – Except for wishy-washy trading in USDJPY, Equities have appreciated the news. The Nikkei closed the Asia session up around 4.50% and European stocks have also been lifted by the news.
In the US, the Indices have opened positive but the trend that started in the beginning of the week is currently continuing:
The Nasdaq is seeing some profit-taking and these flows are going towards the Dow Jones, with Futures and CFD prices still positive since the start of the day but the actual open is mixed, seeing some selling.
AT&T have released earnings beating EPS and Revenues by a decent margin, setting the stage for some more confidence in US Stocks.
The Industrial-focused Index has been strong within its ongoing range, and in the waiting of the Alphabet (Google) and Tesla earnings, the relative strength for the Dow is poised to continue.
Dow Jones vs Nasdaq Comparative weekly performance
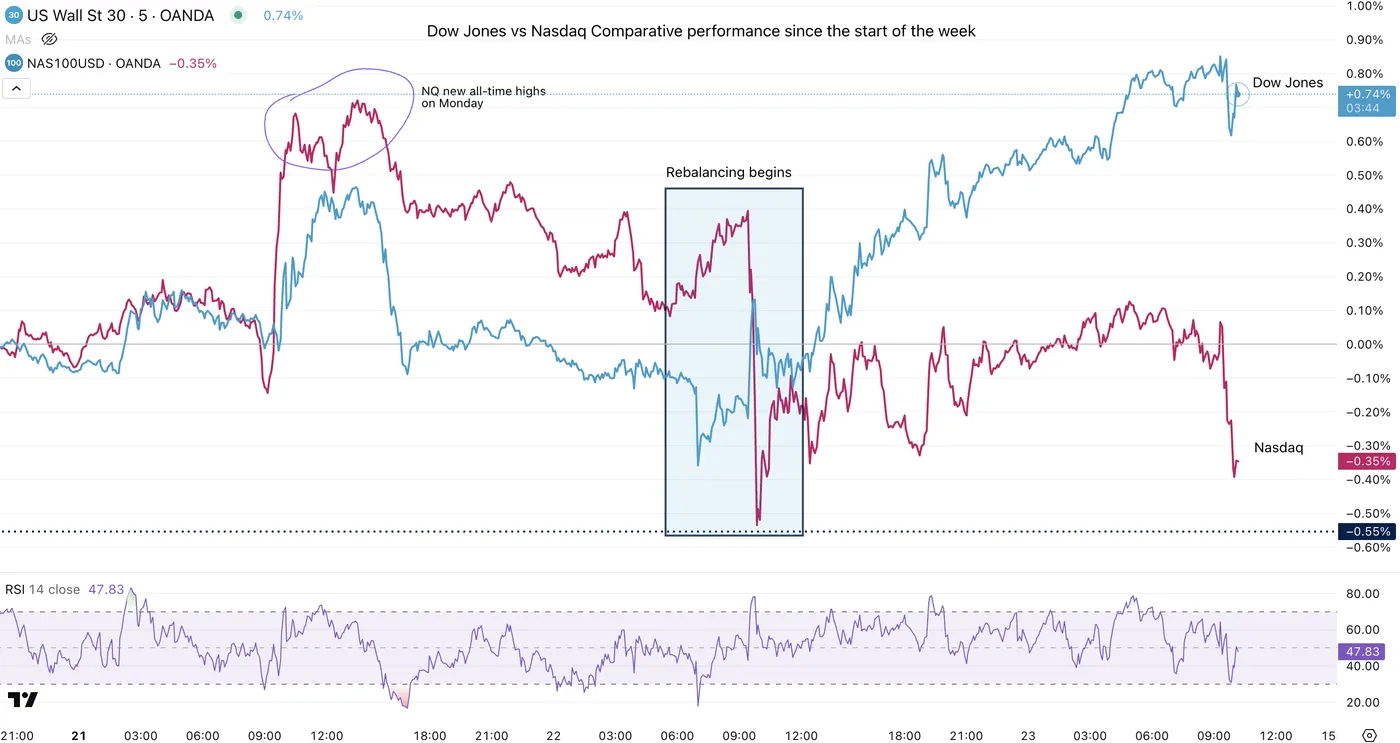
Dow Jones vs Nasdaq Relative Strength, July 23 2025 – Source: TradingView
Tech had started the week on a strong note but since the middle of yesterday's session, there has been some powerful rewiring of positioning in the US Indices, with Tech struggling vs Healthcare, Banking Consumer Cyclical and Defensive stocks – A reverse of the prior year trend.
This is allowing the Dow to shine again in today's session.
Dow Jones Intraday Technical Analysis
1H Timeframe
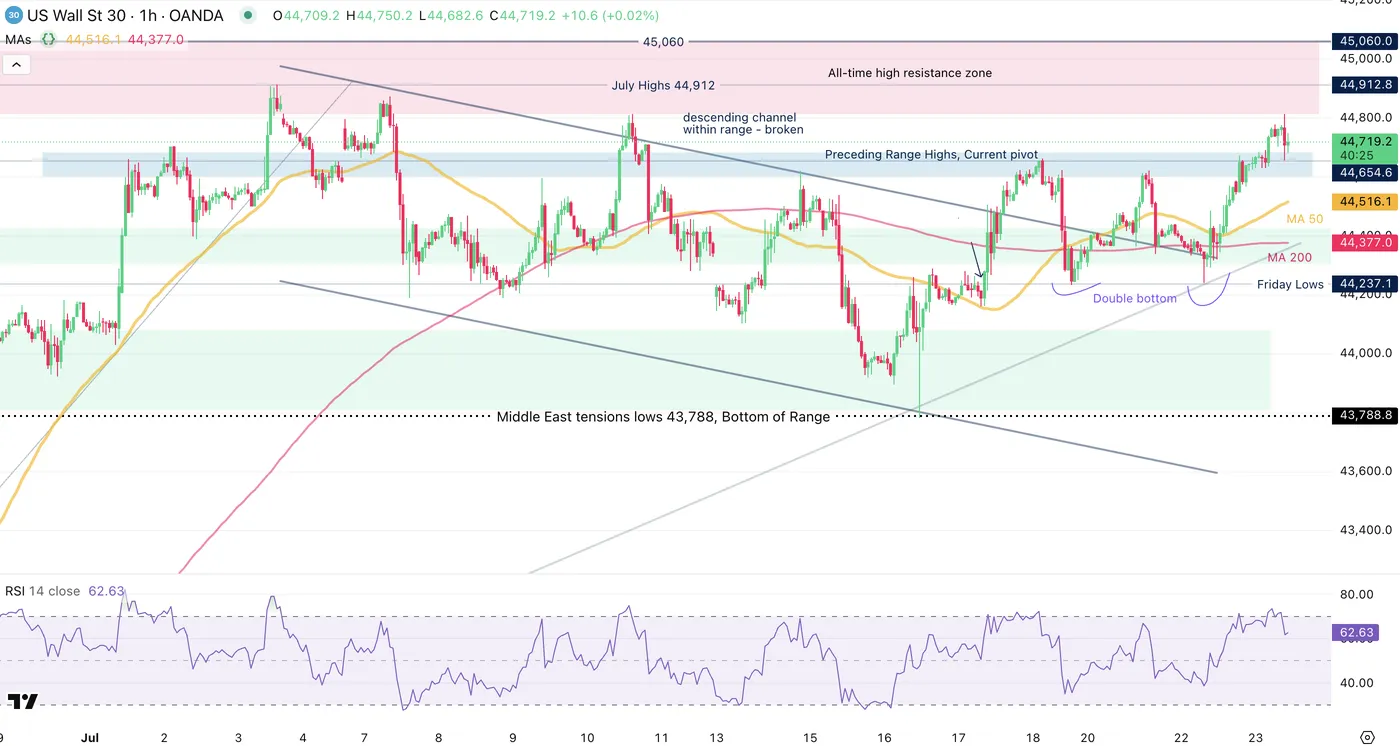
Dow Jones 1H Chart, July 23 2025 – Source: TradingView
The Dow has officially broken out of the descending channel that was occuring within the ongoing July Range (44,912 highs and 43,788 Lows).
With the ongoing relative strength in the US 30, bulls have broken above the 75% percentile of the range on a clear, lower timeframe double bottom and prices are currently consolidating just above this point that was precedently resistance, now pivot.
These levels are:
Support Levels:
- Immediate Pivot (preceding Resistance): 44,600 to 44,700
- 50-Period 1H MA 44,515
- Strong Support on Double Bottom and 200-H MA – 44,200 to 44,300
- 43,780 to 44,100 Major Support
Resistance Levels:
- 44,810 Daily Highs
- 44,912 July Highs
- 45,060 All-time Highs
15M Timeframe
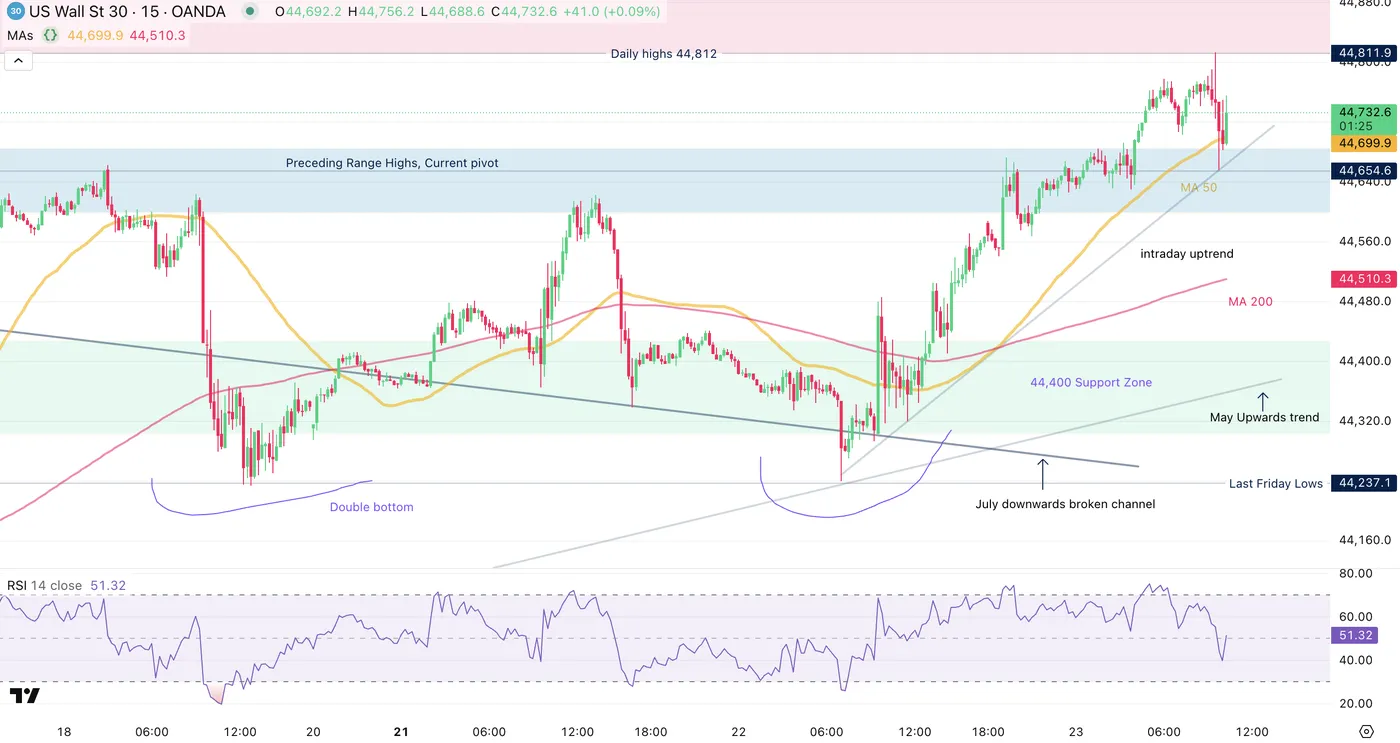
Dow Jones 15m Chart, July 23 2025 – Source: TradingView
Buyers have held a strong intraday uptrend that had formed yesterday afternoon.
RSI Momentum is currently neutral after coming back from overbought, with bulls having to maintain above the Pivot to keep their strong hands – Monitor momentum as the price action is mixed on the lower timeframe but the latest 15m bull candle is a strong one.
Breaking above 44,812 (Daily highs) will point towards the July highs, but after that, there won't be much until the All-time highs.
Failing to hold above the 44,600 to 44,700 Pivot will re-affirm the preceding range and point to more balanced price action.
Safe Trades in the waiting of this afternoon's key earnings!
Euro Rally Fizzles, ECB Expected to Hold Rates
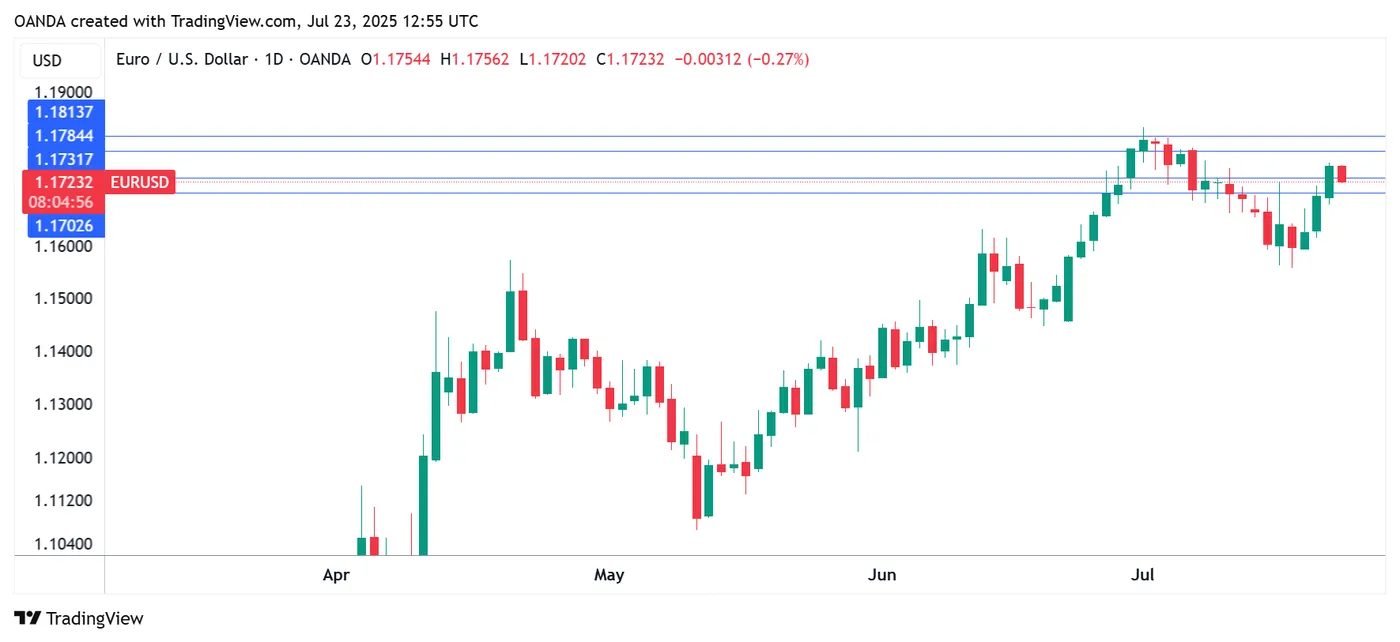
The euro has edged lower on Wednesday after a three-day rally which saw the currency climb 1.4% against the US dollar. In the North American session, EUR/USD is trading at 1.1724, down 0.25% on the day.
ECB projected to hold rates at 2.0% on Thursday
The European Central Bank will announce its rate decision on Thursday and the money markets are widely expecting that the ECB will maintain the key deposit rate at 2.0%.
The ECB has trimmed rates by a quarter-point for seven consecutive meetings. At the June meeting, ECB President Lagarde signaled that the central bank was nearing the end of its easing cycle, which began in June 2024 when the deposit rate stood at 4.05%.
Inflation in the eurozone is largely contained. In June, headline CPI remained steady at 2.0%, the ECB's target, and core CPI was unchanged at 2.3%. These inflation levels would allow the ECB to continue lowering rates but ECB policymakers face the big unknown of President Trump's tariff policy, with no trade agreement yet between the US and the European Union. Trump has threatened the EU with 30% tariffs if no deal is reached by August 1.
The EU has vowed to respond forcefully, saying it will impose a 30% tariff on a range of US goods if Trump makes good on his threat. That could set into motion retaliatory tariffs from the US and trigger an ugly trade war between two of the largest economies in the world. The US and Japan announced today that they had reached a trade deal and there is hope that the EU will follow suit. This would provide much needed clarity for the ECB and make it easier to forecast growth and inflation.
EUR/USD Technical
- EUR/USD is testing support at 1.1731. Below, there is support at 1.1702
- There is resistance at 1.1784 and 1.1813
EURUSD 1-Day Chart, July 23, 2025
WTI Oil: Bears Hold Grip as Trade Issues Continue to Sour sentiment
WTI oil price remains in red for the fourth consecutive day and trading near new three-week low on Wednesday.
Bears hold grip despite a partial relief from announcement of US trade deal with Japan, as dissonant tone come from the EU (the bloc did not reach a deal yet but considering countermeasures on US tariffs) and China, that continues to sour the sentiment.
Markets also focus on the signals of impact from the latest package of EU sanctions on Russia, which mainly target Russian oil industry, as well comments that the US would consider sanctioning Russian oil that are assumed as supportive factors.
Increased supply after Azerbaijan oil exports resumed today after being paused for a couple of days, contribute to existing pressure on oil prices.
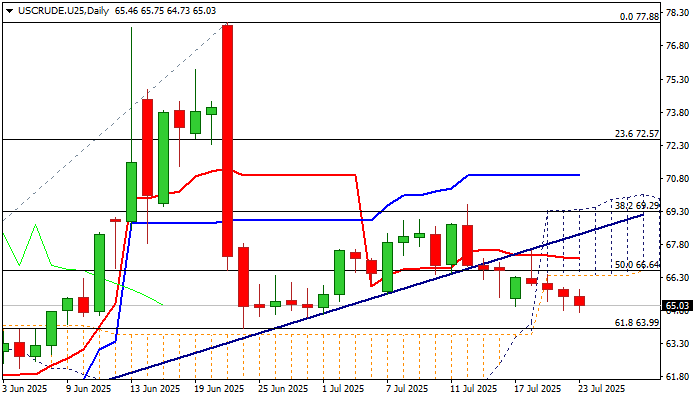
Technical picture weakened after the price broke below ascending and thickening daily Ichimoku cloud, while daily Tenkan/Kijun-sen remain in bearish configuration.
Bears attack again 100DMA ($64.93) after faced several rejection at the indicator, with firm break here to expose next significant support at $63.99 (Fibo 61.8% retracement of $55.70/$77.88 rally).
Daily cloud base ($66.37) marks solid resistance which should ideally cap potential upticks.
Res: 65.80; 66.37; 67.18; 68.28.
Sup: 64.50; 63.99; 63.05; 62.18.
Dollar Failed to Break Downtrend, But the Battle is Not Over Tet
The dollar index has been under pressure since the end of last week, falling back to 97.2 after failing to consolidate above the 50-day moving average and break through the turning point at the end of June, just below 99.0.
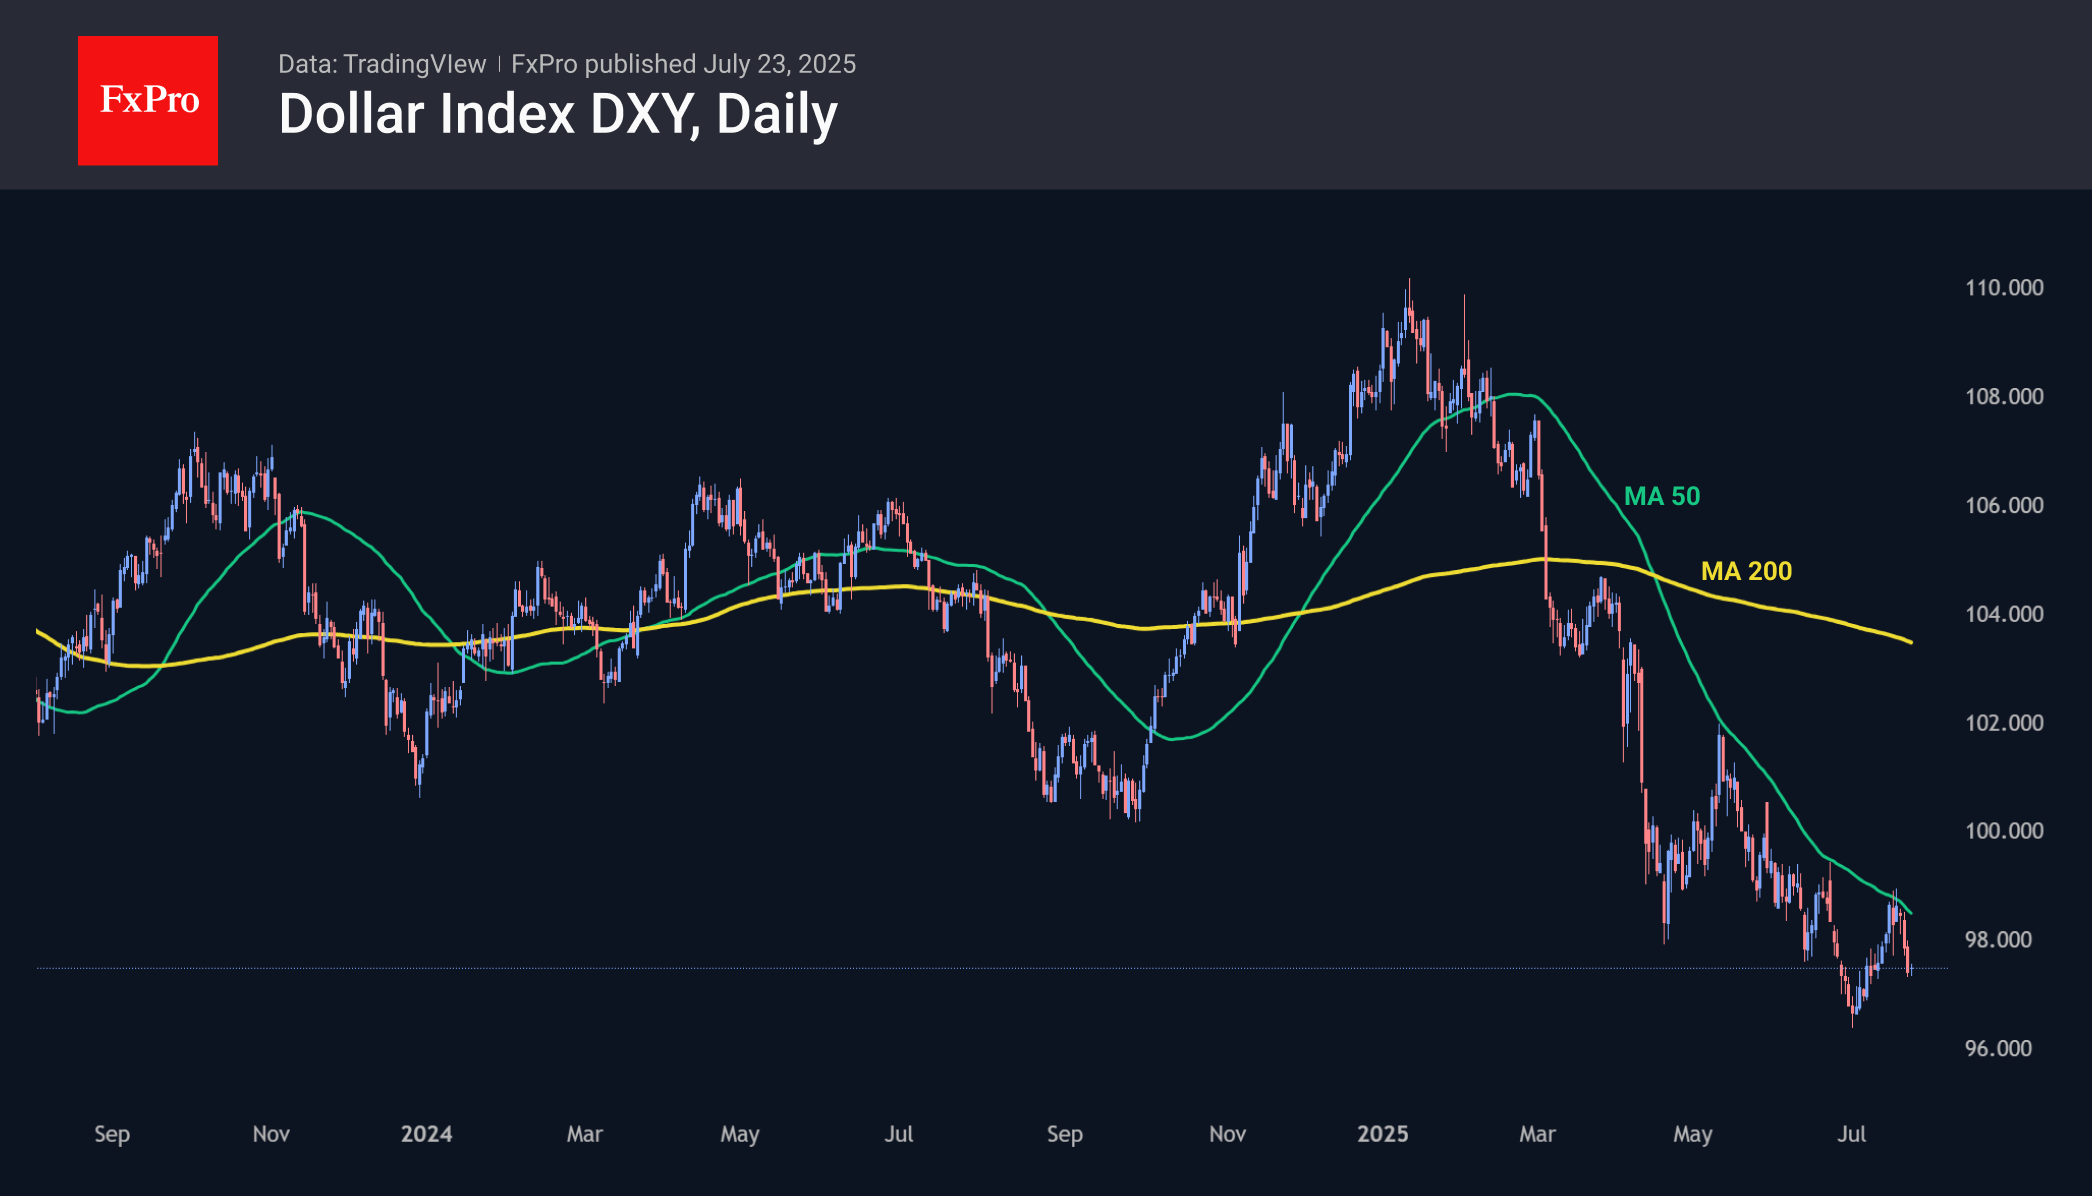
The dollar started July by hitting new lows for over three years and accumulating significant oversold conditions. At the same time, the intensity of the decline slowed, encouraging bulls in their attempt to reverse the trend. Success was very limited, as there was not enough strength even to overcome the short-term downtrend, the upper limit of which was formed by the 50-day moving average.
On weekly timeframes, which reflect long-term trends, a strong bearish ‘death cross’ signal is forming, as the 50-week average falls below the 200-week average. In 2003, after this signal, the dollar remained in decline for another five years. However, the subsequent four similar crosses were close to cyclical lows.
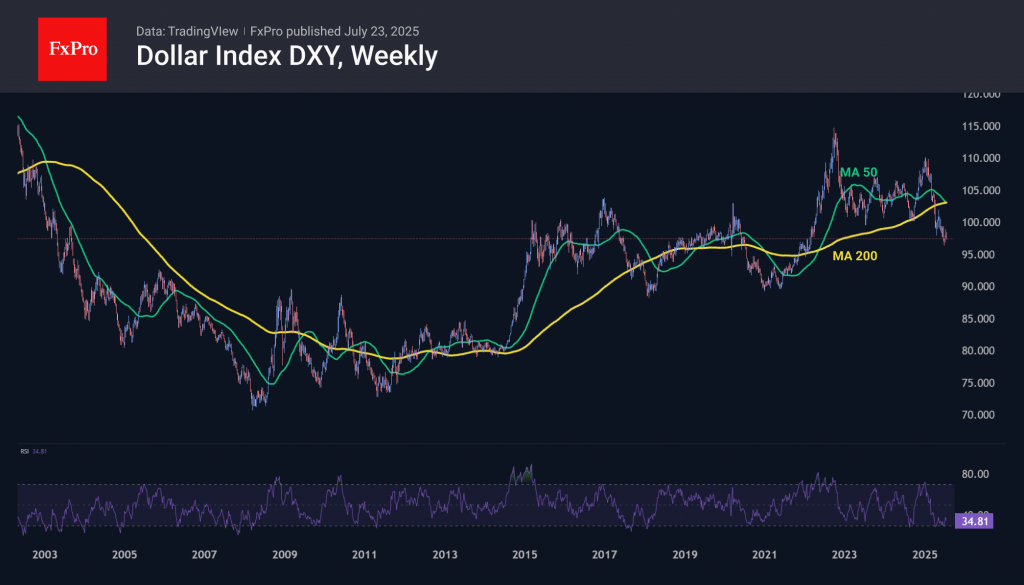
The same is indicated by the dynamics of the relative strength index, which returned from the oversold zone (<30) in early July, remaining at 35 despite the weakening of the DXY.
Fundamental factors may also shift in favour of the dollar. In 2018, the dollar began to rise after the initial shocks of Trump’s victory and the tariff wars he announced a year later, as they worked to reduce the international trade deficit. In both 2018 and 2025, inflationary risks are forcing the Fed to keep rates higher than they could be, which also works in favour of the dollar.
Sunset Market Commentary
Markets
The US-Japanese trade deal struck overnight lifted market sentiment, in Japan in the first place. Yields in the Asian country rallied with net daily changes varying between +4.8 (30-yr) to +8.8 bps (5-yr). The 40-yr yield was a bit of an exception in this otherwise bear flattening move, rising 8.5 bps in the wake of a poorly received auction. The – in all honesty ill-timed – sale took place days after the ruling coalition lost its majority in the Upper House last Sunday. That’s raising questions on the government’s survivability, particularly with rumours of PM Ishiba’s imminent resignation lingering. It also poses risks for an even looser fiscal policy since the LDP+Komeito coalition is now forced to compromise with fiscally less orthodox opposition parties, making the ultra long end of the curve particularly vulnerable. The yen initially suffered from these political and fiscal risks but recovered as trade deal optimism eventually took over. USD/JPY eased to 146.27 currently and EUR/JPY slid towards 171.6. Stocks in the country shot up 3.5%, bringing the Nikkei225 to less than 3% of its July 2024 record high.
The mood spilled over into European (and to a lesser extent US) dealings. The EuroStoxx50 adds about a 1%. That used to be a bit more before reports hit the wires of the Commission readying a $100bn US retaliation package in case there’s no trade deal made and the US pushes ahead with its 30% tariff threat. It doused some of the market hopes ignited by the Japanese trade story even though USTS Bessent in a Bloomberg interview didn’t sound all that negative. “Talks with the EU are going better than they had been.” Commerce Secretary Lutnick later added that Japan’s deal “could be” a model for Europe, referring to the $550bn investment fund pledge Japan made to buy off a lower tariff rate (15%) and accepting US standards on cars. Anyway, German/European yields are off their intraday highs for the same reason. They still add up to 2.3 bps at the long end though. US Treasuries slightly underperform Bunds but outperform gilts. It seems that whenever there’s the slightest pinch of public finance fears in the air, UK yields are taking the lead higher. They rise between 2.7 (2-yr) and 5.7 (30-yr) bps. Sterling isn’t hurt by it and ekes out a small gain against the euro (EUR/GBP 0.866). The common currency in a broader perspective is slightly under pressure against most other G10 peers, including USD. EUR/USD gives up half of yesterday’s rise to trade around 1.172. Cyclical currencies such as AUD and NZD are the notable outperformers today, rallying perhaps on reduced uncertainty after the first trade deal between two actual major economic powers.
News & Views
A study of Jürgen Mathess published on the website of the ‘Institut Der Deutschen Wirtschaft’ (IW) indicates that yuan undervaluation against the euro provides an unfair cost advantage for China. The study says that compared to 2020, the 2025 deficit in goods trade with China is 3.6 times higher for Germany and it has doubled for the euro area. The study said that the nominal exchange rate of the yuan against the euro hardly changed over that period while European goods have become much more expensive. Producer prices have risen by more than 35% in Germany and EMU compared with early 2020, whereas Chinese producer prices have hardly increased, resulting in a sharp real appreciation of the euro against the yuan. The huge cost disadvantage likely contributed considerably to the rise in the trade deficit. This large European cost disadvantage would have been prevented if the yuan had appreciated against the euro to a significant degree. However, as the yuan exchange rate is managed by the central bank of China, the study sees strong indications for currency manipulation and for a significant and unfair undervaluation even if other considerations (capital flows, services and primary income flows) are taken into account. The study comes as the EU and China will meet for a Summit in Beijing On Thursday.
Polish consumer sentiment deteriorated in July, both regarding the current and future situation, the country’s statistical office released today. The current indicator declined from -9 to -14 as all subcomponents deteriorated compared to last month. Polish consumers especially turned more negative on the possibility of making important increases and on the evaluation of the economic situation of the country. However, sentiment was unchanged compared to the same month last year. A similar picture was given for the forward looking confidence indicator. Still, this indicator was slightly higher compared to the same month last year.
EUR/USD Mid-Day Outlook
Daily Pivots: (S1) 1.1702; (P) 1.1731; (R1) 1.1784; More...
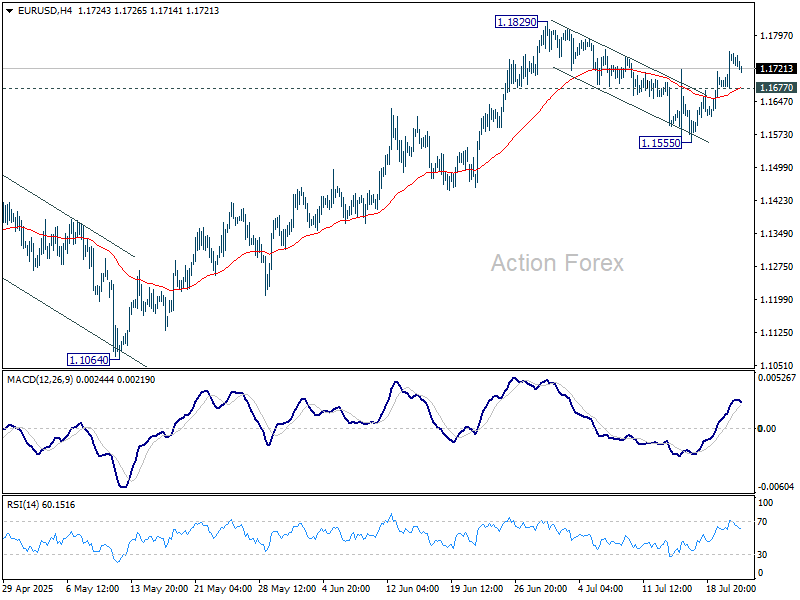
Intraday bias in EUR/USD remains mildly on the upside for retesting 1.1829 high. Firm break there will resume whole rally from 1.0176, and target 1.1916 projection level. However, break of 1.1677 will delay the bullish case, and turn intraday bias neutral, with more consolidations below 1.1829 first.
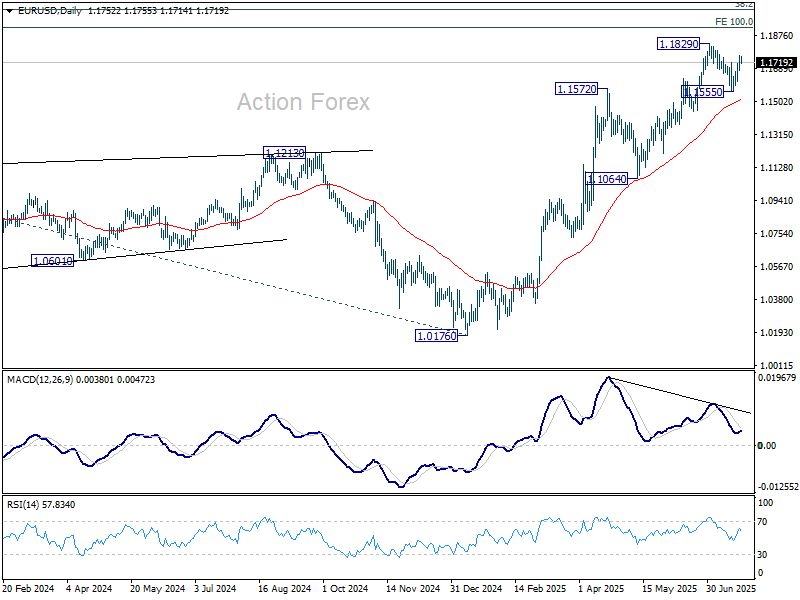
In the bigger picture, rise from 0.9534 long term bottom could be correcting the multi-decade downtrend or the start of a long term up trend. In either case, further rise should be seen to 100% projection of 0.9534 to 1.1274 from 1.0176 at 1.1916. This will remain the favored case as long as 1.1604 support holds.
GBP/USD Daily Outlook
Daily Pivots: (S1) 1.3486; (P) 1.3510; (R1) 1.3558; More...
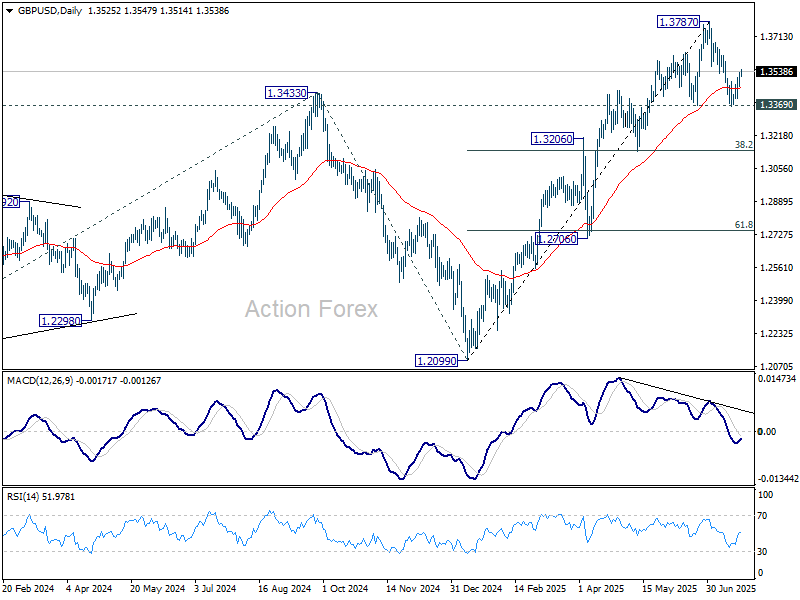
Intraday bias in GBP/USD remains neutral and outlook is unchanged. On the upside, firm break of 1.3561 support turned resistance will argue that correction from 1.3787 has already completed after hitting 1.3369 support. Intraday bias will be back on the upside for retesting 1.3787. Nevertheless, firm break of 1.3363/9 will bring deeper correction to 1.3138 cluster support (38.2% retracement of 1.2099 to 1.3787 at 1.3142).
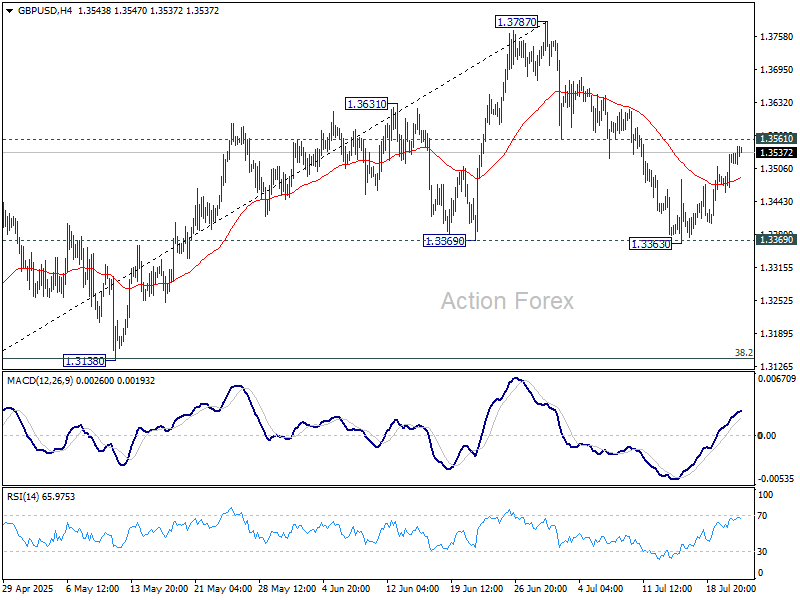
In the bigger picture, up trend from 1.3051 (2022 low) is in progress. Next medium term target is 61.8% projection of 1.0351 to 1.3433 from 1.2099 at 1.4004. Outlook will now stay bullish as long as 55 W EMA (now at 1.3017) holds, even in case of deep pullback.