
Sample Category Title
USD/CHF Mid-Day Outlook
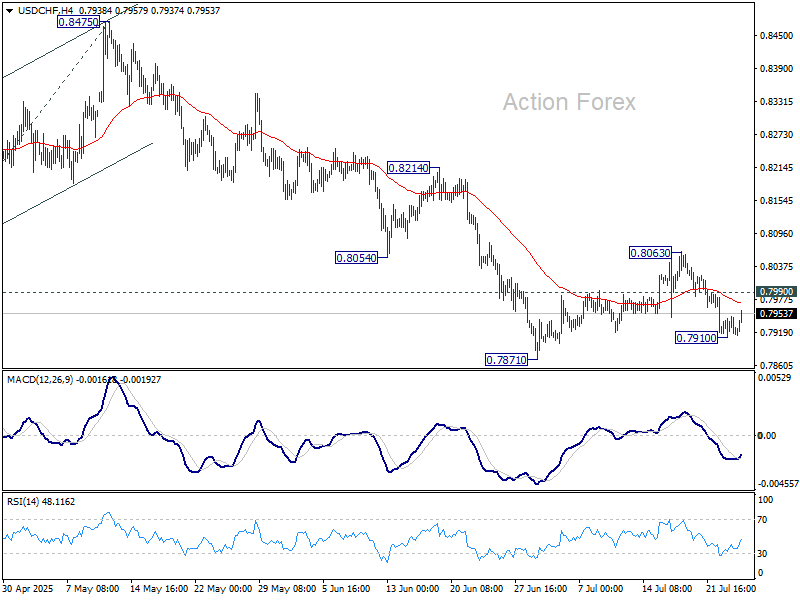
Daily Pivots: (S1) 0.7907; (P) 0.7929; (R1) 0.7946; More….
Intraday bias in USD/CHF is turned neutral first with current recovery. Below 0.7910 will bring retest of 0.7871 support. Firm break there will resume larger down trend and target 61.8% projection of 0.9200 to 0.8038 from 0.8475 at 0.7757. On the upside, break of 0.7990 minor resistance will bring stronger rebound to extend the corrective pattern from 0.7871.
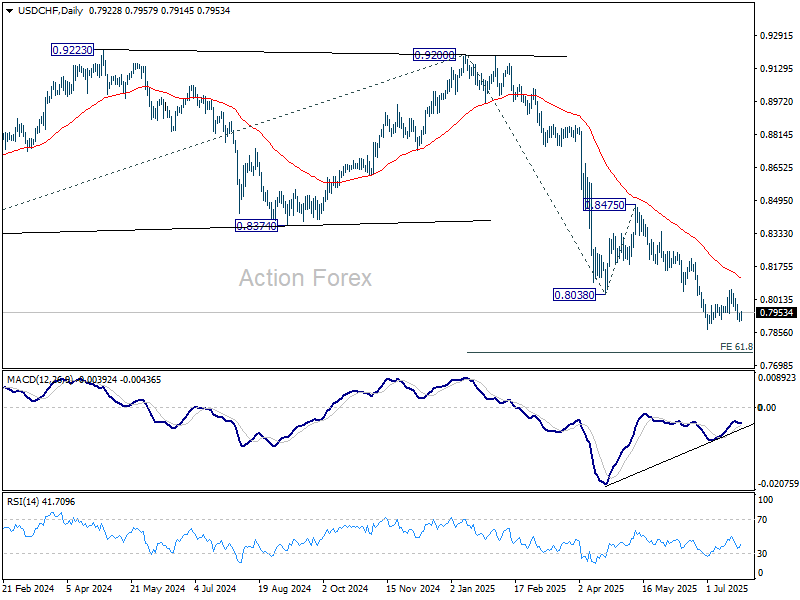
In the bigger picture, long term down trend from 1.0342 (2017 high) is still in progress. Next target is 100% projection of 1.0146 (2022 high) to 0.8332 from 0.9200 at 0.7382. In any case, outlook will stay bearish as long as 0.8475 resistance holds.
USD/JPY Mid-Day Outlook
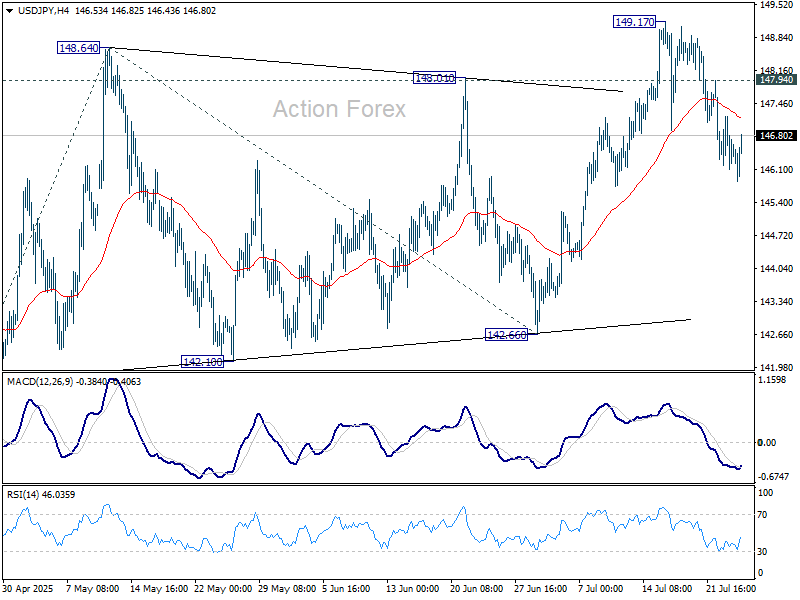
Daily Pivots: (S1) 146.02; (P) 146.62; (R1) 147.12; More...
Outlook in USD/JPY is unchanged and intraday bias stays neutral. As long as 55 D EMA (now at 145..91 ) holds, further rally is still expected. On the upside, above 147.94 minor resistance will bring retest of 149.17. Firm break there will target 100% projection of 139.87 to 148.64 from 142.66 at 151.43. That is close to 61.8% retracement of 158.86 to 139.87 at 151.22. However, sustained trading below 55 D EMA will argue that the whole rebound from 139.87 might have completed and target 142.66 support for confirmation.
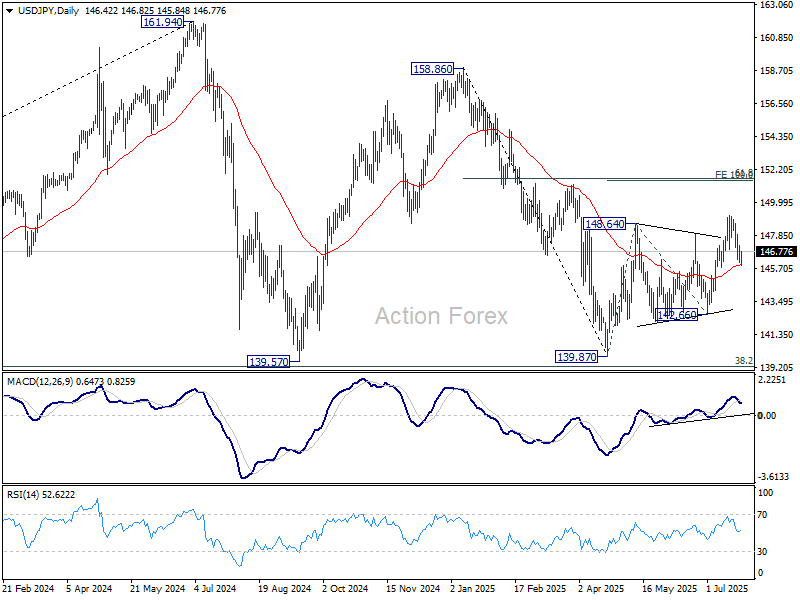
In the bigger picture, price actions from 161.94 (2024 high) are seen as a corrective pattern to rise from 102.58 (2021 low). There is no clear sign that the pattern has completed yet. But still, strong support is expected from 38.2% retracement of 102.58 to 161.94 at 139.26 to bring rebound. in case of another fall.
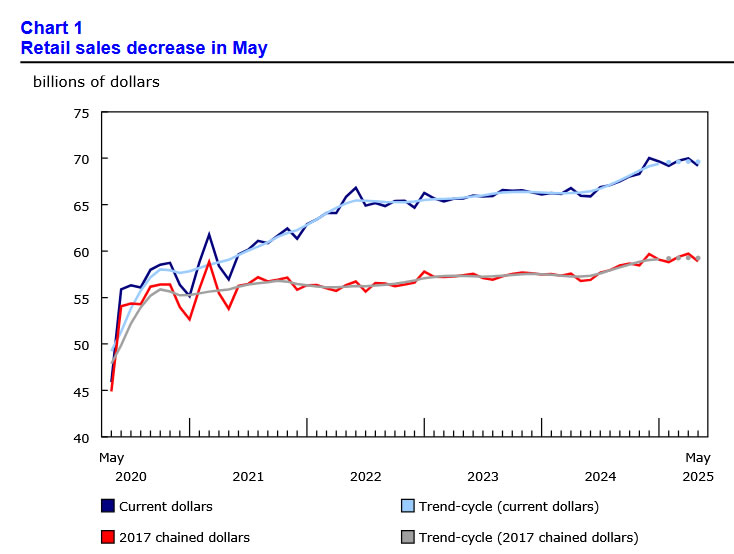
Canadian retail sales fall -1.1% mom in May, but rebound seen ahead
Canadian retail sales fell -1.1% mom to CAD 69.2B in May, with the decline driven largely by -3.6% mom drop at motor vehicle and parts dealers. While the headline figure disappointed, core retail sales—which exclude autos and gasoline—were flat, suggesting underlying consumption was more stable than the headline suggests.
Looking ahead, Statistics Canada’s advance estimate points to a 1.6% mom rebound in June sales, which could help ease fears of weakening domestic demand.
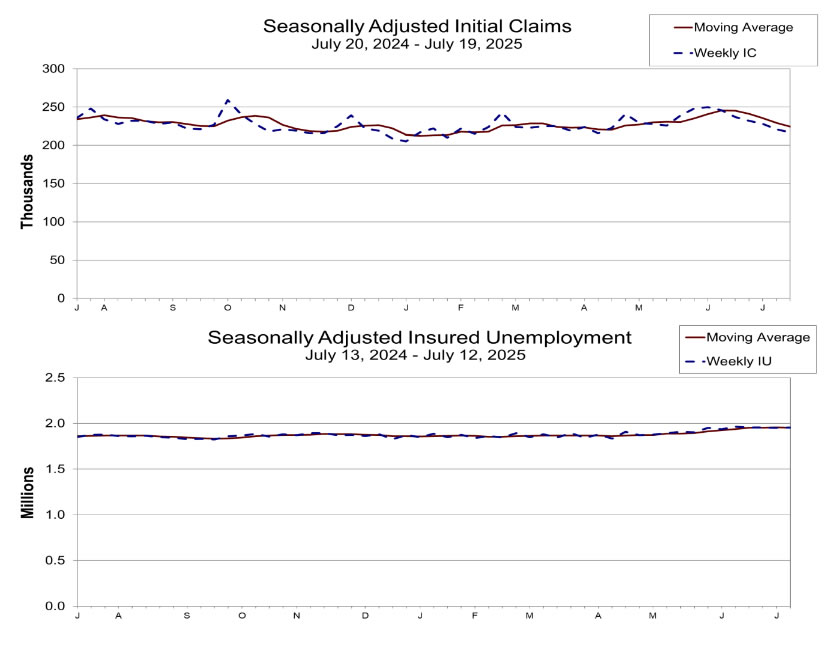
US initial jobless claims fall to 217k vs exp 230k
US initial jobless claims fell -4k to 217k in the week ending July 19, below expectation of 230k. Four-week moving average of initial claims fell -5k to 224.5k.
Continuing claims rose 4k to 1955k in the week ending July 12. Four-week moving average of continuing claims fell -2k to 1954k.
ECB holds at 2.00%, not pre-committing to any rate path
The ECB held its deposit rate steady at 2.00% today, as expected, pausing its easing cycle after a string of cuts since June 2024. In its statement, the central bank reiterated that it will remain "data-dependent" and take a "meeting-by-meeting". It emphasized that approach, the Governing Council is "not pre-committing to a particular rate path".
Policymakers noted that incoming data is "broadly in line" with prior assessments, with domestic price pressures continuing to ease and wage growth slowing. However, the ECB flagged "exceptionally uncertain" global conditions, citing persistent trade disputes as a key risk.
(ECB) Monetary policy decisions
24 July 2025
The Governing Council today decided to keep the three key ECB interest rates unchanged. Inflation is currently at the 2% medium-term target. The incoming information is broadly in line with the Governing Council’s previous assessment of the inflation outlook. Domestic price pressures have continued to ease, with wages growing more slowly. Partly reflecting the Governing Council’s past interest rate cuts, the economy has so far proven resilient overall in a challenging global environment. At the same time, the environment remains exceptionally uncertain, especially because of trade disputes.
The Governing Council is determined to ensure that inflation stabilises at its 2% target in the medium term. It will follow a data-dependent and meeting-by-meeting approach to determining the appropriate monetary policy stance. In particular, the Governing Council’s interest rate decisions will be based on its assessment of the inflation outlook and the risks surrounding it, in light of the incoming economic and financial data, as well as the dynamics of underlying inflation and the strength of monetary policy transmission. The Governing Council is not pre-committing to a particular rate path.
Key ECB interest rates
The interest rates on the deposit facility, the main refinancing operations and the marginal lending facility will remain unchanged at 2.00%, 2.15% and 2.40% respectively.
Asset purchase programme (APP) and pandemic emergency purchase programme (PEPP)
The APP and PEPP portfolios are declining at a measured and predictable pace, as the Eurosystem no longer reinvests the principal payments from maturing securities.
***
The Governing Council stands ready to adjust all of its instruments within its mandate to ensure that inflation stabilises at its 2% target in the medium term and to preserve the smooth functioning of monetary policy transmission. Moreover, the Transmission Protection Instrument is available to counter unwarranted, disorderly market dynamics that pose a serious threat to the transmission of monetary policy across all euro area countries, thus allowing the Governing Council to more effectively deliver on its price stability mandate.
The President of the ECB will comment on the considerations underlying these decisions at a press conference starting at 14:45 CET today.
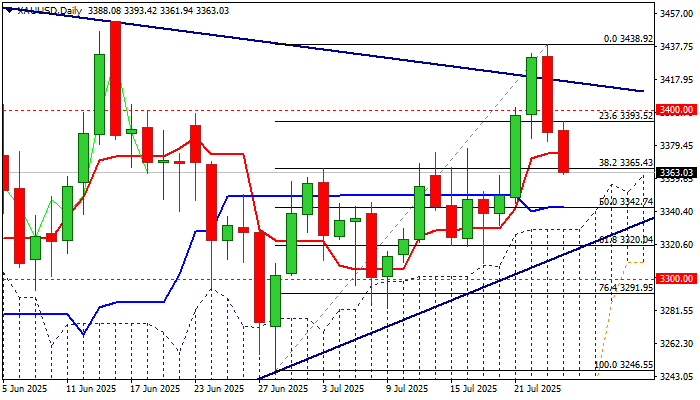
XAU/USD: Gold extends pullback on growing risk sentiment
Gold price falls for the second day, as growing optimism over possible US-EU trade deal continues to fuel risk appetite and deflates safe-haven demand.
Fresh weakness emerged after bulls failed to register a clear break above trendline resistance (daily chart triangle’s upper boundary) with return below the trendline signaling a false break higher and generating bearish signal.
The yellow metal’s price lost around 2% since Wednesday’s opening and cracked pivotal support at $3365 (Fibo 38.2% of $3246/$3438, reinforced by 10DMA, with sustained break here to confirm reversal signal, following Wednesday’s completion of bearish engulfing and close below psychological $3400 support.
Technical picture on daily chart has weakened, although studies are still positive overall, suggesting that current weakness needs to find ground above the top of daily Ichimoku cloud ($3330) to keep larger picture bullishly aligned.
Otherwise, violation of cloud top and nearby lower triangle boundary ($3317) would generate stronger bearish signal and bring the downside at increased risk.
Res: 3393; 3400; 3419; 3438.
Sup: 3342; 3330; 3317; 3309.
FTSE 100 Breaks Records as Euro Area Private Sector Growth Hits 11-Month Highs, ECB Meeting Ahead
Asia Market Wrap - Sentiment on the Up
Global stocks hit a new record high, boosted by a 1% rise in Asia. Japanese markets surged up to 2%, driven by strong performance in the financial sector, while the yen strengthened as investors believed a trade deal could lead to an interest rate hike.
Nasdaq 100 futures climbed 0.3% after Alphabet's earnings, but Tesla shares fell in after-hours trading due to a weak forecast.
Easing global trade tensions have calmed investors, reducing fears of a long trade war and driving market gains. Many believe the US will take a practical approach to avoid tariffs significantly hurting company profits.
President Trump hinted he wouldn’t lower tariffs below 15% as he prepares new trade rules before the August 1 deadline.
Euro Area PMIs
The HCOB Eurozone Composite PMI rose to 51 in July 2025, up from 50.6 in June, showing the fastest growth in private economic activity in 11 months and slightly beating expectations of 50.8.
The growth was driven by stronger performance in the services sector (51.2 vs 50.5 in June) and a near recovery in manufacturing (49.8 vs 49.5), which had its least negative result in three years. New orders remained steady, ending 13 months of decline, which helped boost output in both sectors.
This positive trend in new business encouraged companies to hire more staff for the first time in five months. On prices, input costs rose at a slower pace, allowing firms to keep their prices steady after two months of cuts. However, business confidence dipped slightly, likely due to ongoing concerns about US tariff threats.
European Open - US/EU Trade Negotiation, ECB Meeting
Optimism about a trade deal pushed global stocks to new record highs on Thursday. This came ahead of key global economic data, a European Central Bank meeting, and an unexpected visit to the Federal Reserve by US President Donald Trump.
Reports that the EU and US were nearing a deal on 15% tariffs, with exceptions for some industries, followed a recent agreement with Japan. This boosted the MSCI world stock index for the seventh day in a row.
In Europe, the positive trend continued as Germany's DAX index, which relies heavily on exports, rose over 1%, and the STOXX regional index gained 0.6%.
Deutsche Bank's better-than-expected results sent its shares up more than 4%, lifting banking stocks to their highest level since the 2008 financial crisis. However, Nestle's shares dropped 4.5% after it announced its first-half results and plans to sell one of its businesses.
The pound fell by 0.28% to 1.3544 after reaching a two-week high of 1.3588 earlier in the session.
The dollar gained slightly against the euro and yen following progress in trade talks.
The pound also weakened against the euro, which dropped 0.16% to 86.81. Last week, the euro reached 86.98, its highest level since April 11.
Currency Power Balance
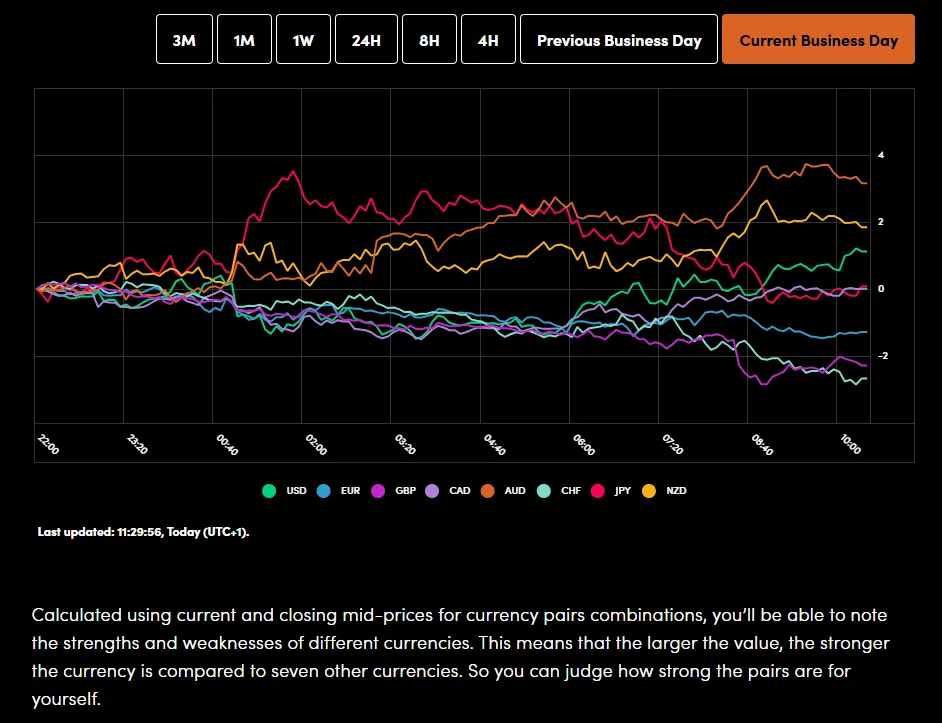
Source: OANDA Labs
In commodity markets, oil prices went up as traders speculated that recent trade deals would boost global growth. Prices also rose due to a bigger-than-expected drop in US crude stockpiles. US crude increased by 0.52% to 65.59 per barrel.
Meanwhile, gold prices dipped slightly to $3,370 per ounce as investors showed more interest in riskier assets, reducing demand for safe-haven options like
Economic Data Releases and Final Thoughts
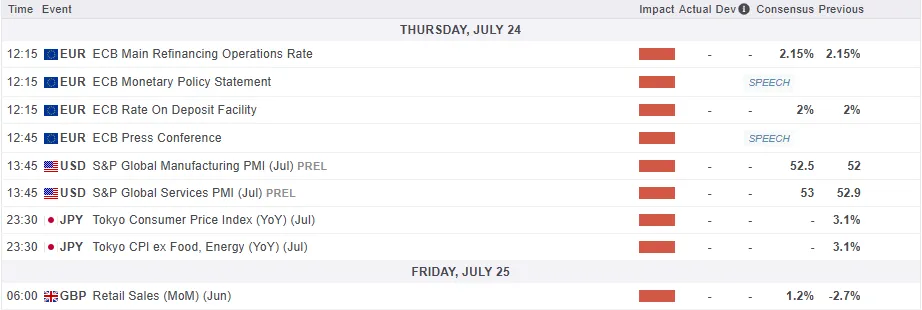
Looking at the economic calendar, we are finally getting some high impact later today.
First we have the ECB meeting where the Central Bank is expected to keep rates on hold, with 90% probability based on LSEG data.
Earnings season continues today and then later in the US session we will get the latest PMI numbers from the world's largest economy as well.
This will be the first glance for market participants from the mag 7 stocks which could stoke some interesting market reactions depending on the release.
For all market-moving economic releases and events, see the MarketPulse Economic Calendar. (click to enlarge)
Chart of the Day - FTSE 100 Index
From a technical standpoint, the FTSE 100 index has continued its rise with an amazing four-hour candle close this morning.
Improved trade deal sentiment and the impressive rally on Wall Street could be the driving force.
The FTSE is now comfortably in overbought territory and we are seeing a slight pullback this morning.
Immediate support rests at 9110 before the 9048 and 9000 handles comes into focus.
The upside does not have any historical data to focus on and thus I will look toward psychological numbers like 9250 and potentially 9500.
FTSE 100 Daily Chart, July 24. 2025
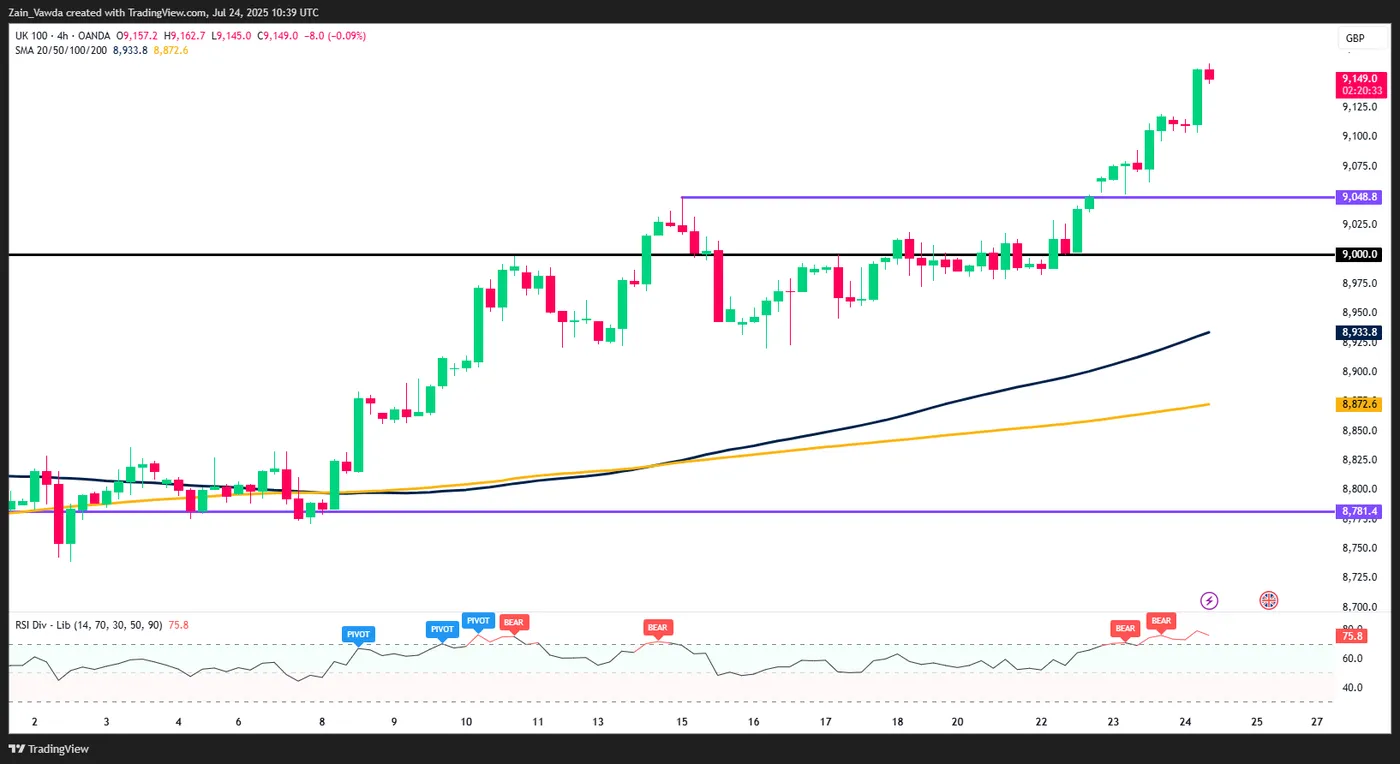
Source: TradingView.com (click to enlarge)
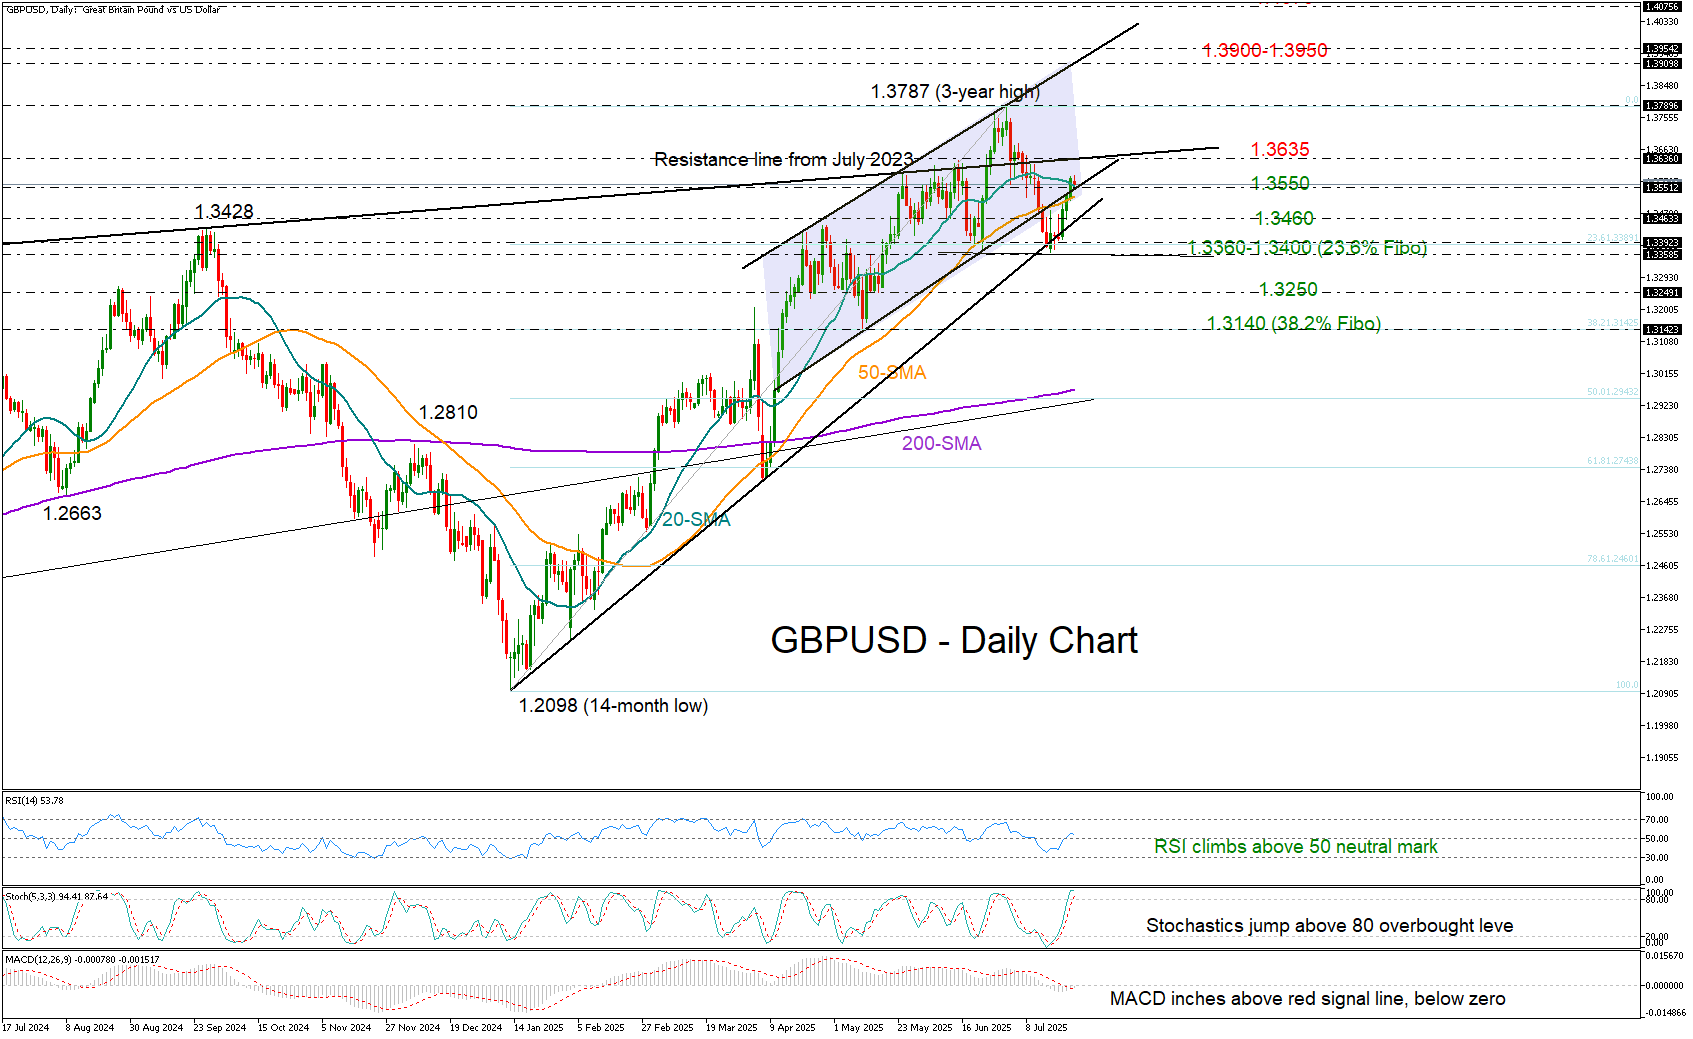
GBP/USD Recovery Faces Key Test
- GBP/USD retraces half of July’s losses, edges above short-term SMAs.
- Technical risk is skewed to the upside, but another challenge looms near 1.3635.
GBP/USD escaped a drop below the 1.3390–1.3400 support area last week, helped by dollar weakness, and is now attempting a close back above its 20- and 50-day simple moving averages (SMAs) near 1.3550.
The latest rebound preserved the nearly 14% year-to-date rally, but for bullish sentiment to strengthen, the pair must also clear the resistance line drawn from July 2023 at 1.3635. A decisive move above the three-year high of 1.3787 could then pave the way toward the 1.3900 round level, where the upper boundary of the short-term bullish channel lies. Beyond that, the price could pause near the 161.8% Fibonacci extension of the prior decline at 1.4070, before potentially heading toward the psychological 1.4200 mark.
Both the RSI and MACD indicators suggest that upward momentum could continue. However, with the stochastic oscillator surging into overbought territory, some caution is warranted. In any case, sellers are likely to remain on the sidelines unless the price breaks below the 1.3360 support zone, which would bring the 1.3245 area into focus. Further losses could trigger a deeper decline toward the 38.2% Fibonacci retracement of the 2025 uptrend at 1.3140.
In brief, GBPUSD bulls may retain control in the short term if the pair establishes a solid foothold above 1.3550 and overcomes the 1.3635 barrier too. Failure to do so could signal a false breakout, raising the risk of a bearish head and shoulders formation.
Crypto Market Nosedive
Market Overview
The crypto market took a nosedive, losing almost 4% of its market cap over the last 24 hours. Without Bitcoin’s growth, altcoins, which had been driving the market upwards in previous days, found themselves on sale. Forty-eight of the top 100 altcoins are losing double-digit rates over 24 hours, while only three are growing.
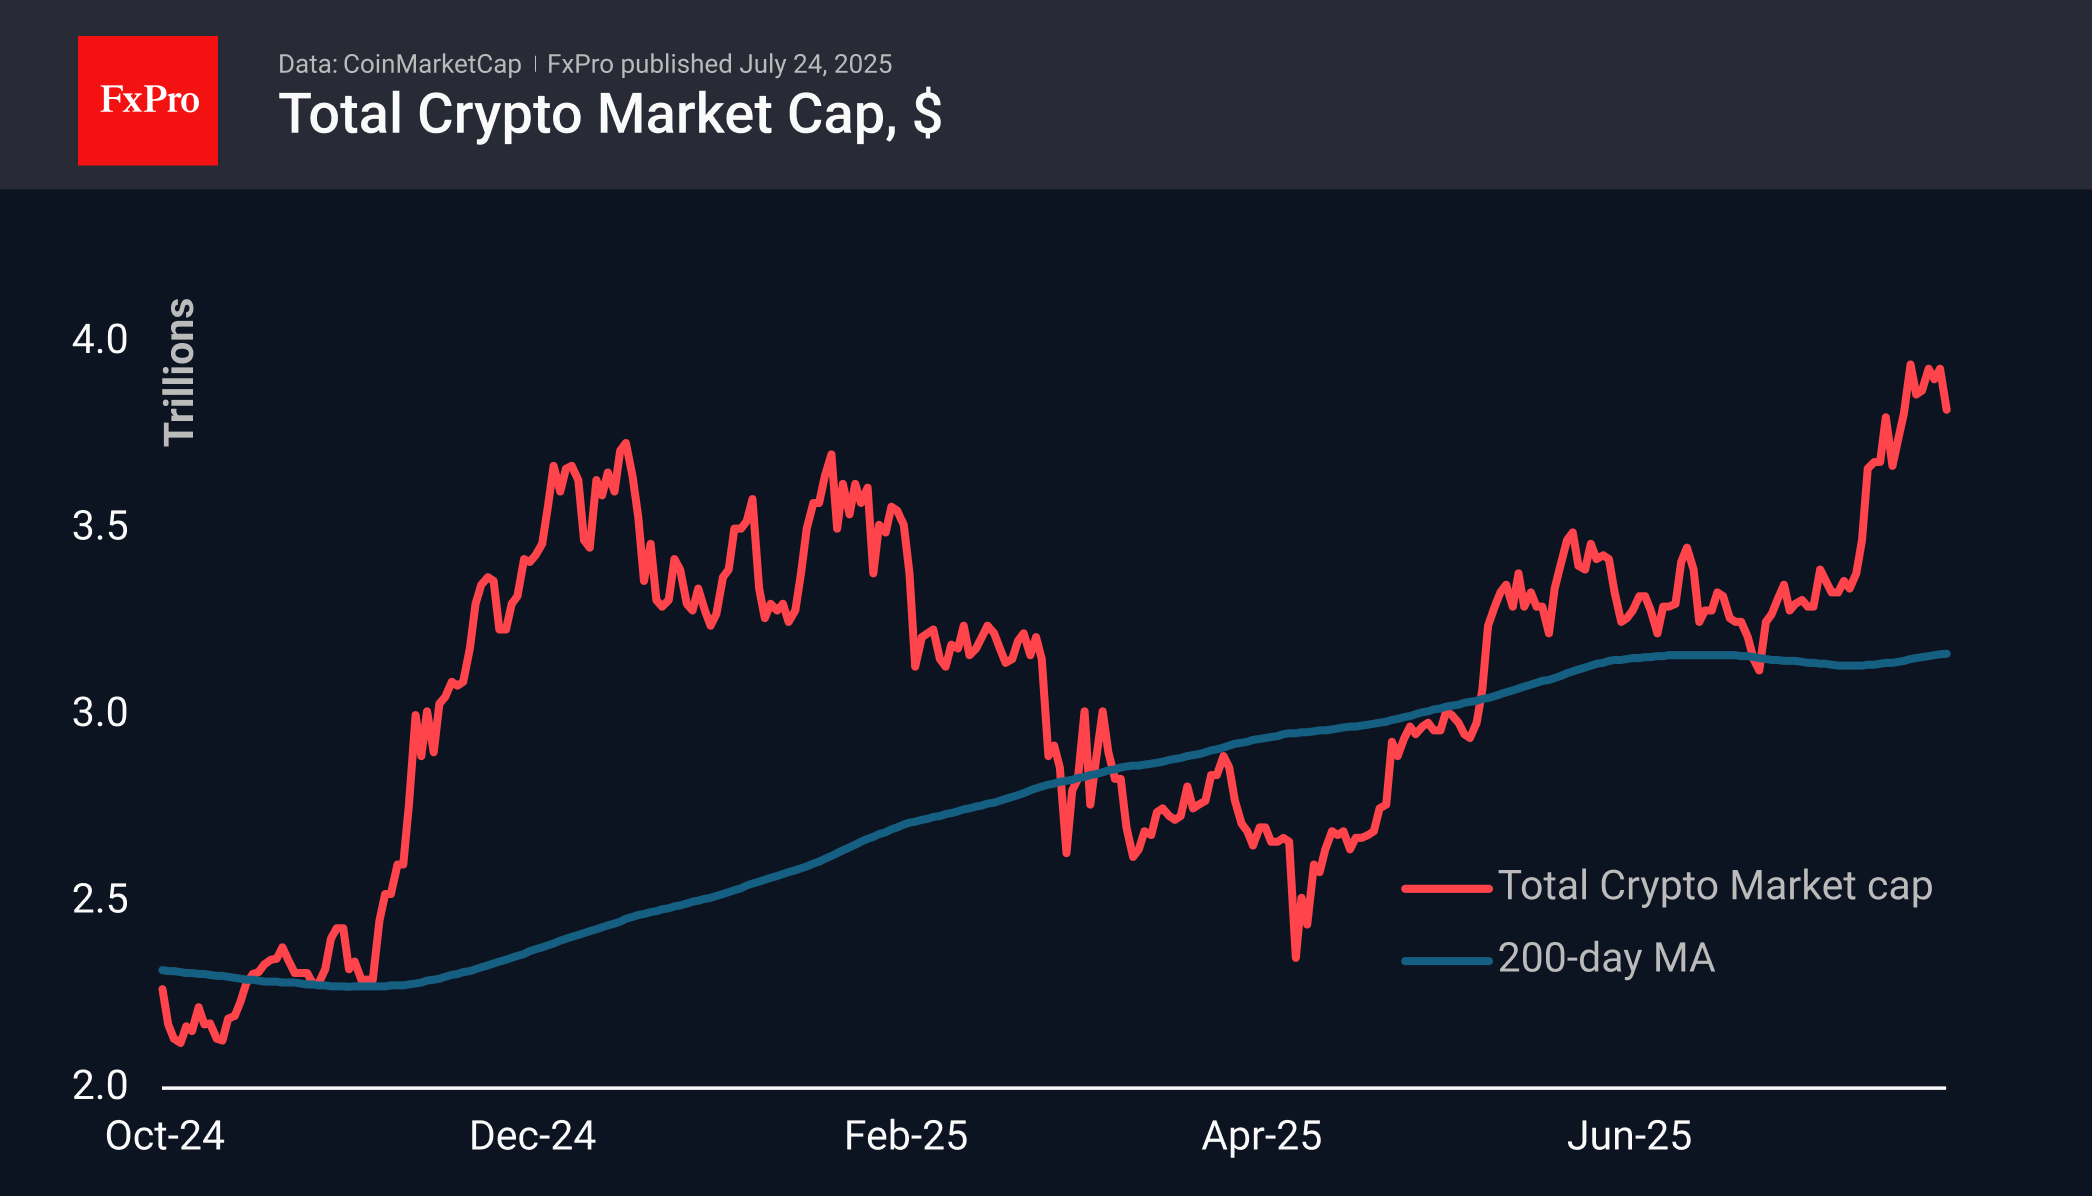
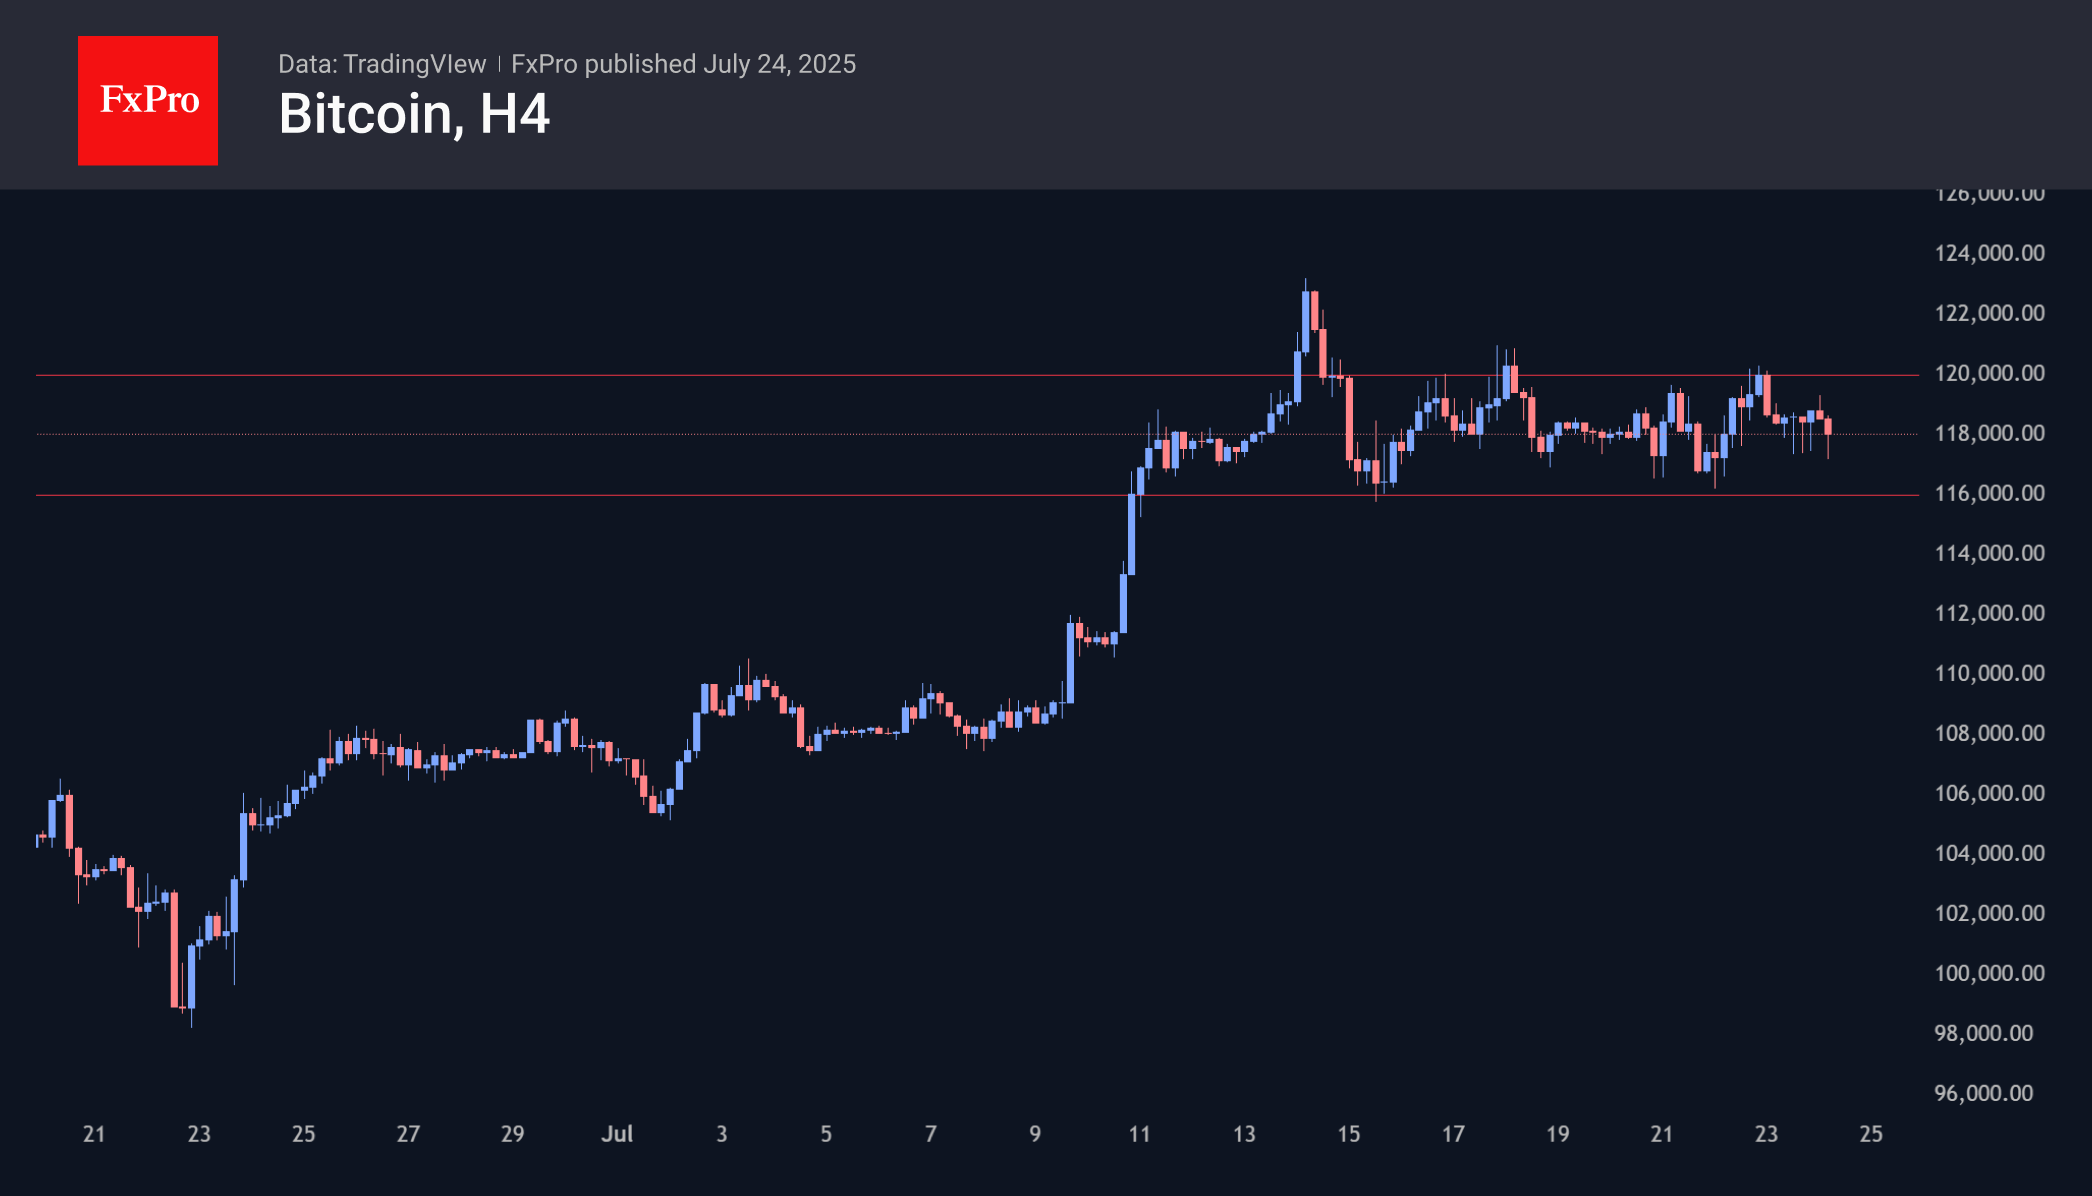
The first cryptocurrency has been facing both a price drop and an outflow from ETFs over the past couple of days, while Ethereum continued to attract new capital to funds. Meanwhile, BTC remains stuck in a narrow range. At $117.3K on Thursday morning, it was on its way to the lower limit of $116K. A reversal to growth will be needed to stop the build-up of pessimism for the entire crypto market, where corrective sentiment is intensifying. If we look only at BTCUSD, a decline to $111K — the area of previous peaks — fits well into the pattern of a corrective pullback.
News Background
According to LVRG Research, institutional investors remain optimistic about Ethereum. There is an outflow of funds from Bitcoin to ETH, which often happens before a surge in altcoin growth.
Bitwise notes that the key driver of the Ethereum rally is high demand from ETFs and corporate treasuries. Since mid-May, Ethereum ETFs have attracted more than $5 billion in investments. Companies such as Bitmine and SharpLink bought 2.83 million ETH for $10 billion. During the same period, the network issued only 88,000 ETH.
According to Lookonchain, there is significant activity in the crypto market from large BTC and Ethereum holders, which may be due to a desire to lock in profits after price increases. EmberCN confirms the flow of large batches of coins to Binance, which are probably for sale.
The BNB cryptocurrency has updated its historical highs made last December and exceeded $800, taking fifth place in the CoinMarketCap ranking and pushing Solana aside. The growth may have been facilitated by the inflow of institutional capital into ETF products.
Upexi announced the acquisition of 100,000 Solana coins for $17.7 million at an average price of $176.77. Upexi’s total reserves reached 1,818,809 SOL ($331 million), acquired for $273 million.