Sample Category Title
Eurozone CPI steady at 2% in July, reinforces case for ECB pause through rest of 2025
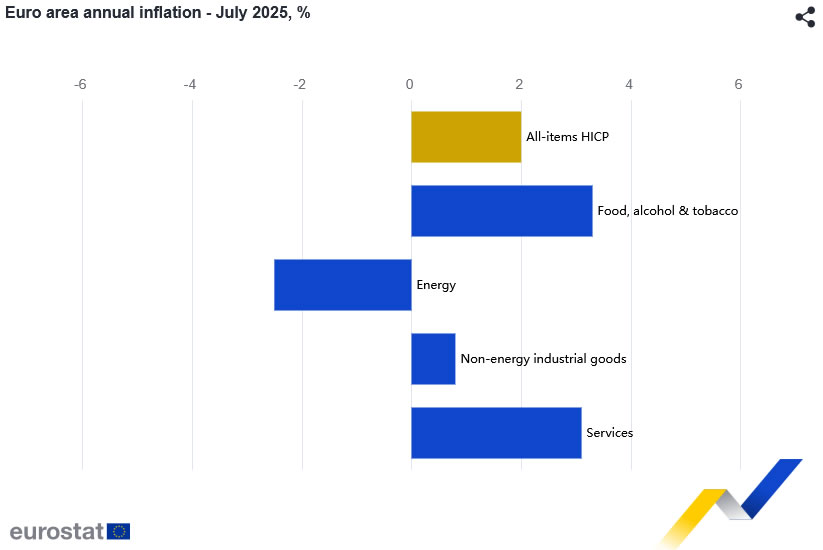
Eurozone inflation held firmer than expected in July, with headline CPI steady at 2.0% yoy, defying expectations for a slight dip to 1.9% yoy. Core CPI was unchanged at 2.3% yoy as forecast. Today’s inflation release reinforces the growing expectation that ECB already completed the easing cycle, as the bar for additional easing is increasingly high.
The underlying components show little sign of disinflation picking up momentum. Non-energy industrial goods inflation rose to 0.8% from 0.5%. While energy inflation remained deeply negative at -2.5%, that decline is slowing. Food inflation ticked up slightly from 3.1% to 3.3%. Services inflation eased only modestly from 3.3% to 3.1%.
Swaps now price in less than 50% chance of another rate cut this year. Comments from officials in recent weeks have leaned cautious, citing inflation stabilization at and waning downside risks tied to the global trade environment. The recent breakthrough in US-EU trade negotiations has also removed a key external headwind.
Besides, major banks are shifting their forecasts in line with this view. Deutsche Bank, Goldman Sachs, and BNP Paribas have all walked back expectations for more cuts in 2025.
Gold Under Pressure The Week Ends on a Sour Note
Gold prices (XAU/USD) closed the week near 2,290 USD per ounce, remaining within a downward trend and marking their worst weekly performance since late June. The precious metal faced sustained pressure from a strengthening US dollar, driven by the tightening of US trade policy.
President Donald Trump confirmed the introduction of a 10% global baseline tariff, alongside retaliatory duties of up to 41% on nations without trade agreements with the US. Additionally, a 40% tariff has been imposed on goods suspected of evading sanctions via third countries.
Further dampening sentiment, fresh US inflation data revealed that both the core and headline PCE index for June had exceeded expectations, casting doubt on the Federal Reserve’s willingness to cut interest rates as early as September. The dual impact of trade tensions and persistent inflation has eroded gold’s appeal as a safe-haven asset.
Market attention now turns to the US non-farm payrolls report for July, which could provide clearer signals on the Fed’s next moves and shape short-term expectations for precious metals.
Technical Analysis: XAU/USD
H4 Chart:
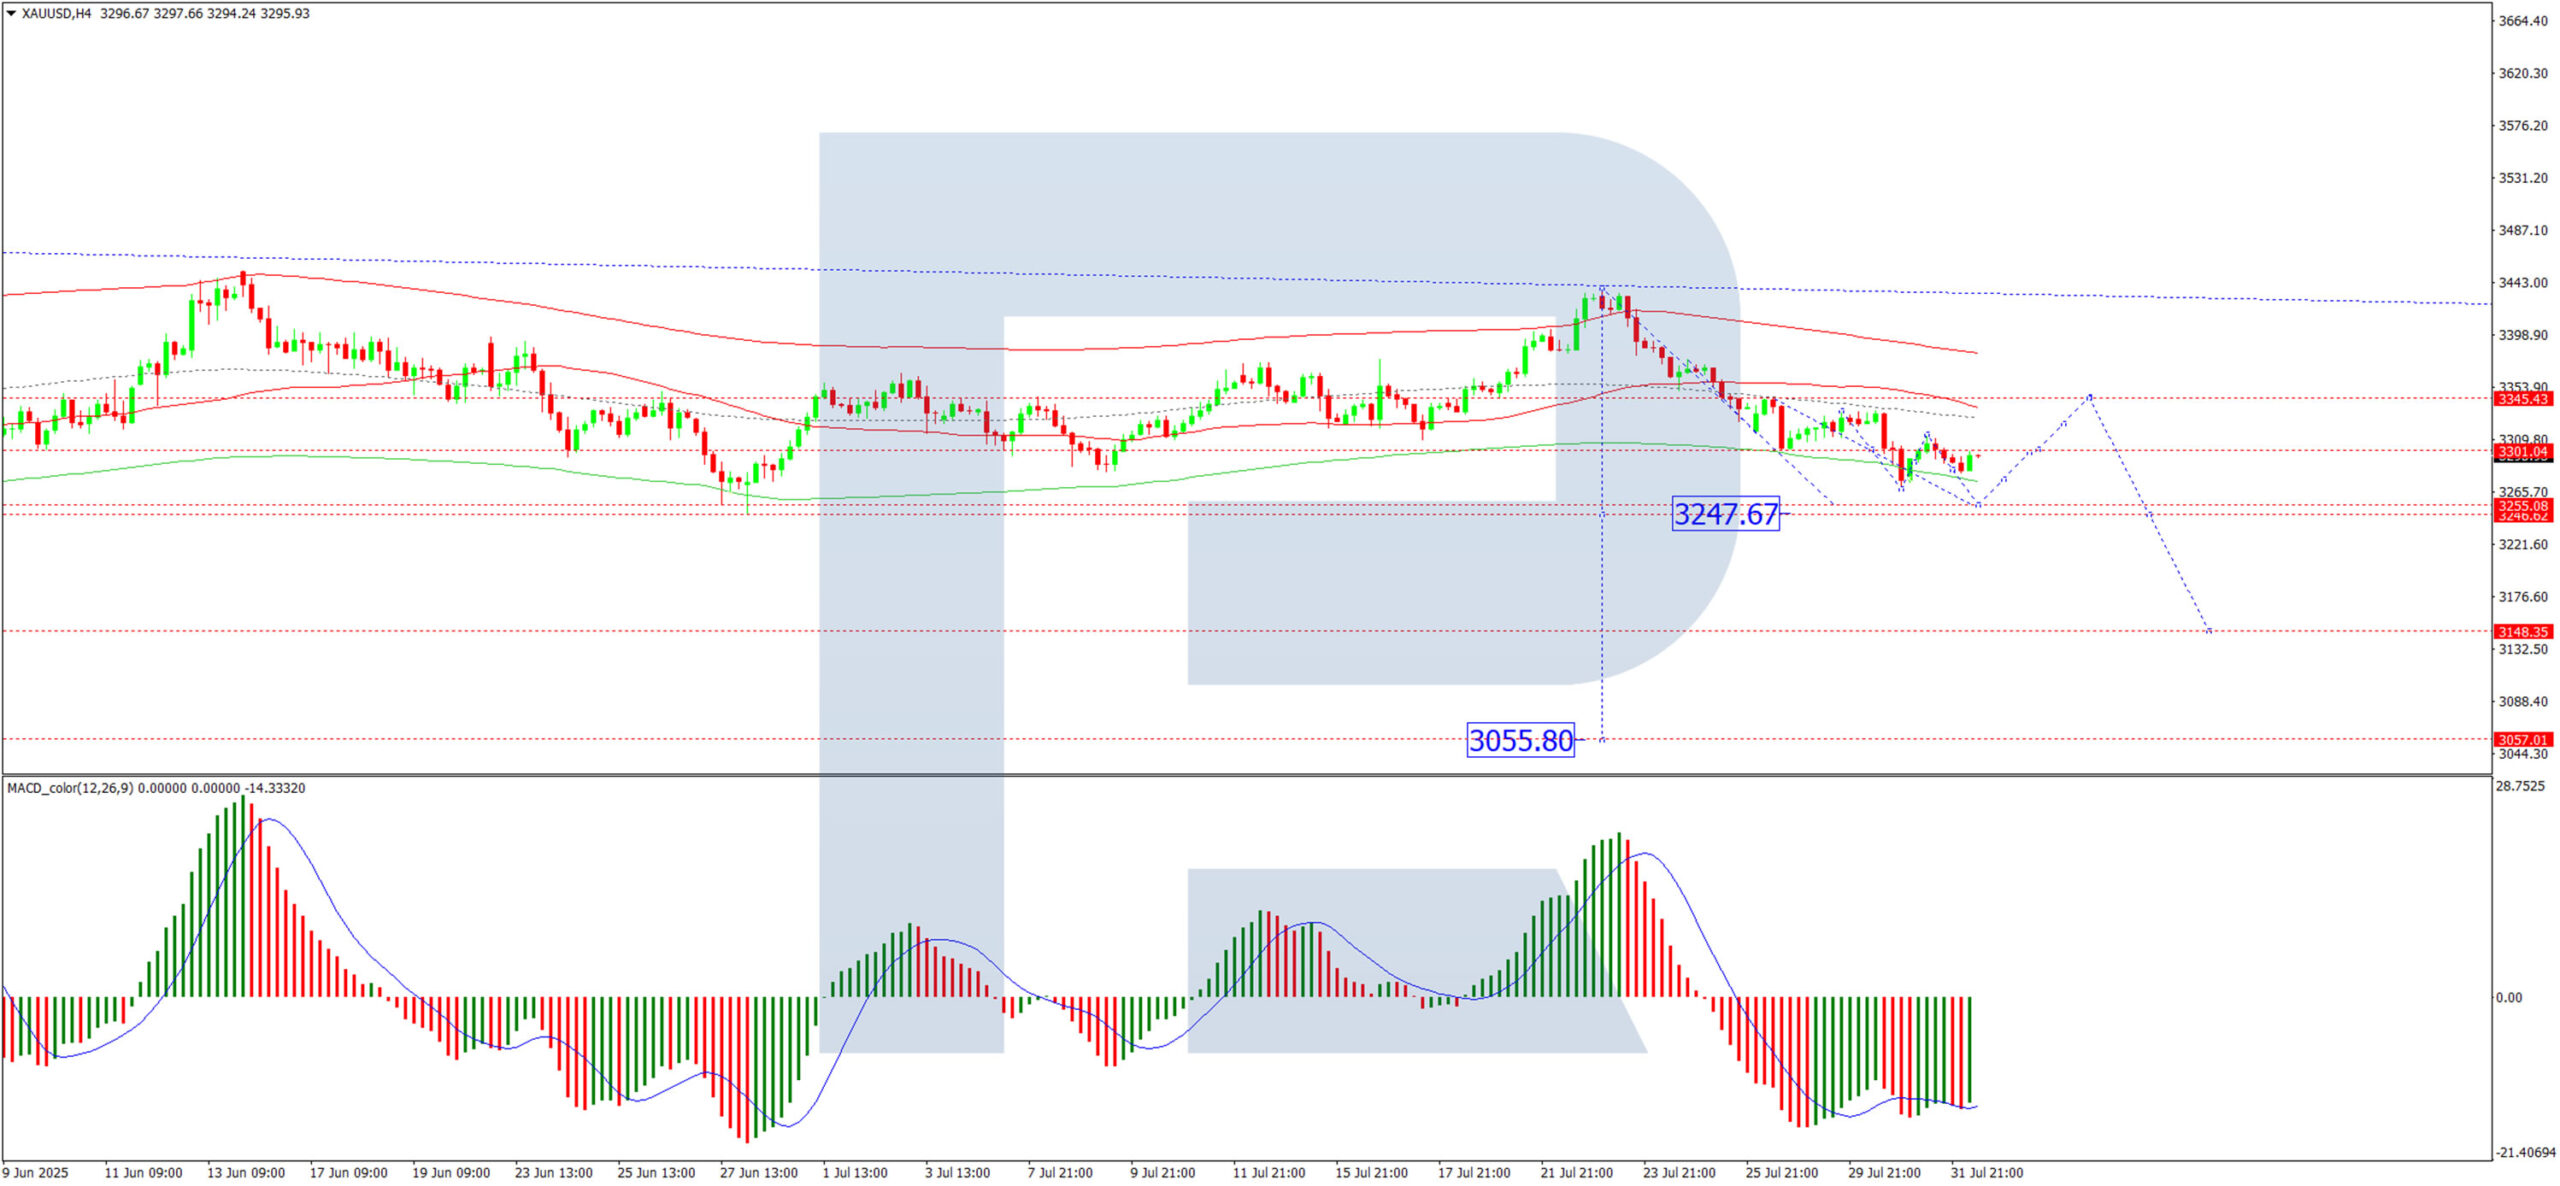
The XAU/USD pair is consolidating within a broad range around 2,298 USD. A downward breakout today could see prices test 2,255 USD, with potential further declines towards 2,247 USD, representing just the first half of the third wave in the broader downtrend. The ultimate target for this bearish wave sits at 2,055 USD. This outlook is supported by the MACD indicator, where the signal line remains below zero and points firmly downward.
H1 Chart:
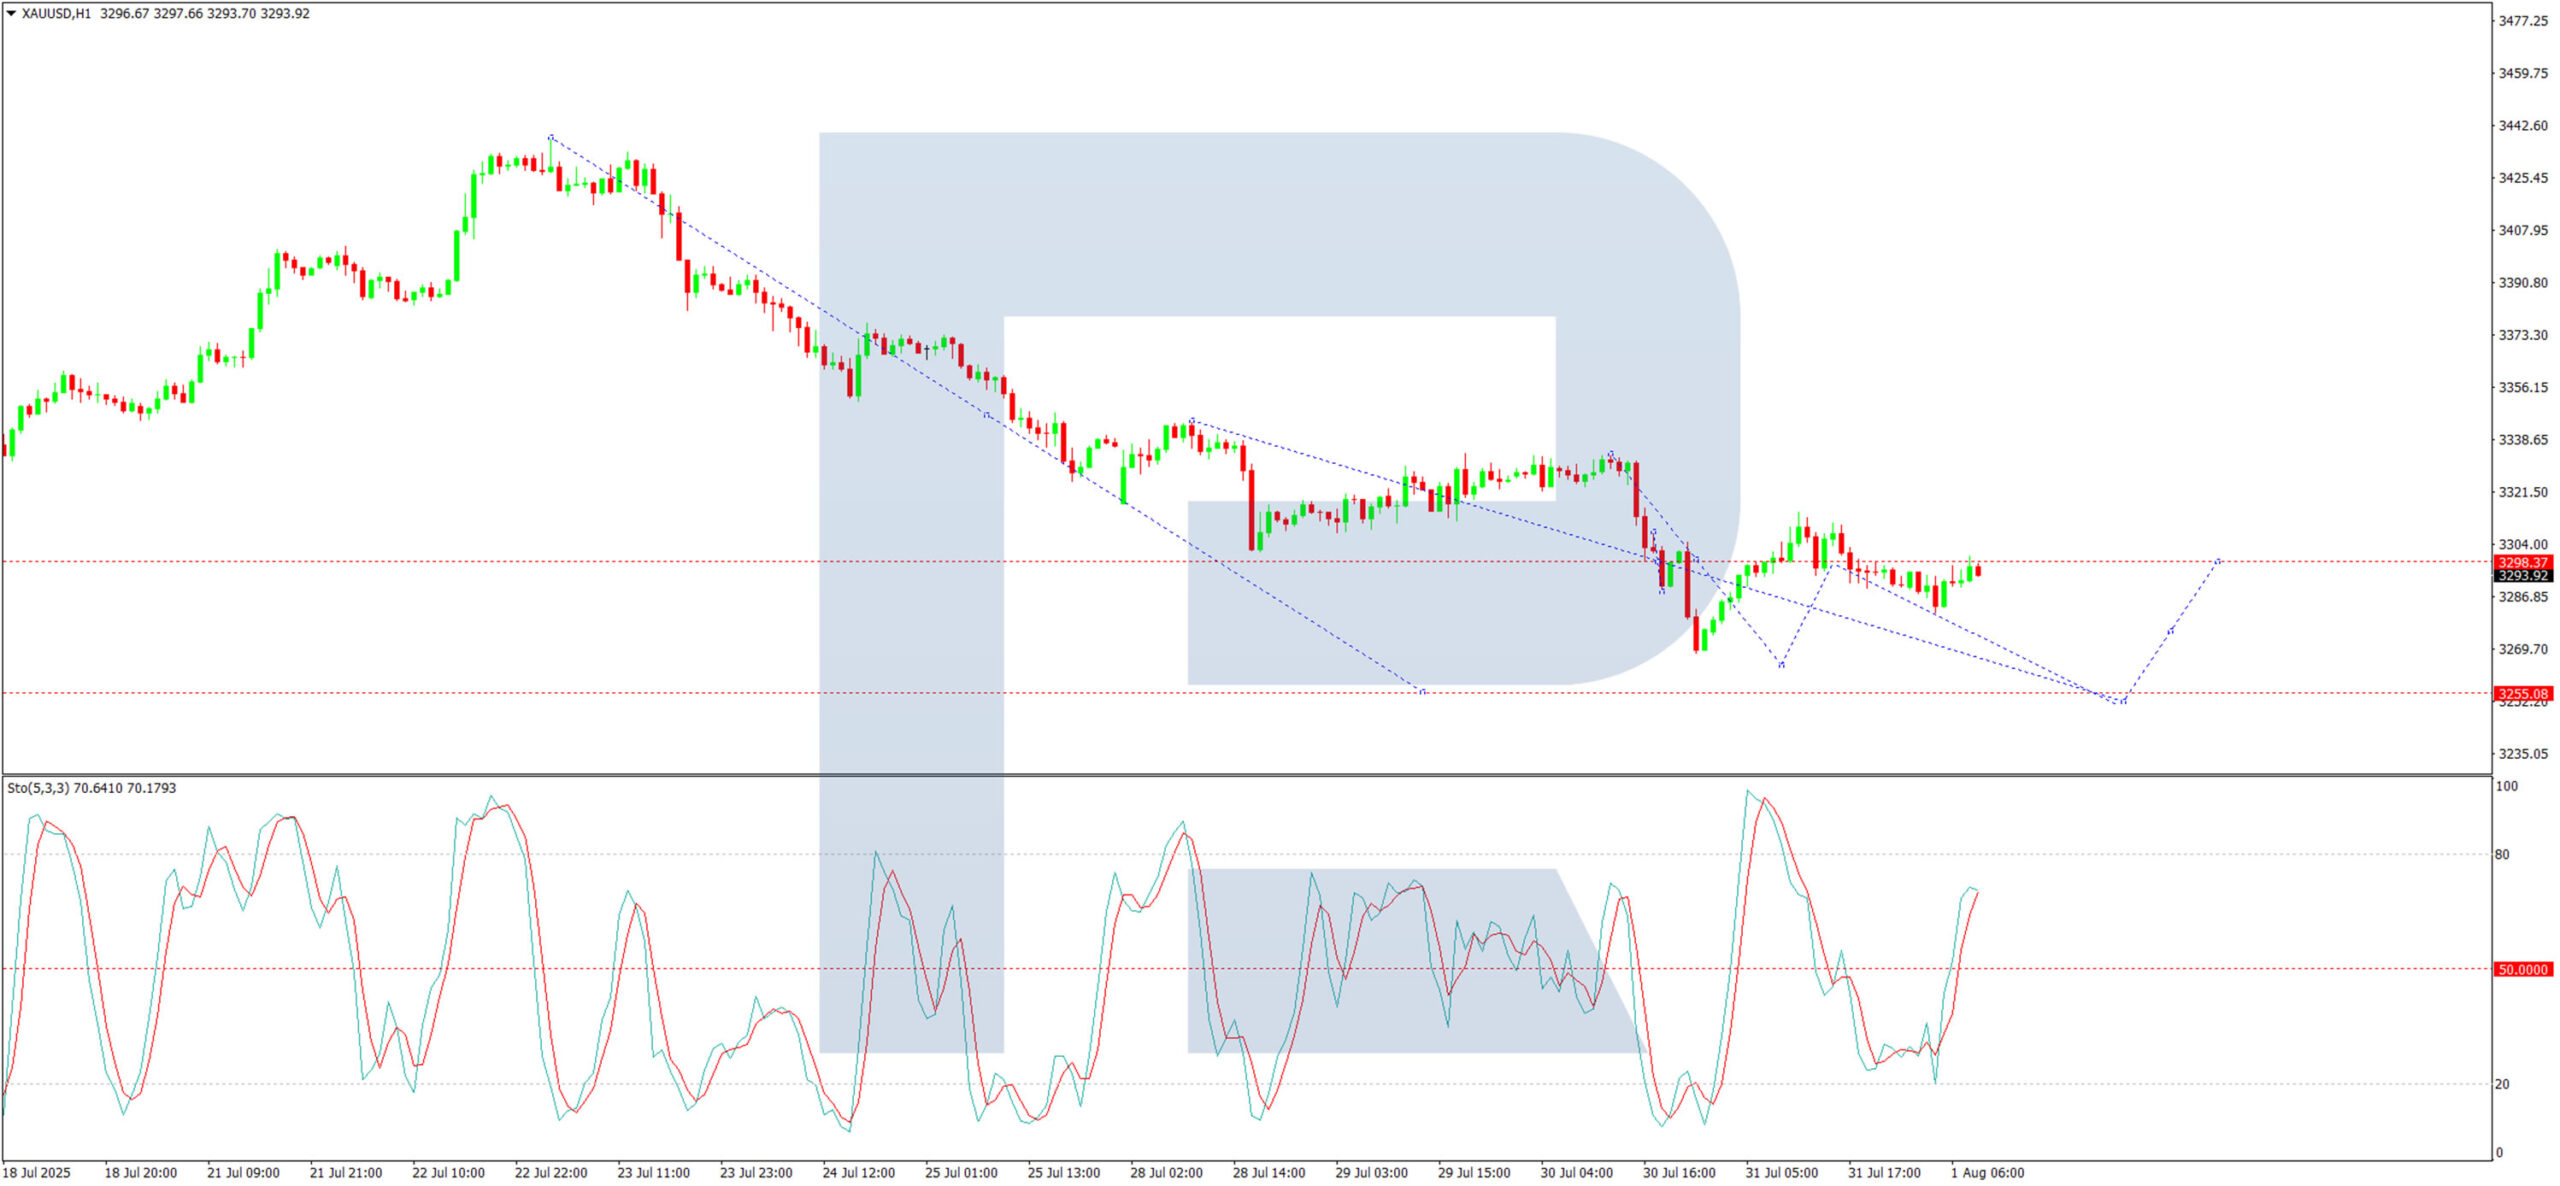
The pair continues to trade in a consolidation pattern near 2,298 USD. A drop to 2,263 USD appears likely today, possibly followed by a rebound towards 2,298 USD before another decline to 2,255 USD, extending towards 2,247 USD. The Stochastic oscillator validates this scenario, with its signal line below 80 and trending sharply downward towards 20.
Conclusion
Gold remains under pressure amid trade-related uncertainties and hawkish Fed expectations. A break below key support levels could accelerate declines, while any dovish surprises in US data may offer temporary relief.
GBP/USD confirms Bearish Trend Reversal
- GBP/USD completes bearish head and shoulders pattern.
- Bears approach May’s support at 1.3140 as oversold signals strengthen.
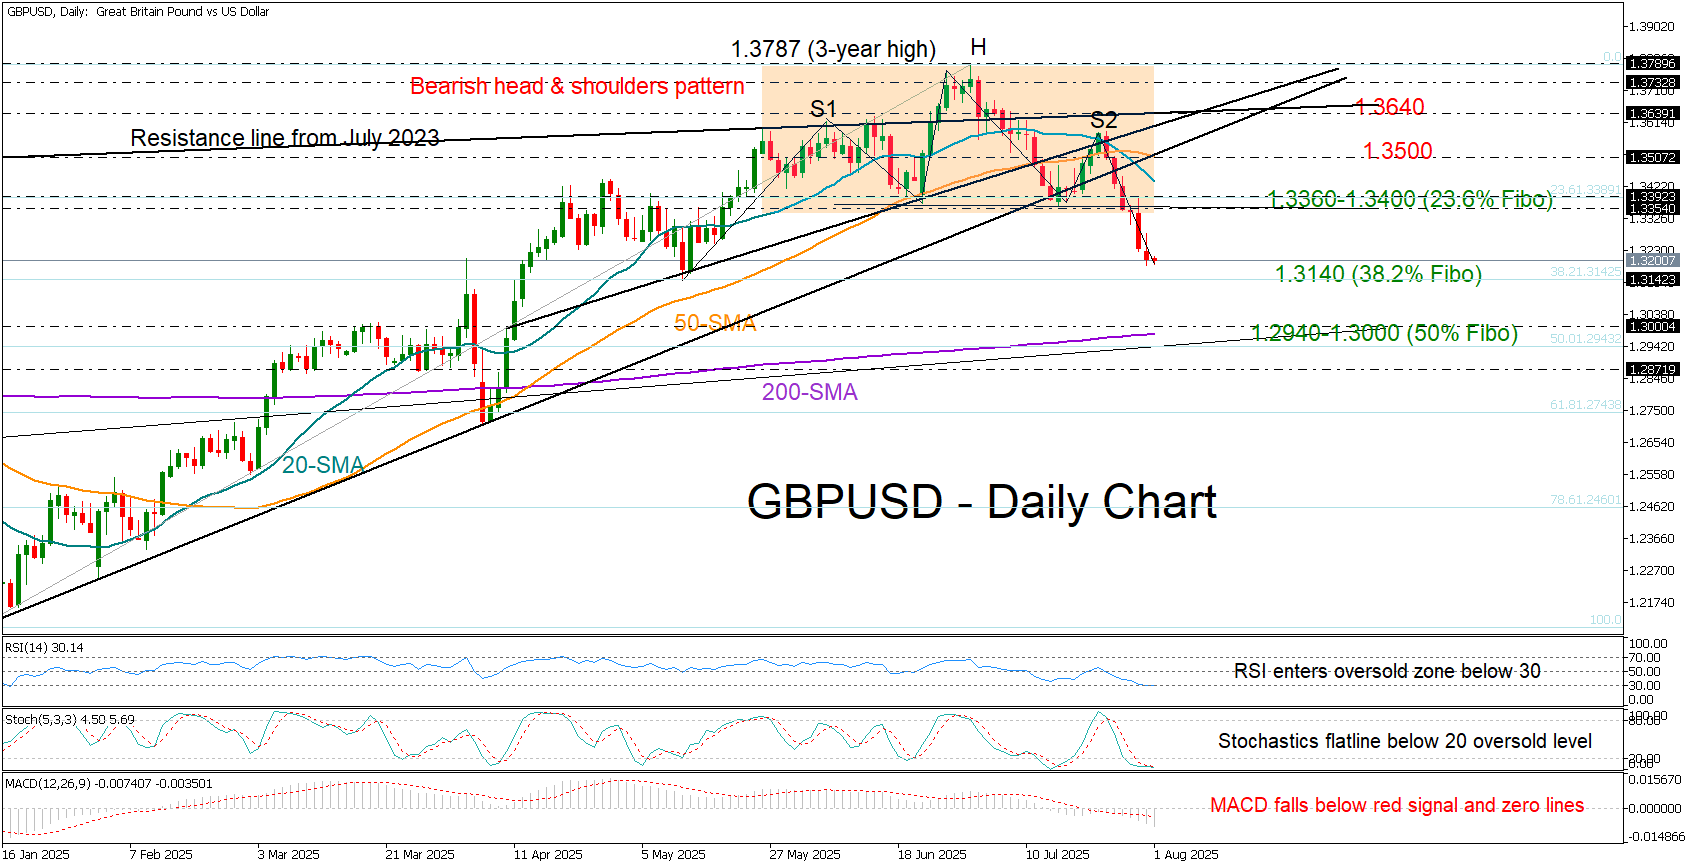
GBP/USD raised alarms over a negative trend reversal after its slide below the 1.3360–1.3400 region confirmed a bearish head and shoulders pattern and cemented a bearish crossover between the 20- and 50-day simple moving averages (SMAs).
With the US dollar roaring back – bolstered by President Trump’s apparent success in recent trade deals and stronger-than-expected US economic data – the British pound succumbed to bearish pressure.
The pair’s six-day losing streak is now flirting with May’s low of 1.3140, where the 38.2% Fibonacci retracement of the 2025 uptrend is located. A move lower could open the door for an aggressive decline toward the 200-day SMA near 1.3000 and the 50% Fibonacci level at 1.2943. Further losses could target the 61.8% Fibonacci retracement at 1.2743, if the 1.2870 barrier fails to hold.
Technically, the bearish cycle could soon take a breather as both the RSI and the stochastic oscillator hover in oversold territory. However, for a positive shift, the bulls would need to push the price back above the neckline at 1.3360–1.3500, reclaim the broken support trendline near 1.3500, and then print a new higher high above the key resistance zone at 1.3640.
In brief, GBP/USD has reversed to a bearish trajectory in the short-term picture, with sellers aiming for a new lower low near May’s floor of 1.3140. A drop below this level could trigger fresh selling pressure.
Gold’s (XAU/USD) Price Forecast: Mixed Signals Ahead of NFP, A Return Above $3300/oz or Further Downside Ahead?
Gold prices are making a fresh attempt to reclaim ground above the $3300/oz mark following a selloff this week.
The selloff in Gold has been down to a combination of factors such as improved sentiment as trade deals were struck and a stronger US Dollar. The question now is whether this is the start of a larger correction or is the road still bumpy ahead?
Gold Prices Moving Forward
Golds continued back and forth over the past few weeks left market participants scratching their heads. However the recent price drop and trendline break have raised interest in the potential for further downside.
Gold buyers are still holding on, but the lower peak at 3435, below April's high of 3500, suggests the rally might be losing steam after a 75% climb over 15 months.
The reason that bulls have remained buoyant thus far, comes from the fact that two previous attempts by bears to gain control saw the precious metal attract buyers en masse. This resulted in higher lows instead of the predicted lower lows which would go with the trend.
In May following a selloff from highs around $3500/oz support and buyers returned around the $3200/oz before a rally to $3433/oz. This was followed by a new lower low at $3122/oz which seemed to many that it could be the start of a longer term downtrend.
However, a rise in geopolitical risk saw a higher high posted instead of a lower high and this saw a two month period of mixed price action.
This begs the question, is the current drop the start of a longer move to the downside or more of the same?
US Dollar Recovery Gains Pace
There is a notable difference with the current rally though.
Firstly, Geopolitical risk has quietened down toward the background over the last 3 weeks which is not to say that it may not return. The Iran question remains open ended, with ongoing meetings and a potential regime change still being touted in many avenues of the media.
Should the situation escalate again, safe haven demand may return. For now though this avenue has led to a reduction of haven flows.
The US dollar has been bid of late as trade deal announcements appear to be aiding the US dollar. The rally in the DXY is now at a crucial point as tariffs kick in. The DXY is testing a crucial pivot level around the 100.00 mark, just ahead of today's NFP data.
US Dollar Index (DXY) Daily Chart, August 1, 2025
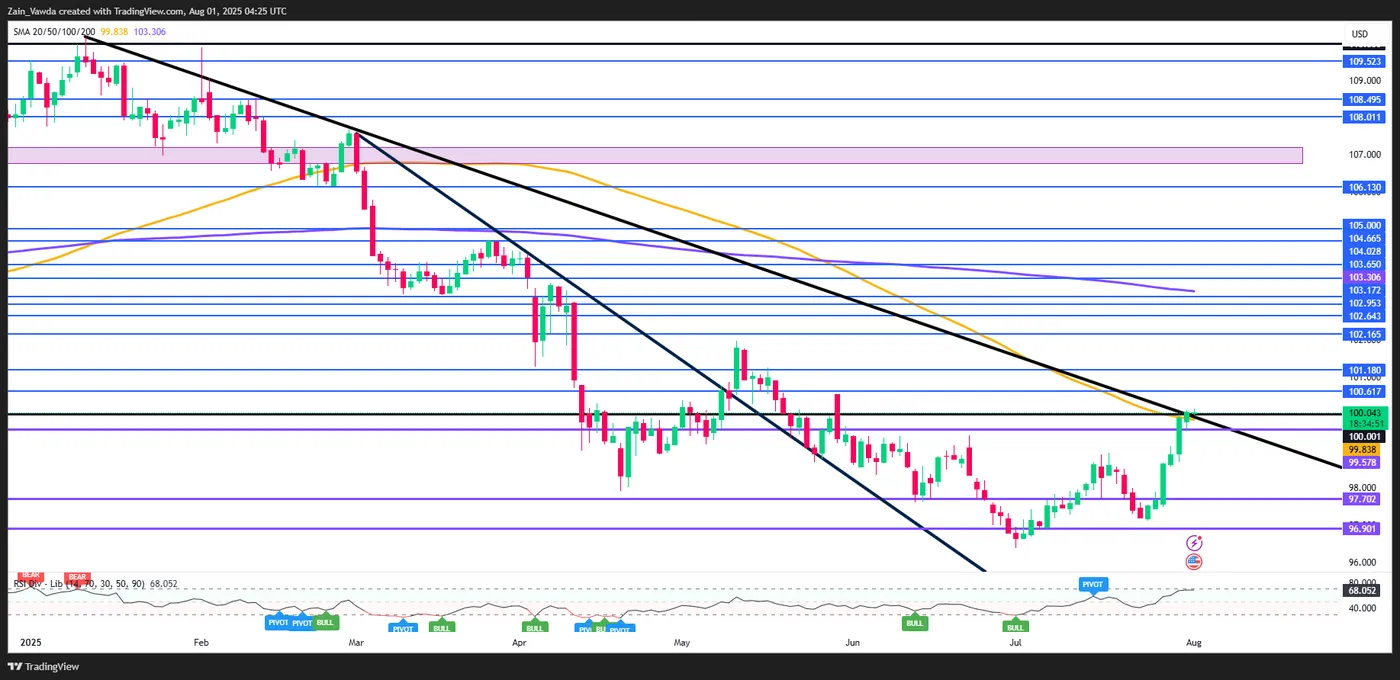
Source: TradingView (click to enlarge)
A positive jobs number could add to optimism around the US economy. Whether this is misguided as some analysts have pointed out is irrelevant, what matters is what market participants are doing, and based on market moves it appears there is no doubt that confidence is growing around global growth and growth in the US during h2 2025.
If this picture persists through the month of August, Gold bulls could be in for a challenge. However, it is always important to remember that the situation has been fluid and ever evolving in 2025, so this is by no means set in stone.
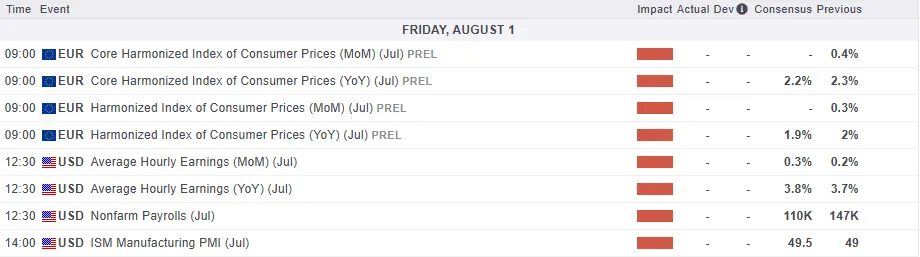
For all market-moving economic releases and events, see the MarketPulse Economic Calendar. (click to enlarge)
Technical Analysis - Gold (XAU/USD)
From a technical standpoint, Gold monthly candle close for July closed as a massive shooting star which hints at further downside ahead.
This also marked the first bearish monthly close since December 2024 and could be a sing of the shift in momentum between buyers and sellers.
Dropping down to a daily chart and as you can see below, we have broken below the triangle pattern where last week we had a false breakout to the upside.
The breakout to the downside has been followed by a significant push lower, with Wednesday seeing the precious metal lose about 1.55% and record its lowest daily close in just over a month.
However, yesterday we saw an inside bar bullish candle close as Gold found some support at the 100-day MA which is hovering around the $3270/oz handle.
If bulls are to make a move higher, acceptance above the $3300/oz handle is crucial with a daily candle close above this level needed for bullish momentum to return.
Immediate resistance rests at $3322, $3341 and $3350 respectively.
A move lower here will first need a clean break and daily candle close below the 100-day MA. This could open up the possibility of further downside toward support at $3243, $3200 and potentially the $3121 handle (which is the lowest price reached since the April all-time high of $3500/oz.
Gold (XAU/USD) Daily Chart, August 1, 2025
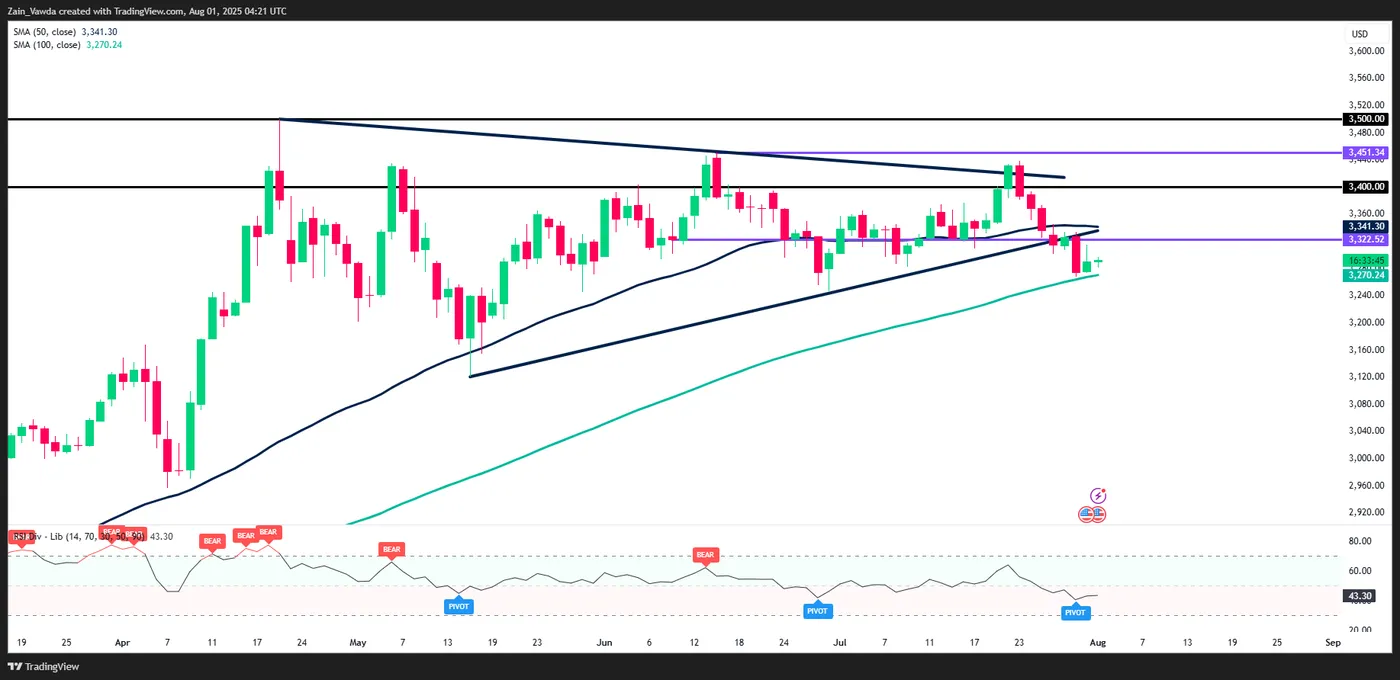
Source: TradingView (click to enlarge)
Client Sentiment Data - XAU/USD
Looking at OANDA client sentiment data and market participants are Long on Gold with 72% of traders net-long. I prefer to take a contrarian view toward crowd sentiment and thus the fact that the majority of traders are net-long suggests that Gold prices could continue to slide in the near-term.
EUR/CHF Daily Outlook
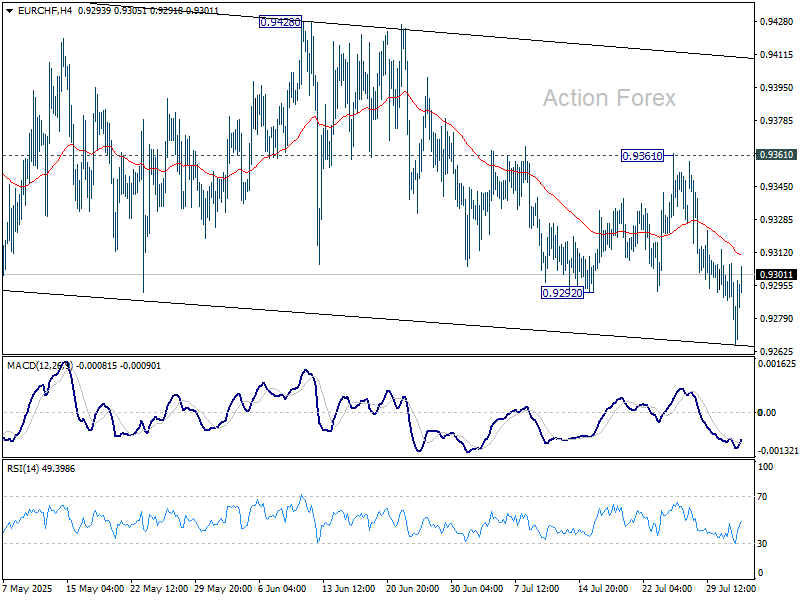
Daily Pivots: (S1) 0.9258; (P) 0.9283; (R1) 0.9298; More....
EUR/CHF's break of 0.9292 support indicates that deeper decline is underway. Risk will stay on the downside as long as 0.9361 resistance holds. Retest of 0.9218 low should be seen next. Firm break there will resume larger down trend.
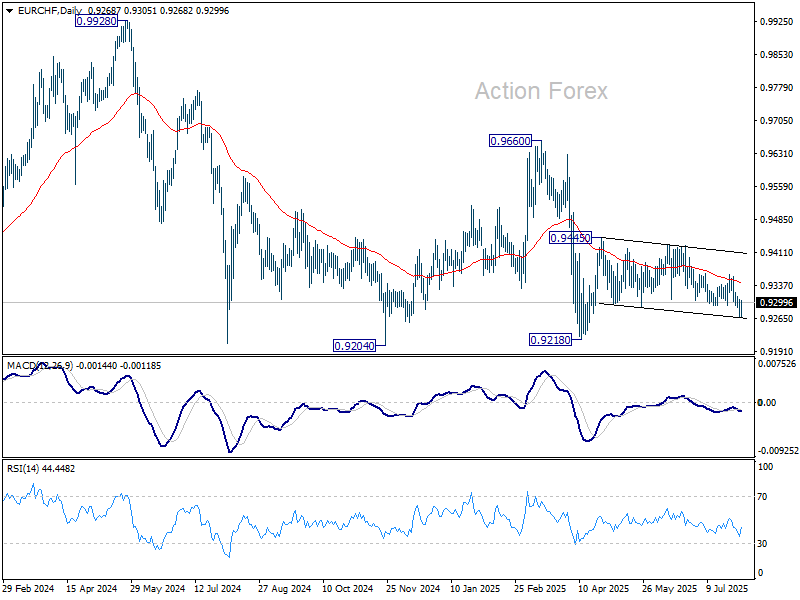
In the bigger picture, while downside momentum has been diminishing as seen in W MACD, there is no sign of bottoming yet. EUR/CHF is still staying below 55 W EMA (now at 0.9424) and well inside long term falling channel. Outlook will stay bearish as long as 0.9660 resistance holds. Break of 0.9204 (2024 low) will confirm resumption of down trend from 1.2004 (2018 high).
GBP/JPY Daily Outlook
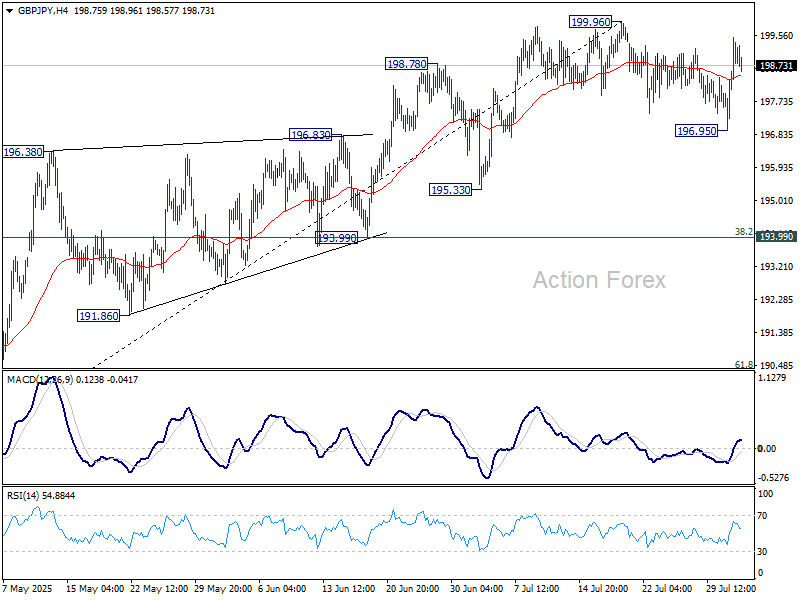
Daily Pivots: (S1) 197.53; (P) 198.52; (R1) 200.08; More...
GBP/JPY rebounded after brief dip to 196.95 and intraday bias is turned neutral. Consolidations from 199.96 might still extend and below 196.95 will target 193.99 cluster support (38.2% retracement of 184.35 to 199.96 at 193.99). Nevertheless, firm break of 199.96 will resume larger rise from 184.35.
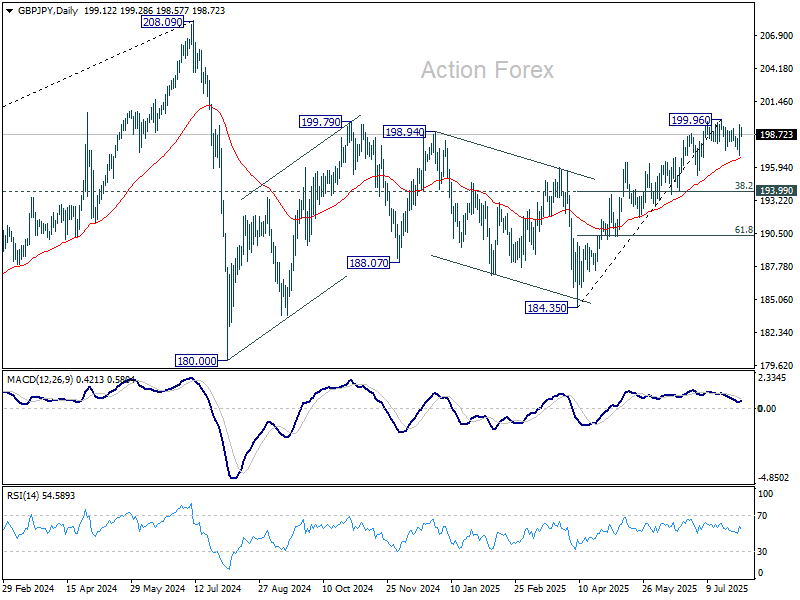
In the bigger picture, price actions from 208.09 (2024 high) are seen as a correction to rally from 123.94 (2020 low). The pattern might still extend with another falling leg. But in that case, strong support should be seen from 38.2% retracement of 123.94 to 208.09 at 175.94 to contain downside. Meanwhile, decisive break of 208.09 will confirm long term up trend resumption.
EUR/JPY Daily Outlook
Daily Pivots: (S1) 170.41; (P) 171.37; (R1) 173.03; More...
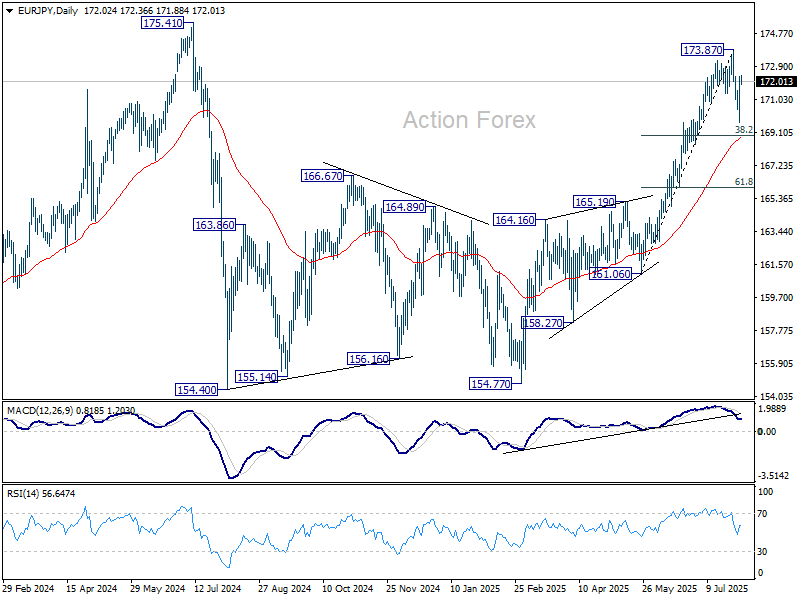
EUR/JPY rebounded strongly after diving to 169.69 and intraday bias is turned neutral. Corrective pattern from 173.87 might extend with a another falling leg. But downside should be contained by 38.2% retracement of 161.06 to 173.87 at 168.97. Firm break of 173.87 will resume larger rally from 154.77.
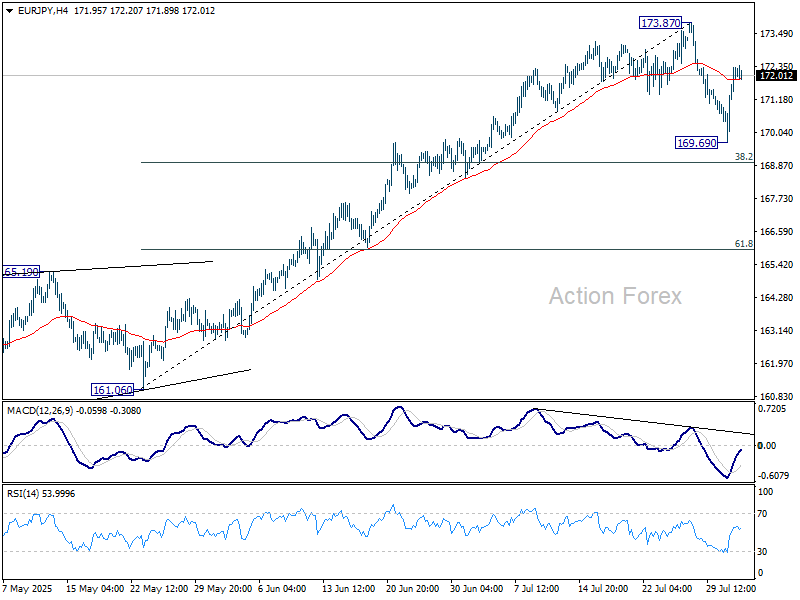
In the bigger picture, considering current strong momentum as seen in the rally from 154.77, corrective pattern from 175.41 could have already completed. Decisive break there will confirm long term up trend resumption. Next target is 61.8% projection of 124.37 to 175.41 from 154.77 at 186.31. However, rejection by 175.41, followed by firm break of 55 D EMA (now at 168.69) will delay this bullish case.
EUR/GBP Daily Outlook
Daily Pivots: (S1) 0.8597; (P) 0.8628; (R1) 0.8676; More...
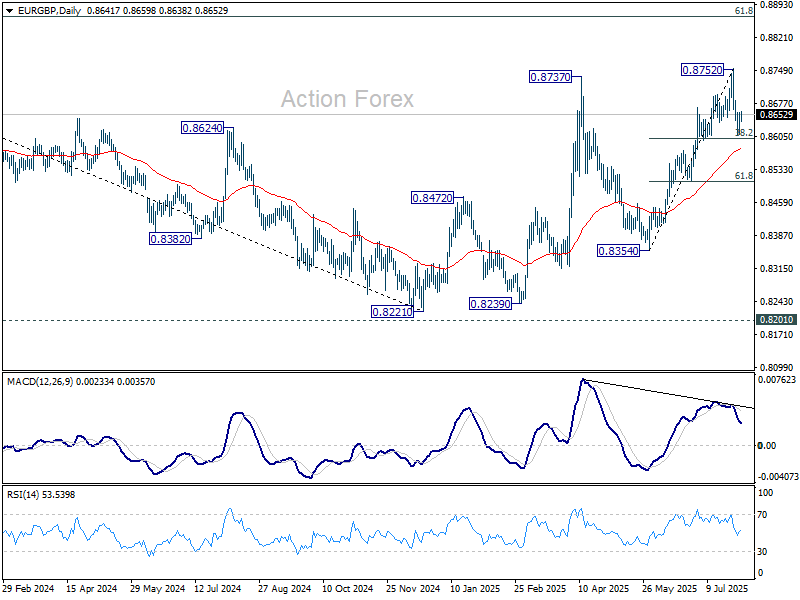
EUR/GBP recovered after dipping to 0.8609 and intraday bias is turned neutral first. While correction from 0.8752 might extend, strong support should emerge from 55 D EMA (now at 0.8576) to bring rebound. On the upside, above 0.8684 minor resistance will turn intraday bias neutral first. However, sustained trading below 55 D EMA will raise the chance of near term bearish reversal.
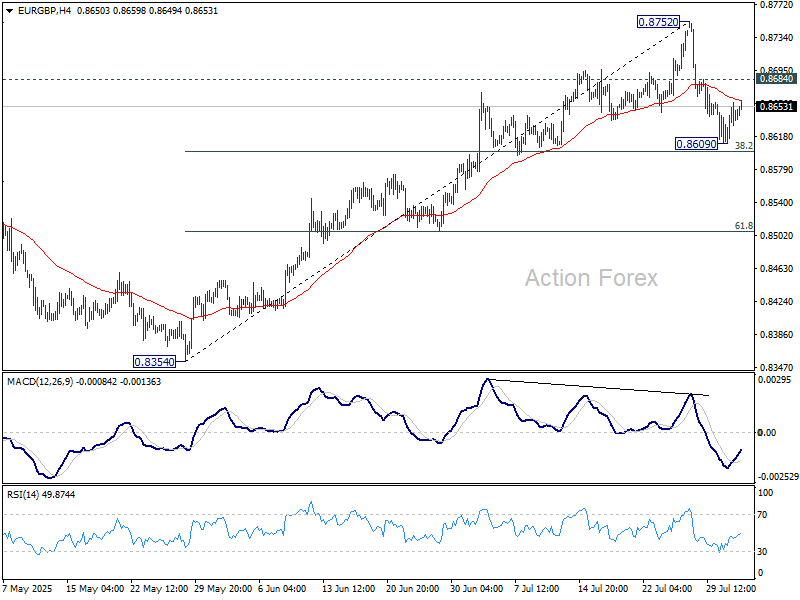
In the bigger picture, the structure from 0.8221 medium term bottom are not impulsive enough to suggest that it's reversing the down trend from 0.9267 (2022 high). But even if it's a correction, further rise is expected to 61.8% retracement of 0.9267 to 0.8221 at 0.8867. This will remain the favored case as long as 55 W EMA (now at 0.8486) holds.
EUR/AUD Daily Outlook
Daily Pivots: (S1) 1.7694; (P) 1.7746; (R1) 1.7819; More...
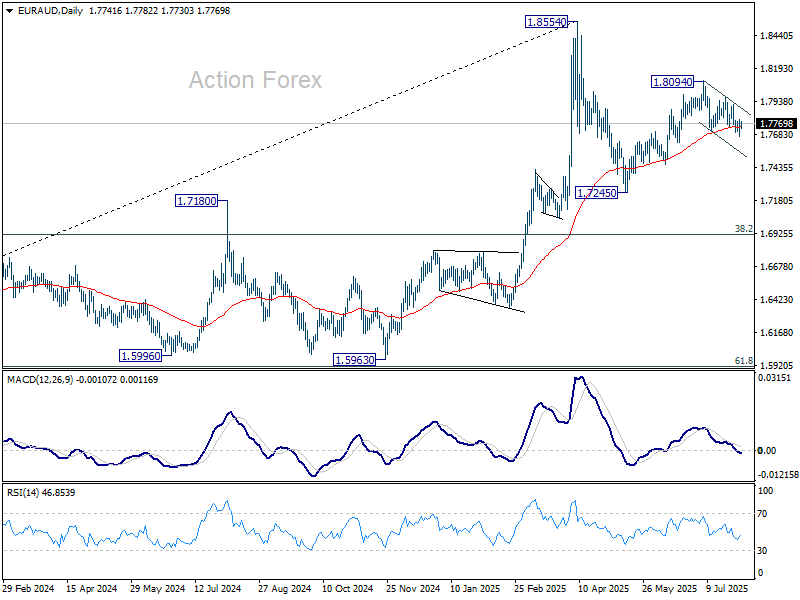
EUR/AUD recovered after dipping to 1.7671 and intraday bias is turned neutral first. Fall from 1.8094 is still seen as the third leg of the corrective pattern from 1.8554. Risk will stay on the downside as long as 1.7972 resistance holds. Below 1.7671 will target 1.7459 support next. Firm break there will solidify this case and target 1.7245 low.
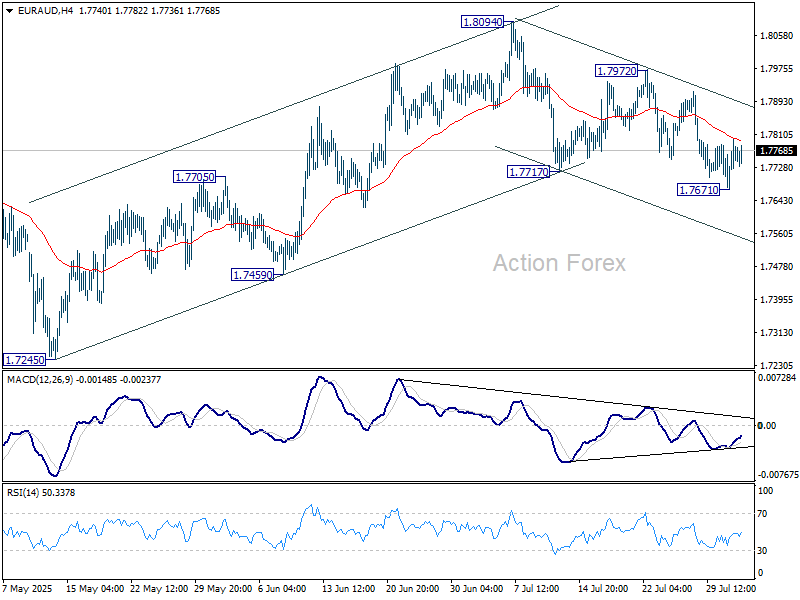
In the bigger picture, price actions from 1.8554 medium term top are seen as a corrective pattern. While deeper pullback might be seen, downside should be contained by 38.2% retracement of 1.4281 (2022 low) to 1.8554 at 1.6922 to bring rebound. Up trend from 1.4281 is expected to resume at a later stage.
EUR/USD Daily Outlook
Daily Pivots: (S1) 1.1391; (P) 1.1426; (R1) 1.1449; More...
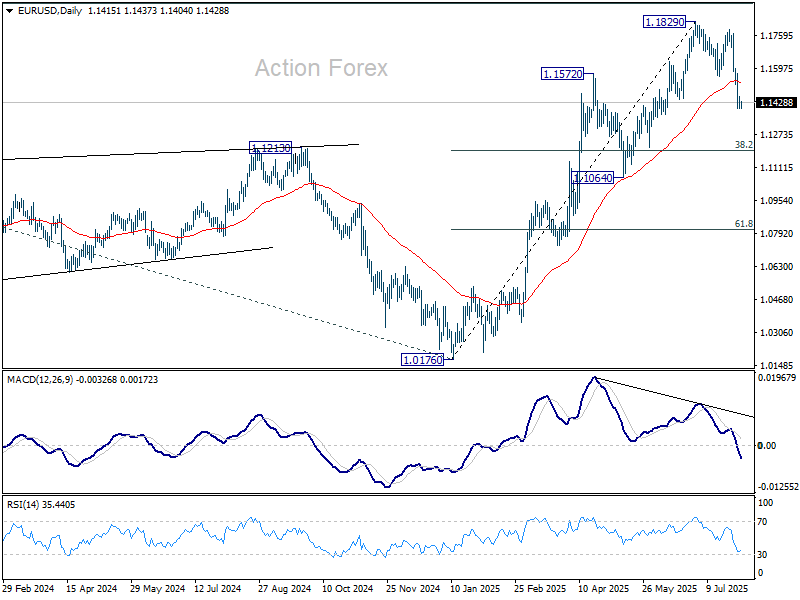
Intraday bias in EUR/USD remains on the downside at this point. Fall from 1.1829 is seen as a correction to rally from 1.0176. Further decline should be seen to 38.2% retracement of 1.0176 to 1.1829 at 1.1198. On the upside, break of 1.1502 minor resistance will turn intraday bias neutral first.
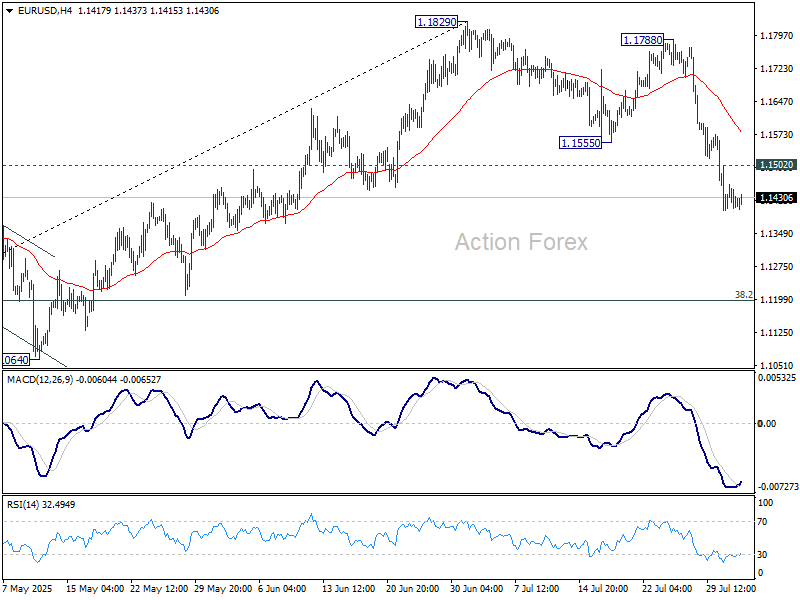
In the bigger picture, rise from 0.9534 long term bottom could be correcting the multi-decade downtrend or the start of a long term up trend. In either case, further rise should be seen to 100% projection of 0.9534 to 1.1274 from 1.0176 at 1.1916. This will remain the favored case as long as 1.1604 support holds.