Sample Category Title
Bitcoin supported by 112k confluence, uptrend still in play
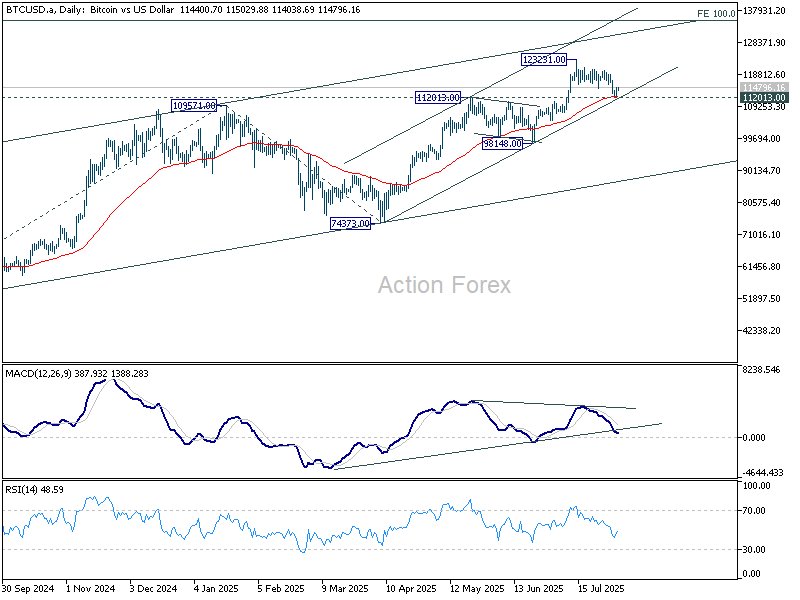
Crypto markets came under pressure last week as risk sentiment soured globally, dragging Bitcoin off recent highs. While the correction was sharp, BTC has found technical footing around a major cluster of support, offering bulls a chance to regroup.
Three key levels are now converging: the prior May high of 112,013, 55 D EMA at 112,331, and trendline support near 111,400. These levels could provide a solid floor for another upside attempt toward the record high at 123,231, assuming broader sentiment doesn’t deteriorate further.
But follow-through may be limited from there as momentum signals suggest caution. Bearish divergence in the daily MACD hints at fading strength, and strong resistance is expected around 100% projection of 49,008 to 109,571 from 74,373 at 134,936 to cap upside.
For now, the uptrend is alive, but ceiling would form below 135k.
WTI dips on OPEC+ hike, 65 to contain downside in range trade
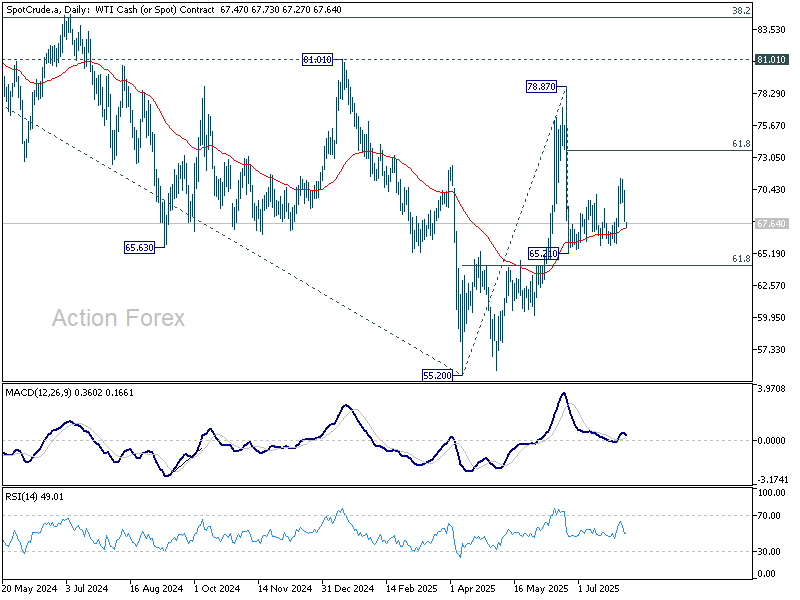
Crude oil prices slipped on Monday after OPEC+ announced another production boost, this time for September. The group confirmed a planned hike of 547k barrels per day, continuing its aggressive push to regain global market share after years of output cuts meant to prop up prices.
The shift began in April with a small supply increase, but since then OPEC+ has stepped on the gas. May through July each saw 411k bpd added, with larger hikes of 548k in August and now 547k bpd set for September.
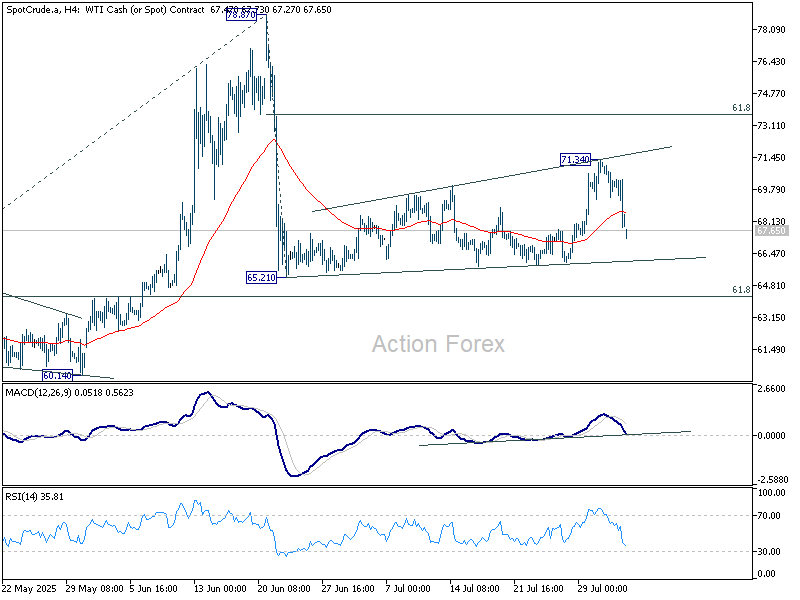
Despite briefly surging to nearly 79 in June amid Middle East tensions, WTI crude reversed sharply after the Israel–Iran ceasefire and dropped back to as low as 65.21. The bounce to 71.34 last week failed to sustain, and prices have turned lower again, signaling ongoing sideways consolidation rather than a breakout.
Technically, oil remains trapped in a range. Downside should be anchored near 65, upside appears capped below $73.65. However, even in event of a bounce through 71.34, momentum is expected to fade as oversupply concerns and tepid demand limit further gains below 61.8% retracement of 78.87 to 65.21 at 73.65.
Gold Wave Analysis
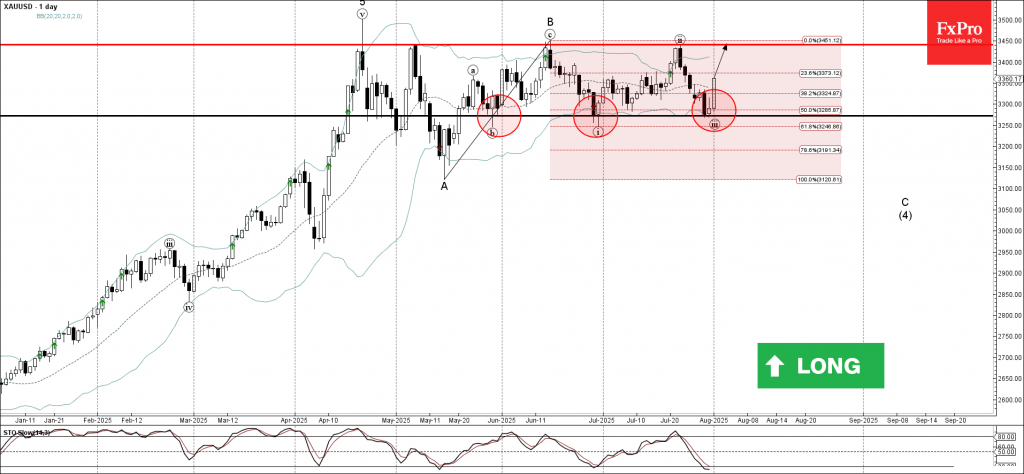
Gold: ⬆️ Buy
- Gold reversed from the support zone
- Likely to rise to the resistance level at 3450.00
Gold today reversed from the support zone between the support level 3272.00 (which has been reversing the price from the end of May), lower daily Bollinger Band and the 50% Fibonacci correction of the upward wave B from May.
The upward reversal from this support zone created the daily Japanese candlesticks reversal pattern, Morning Star.
Given the clear daily uptrend and the oversold daily Stochastic, Gold can be expected to rise to the next resistance level at 3450.00 (top of waves B and ii).
Bitcoin Wave Analysis
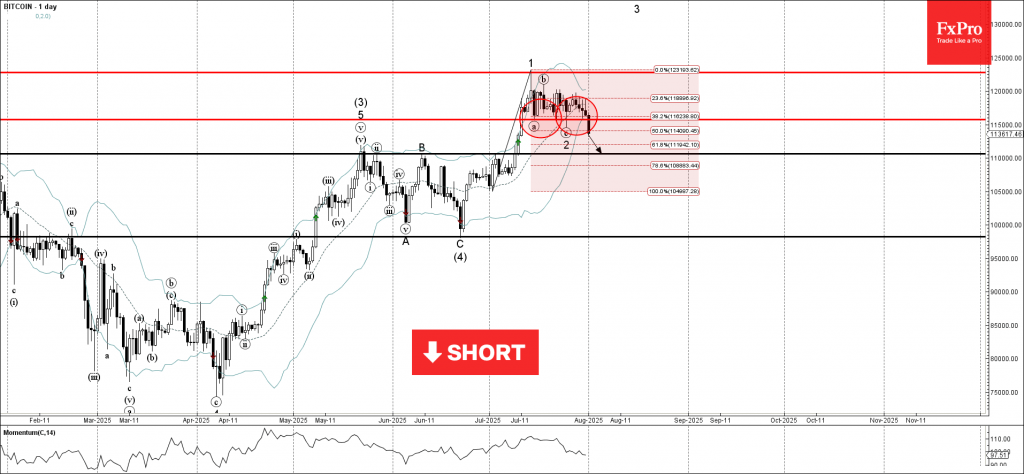
Bitcoin: ⬇️ Sell
- Bitcoin broke the pivotal support level 115000.00
- Likely to fall to support level 110000.00
Bitcoin cryptocurrency recently broke below the pivotal support level 115000.00, coinciding with the 50% Fibonacci correction of the sharp upward impulse from the start of July.
The breakout of the support level 115000.00 strengthened the bearish pressure on Bitcoin.
Given the bearish sentiment seen across the cryptocurrency markets today, Bitcoin can be expected to fall to the next support level at 110000.00 (former resistance from May and June).
Dow Jones Wave Analysis
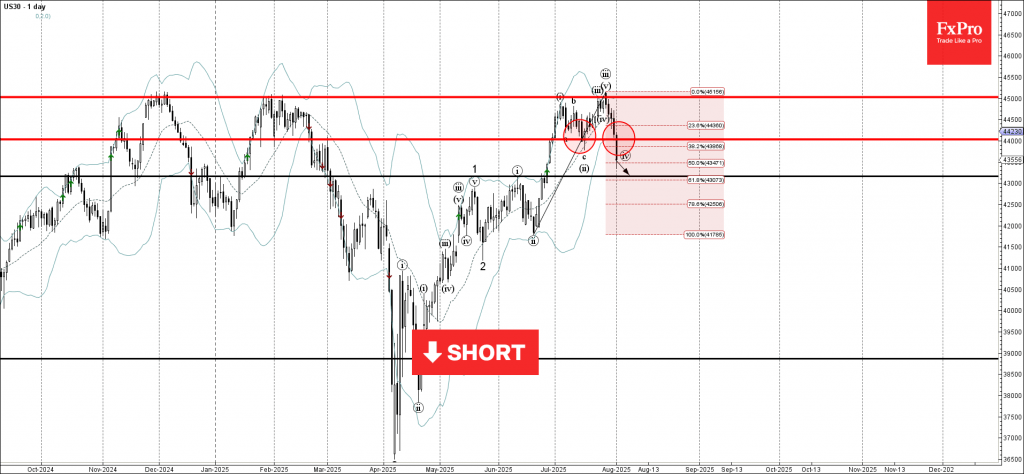
Dow Jones: ⬇️ Sell
- Dow Jones broke the support zone
- Likely to fall to support level 43000.00
The Dow Jones index broke the support zone between the support level 44000.00 and the 38.2% Fibonacci correction of the upward impulse from June.
The breakout of this support zone accelerated the active short-term correction iv.
Dow Jones index can be expected to fall to the next support level at 43000.00 (target for the completion of the active correction iv and the former resistance from May and June).
From Optimism to Unrest, Summer Rally Cracks
Markets entered last week riding a wave of optimism, but exited rattled. Wall Street could have marked the end of its summer rally, with Friday’s sharp selloff capping a week of crosswinds, from upbeat GDP numbers and trade deals to dismal job data and institutional upheaval. Dollar, too, saw its recent momentum falter, closing the week on the defensive after a punishing shift in Fed rate expectations.
At first, things looked encouraging. US agreements with the EU and South Korea signaled a more measured stance on trade, and GDP growth surprised to the upside. But those positives were quickly overshadowed as the tariff truce deadline neared and details of new reciprocal duties rolled in. Investors were reminded that the trade war remains anything but resolved.
Then came the Payrolls report, well below expectations, and prior months were revised down dramatically. Markets quickly recalibrated: instead of pushing out a Fed rate cut, traders began pricing in a fast-paced easing cycle through year-end.
But perhaps more damaging than data was the growing sense of political encroachment. The credibility of US institutions appeared increasingly fragile.
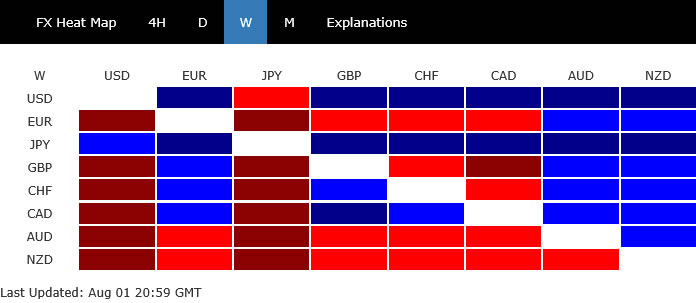
Against this backdrop, Yen soared to the top of the performance board, benefiting from both falling yields and risk aversion. Dollar finished second strongest but faces near-term vulnerability. Meanwhile, Kiwi and Aussie lagged as risk sentiment soured. Euro, Sterling, Swiss Franc and Loonie floated in the middle.
US Markets Slide as Institutional Uncertainty Mounts, Top Formed in S&P 500
US equity markets ended the week on a sour note, closing sharply lower as traders digested a flurry of destabilizing developments. While headline risks around tariffs and economic data played a role, it was the unsettling signs of political intrusion into the Fed and Labor Department that likely sparked the more lasting concern. After a technical breakdown, sentiment is at risk of deteriorating further unless institutional confidence is restored.
On tariffs, the shock factor was significantly less than it appeared at first glance. Key trading partners such as the EU, South Korea, and Japan had already secured bilateral deals locking tariffs at 15%. Ongoing talks with China remain a wildcard, but most Asian exporters are subject to lower-than-expected rates. This calibration helped limit fallout in Asian markets earlier in the week and calmed some of the worst-case fears.
The effective weighted average tariff now stands around 18%. That’s just a two-point increase from pre-announcement levels and far below the 30% peak reached in the post-Liberation Day flare-up with China in early April. While the announcement stirred geopolitical headlines, the substance was relatively modest, particularly for investors who had already priced in aggressive US trade posture.
Therefore, attention quickly shifted to Friday’s jobs data, which dealt a heavier blow. The July non-farm payroll report showed just 73k new jobs. But the real shock came from the downward revisions: June’s headline was slashed from 147k to just 14k, and May was cut from 125k to 19k. That’s a combined downward revision of 239,000 jobs—enough to seriously damage confidence in the strength of the labor market. It also gave weight to the dovish warnings from within the Fed that policy may already be behind the curve.
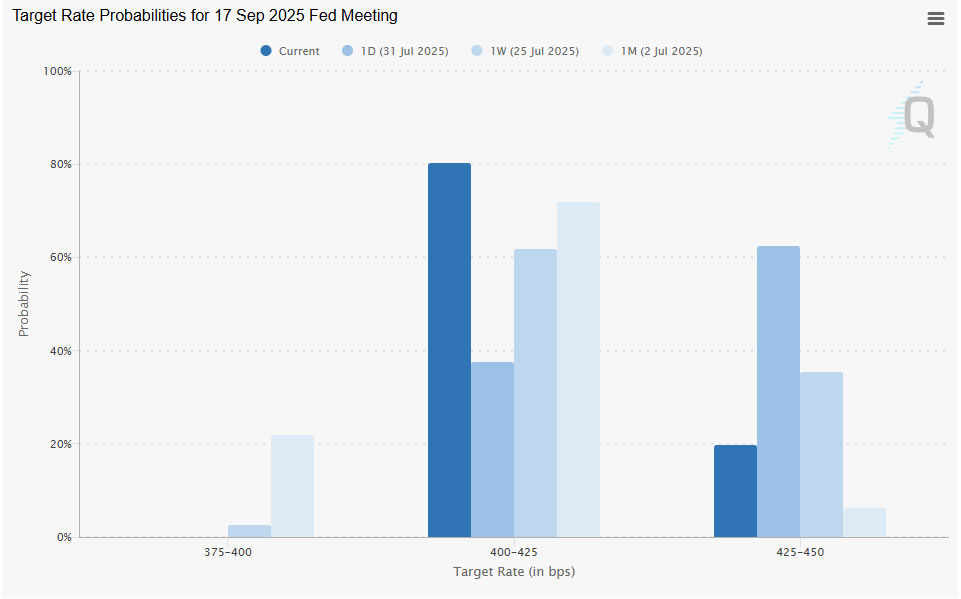
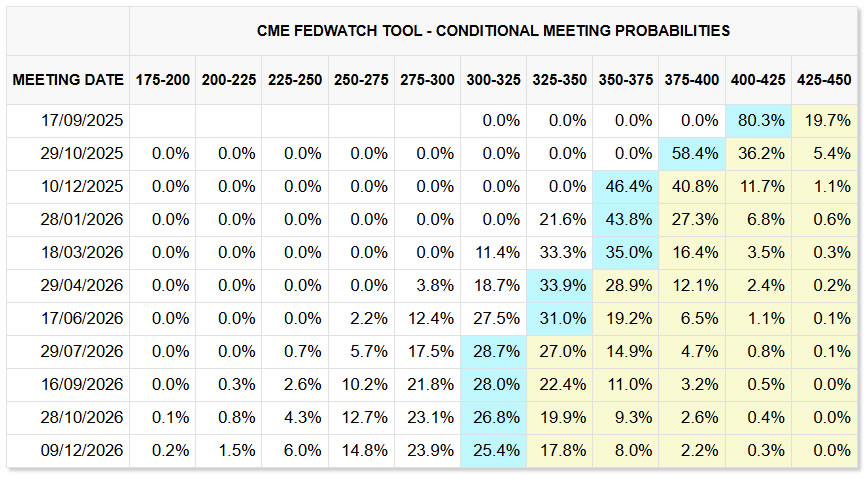
Fed rate cut expectations snapped back in response. Following the July FOMC hold and Powell’s measured tone, markets had lowered the probability of a September cut to around 40%. But in the wake of the labor data, those odds surged to 80%. With two CPI reports (Aug 12, Sep11) and one more payroll (Sep 5) print to come before the September 17 meeting, markets are now betting the Fed will move preemptively rather than risk being blamed for inaction.
Indeed, the logic is political as much as economic. Given the extent of revisions and the clear trend in slowing job growth, the prudent path for the Fed is now to ease policy before a harder downturn arrives. Even if inflation holds steady or ticks slightly higher due to tariffs, the case for insurance cuts is growing stronger. That should provide at least some cushion for risk assets in the near term, rather than hammering them.
But that cushion may not hold if institutional stability continues to unravel. On Friday, the Fed announced that Governor Adriana Kugler will step down on August 8—well before her term expires on January 31, 2026. Her resignation stunned many observers and added another twist to the unfolding Fed succession drama. Analysts speculate Kugler may be signaling resistance to mounting political pressure, as Trump is taking efforts to remake the Fed Board before Powell’s term ends next May.
Kugler’s exit opens the door for Trump to nominate a new Fed governor who could become a potential contender for Chair. That adds an element of political maneuvering into an already sensitive institutional transition. With Powell’s future unclear and speculation swirling over Trump’s desire to replace him, the balance of the FOMC could shift faster than previously assumed. Markets may soon need to price in a Fed not only reacting to data, but increasingly shaped by political forces.
Worse, the sense of political interference was amplified by Trump’s abrupt firing of Erika McEntarfer, a senior Labor Department official responsible for labor statistics. Just hours after the disappointing payroll data, Trump accused McEntarfer—without evidence—of manipulating jobs numbers. The Bureau of Labor Statistics, historically apolitical and technocratic, now faces a crisis of credibility under direct attack from the White House.
The implications of firing a data official for producing “unfavorable” numbers are chilling. Confidence in economic data is critical for markets, policymakers, and institutions alike. Undermining that trust could have broader consequences than any single jobs report or rate cut.
S&P 500's steep decline on Friday should confirm short term topping at 6247.02, just ahead of 61.8% projection of 3491.58 to 6147.43 from 4835.04 at 6476.35. Deeper correction is expected in the near term to 55 D EMA (now at 6122.61). Strong rebound from the EMA will keep near term outlook bullish, for up trend resumption sooner rather than later.
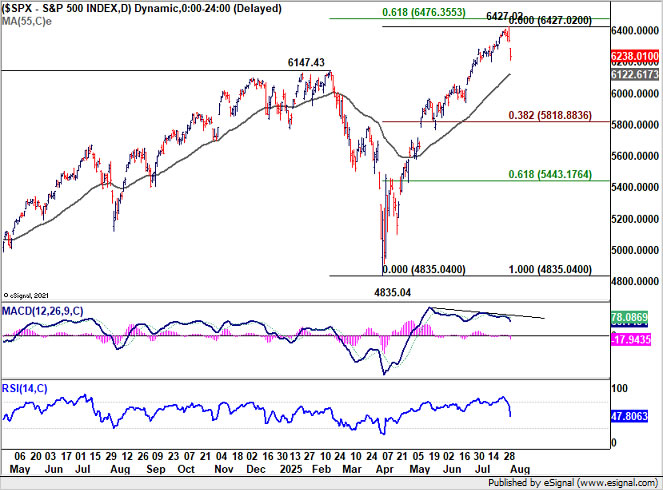
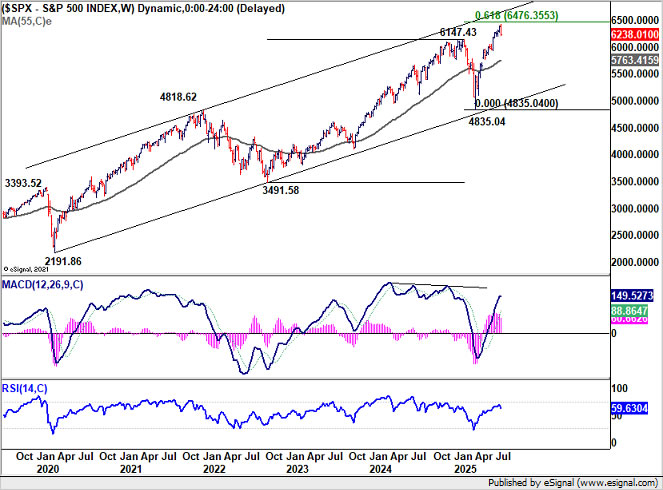
However, sustained trading below the EMA will indicate that S&P 500 is at least correcting the rise from 4835.04. Further decline should then be seen to 38.2% retracement of 4835.04 to 6427.02 at 5818.88, or even further to 55 W EMA (now at 5763.41).
Dollar Bulls Lose Grip as Traders Price in Faster, Earlier Fed Easing
Market conviction around earlier and faster Fed rate cuts is gaining significant momentum. Fed fund futures now reflect 80% probability of a 25bps September cut, up sharply from 65% the prior week. Meanwhile, the October meeting is now seen carrying a near 60% chance of another cut. Additionally, there is 46.4% chance that the Fed would deliver three consecutive cuts through December.
This dovish shift in Fed expectations is already weighing heavily on the Dollar. At the same time, the greenback is also weighed down by Euro's strength. There are increasing sign that the ECB may be done with its own rate cuts. The Eurozone economy appears to have stabilized during the summer, supported by an EU–US trade détente and Germany’s new stimulus measures. Swap markets and major bank forecasts are converging around the view that the ECB’s current 2.00% deposit rate is its terminal level.
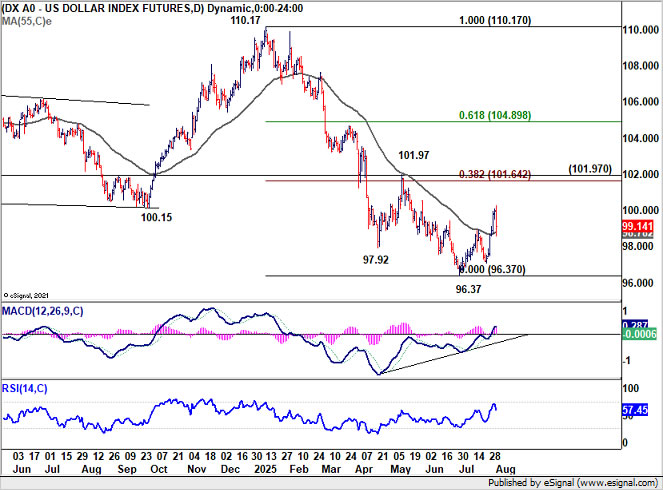
Technically, Dollar Index touched 100.25 last week, but Friday’s post-NFP selloff dragged it down to 99.14 at the weekly close. The price actions now slightly favor the view that the rebound from 96.37 was merely corrective within a broader downtrend. Unless there is notable pickup in upward momentum, even in case of another rise, upside should be limited by 101.97 resistance zone (38.2% retracement of 110.17 to 96.37 at 101.64).
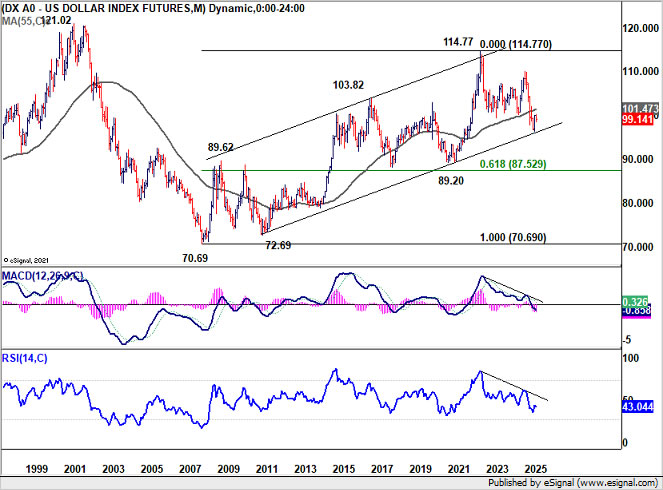
Zooming out, Dollar Index also faces a critical long-term decision. Monthly charts show price sitting below 55 M EMA (now at 101.47). Sustained trading above there will argue that corrective down trend from 114.77 has completed after drawing support from the decade long channel support, and revive bullish potential. However, rejection by the 55 M EMA could push Dollar Index through the channel support, which would then indicate bearish reversal.
Yen Rallies to Weekly Top as Global Yields Sink, NZD/JPY a Top Mover
Yen unexpectedly topped the performance chart last week, ended as the strongest major currency, capping off a highly volatile stretch marked by shifting narratives. Initially lifted by pre-BoJ positioning after the US–Japan trade deal, Yen saw strong buying from traders guarding against a hawkish surprise. But those bets were quickly unwound after BoJ downplayed near-term inflation risks, attributing the recent price surge largely to food-related factors that are expected to fade.
However, what ultimately powered Yen's rebound was the sharp post-NFP decline in global bond yields, led by the US. Friday’s disappointing US jobs data triggered a sharp repricing in Fed expectations, dragging the US 10-year yield steeply lower. That, in turn, gave the yield-sensitive Yen renewed strength.
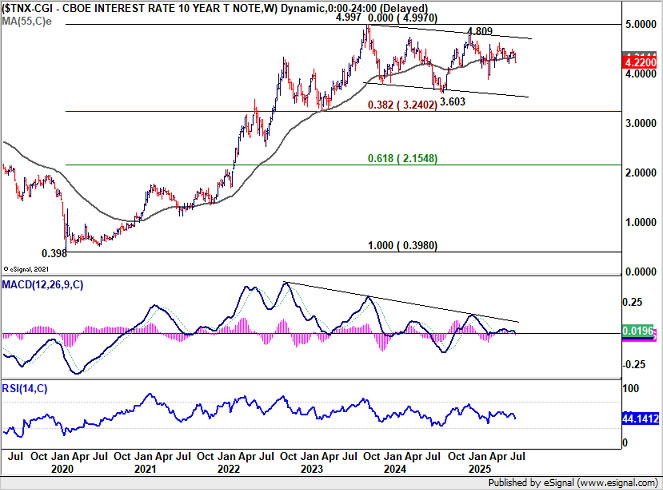
Technically, US 10-year yield is now approaching 4.205 key near term support. Firm break there will bring further fall to 100% projection of 4.629 to 4.205 from 4.493 at 4.069.
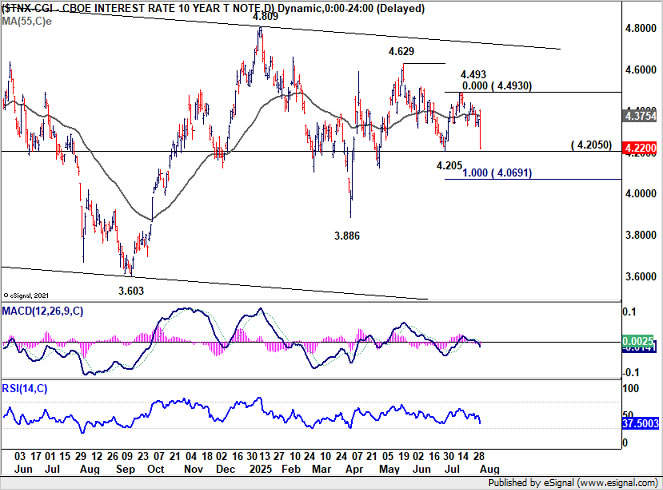
More importantly, it should be noted that current decline from 4.629 is part of the medium term range pattern from 4.997 (2023 high). Downside acceleration through 4.069 could easily push 10-year yield towards 3.886 support.
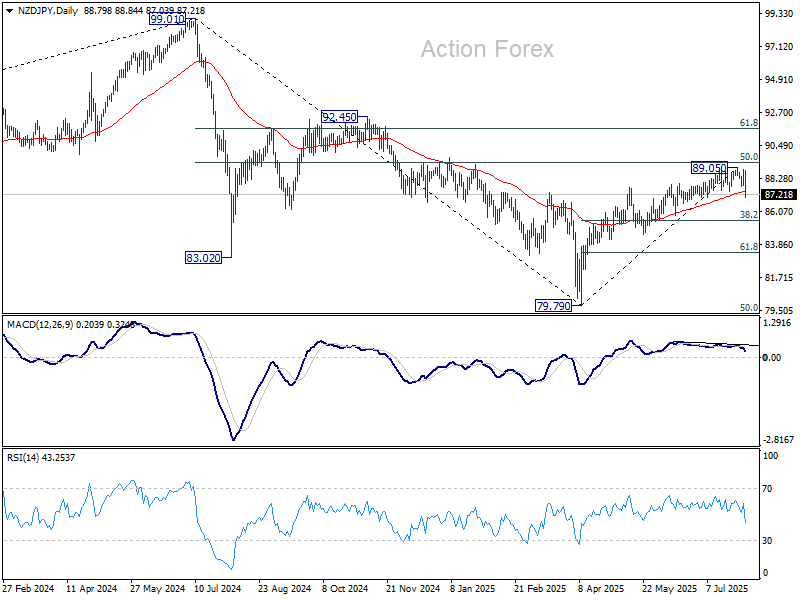
NZD/JPY ended as one of the top movers. Considering bearish divergence condition in D MACD, and break of 55 D EMA (now at 87.43), a short term top should be in place at 89.05. Price actions from there are tentatively seen as a corrective move only. Deeper decline is expected to 38.2% retracement of 79.79 to 89.05 at 85.51. Strong support should be seen there to bring rebound to set the range for consolidations.
However, extended fall in US 10-year yield, in particular with a break below 4% psychological level, could give Yen an extra push. Firm break of 85.51 in NZD/JPY would raise the chance of near term bearish reversal and pave the way to 61.8% retracement at 83.32.
EUR/USD Weekly Outlook
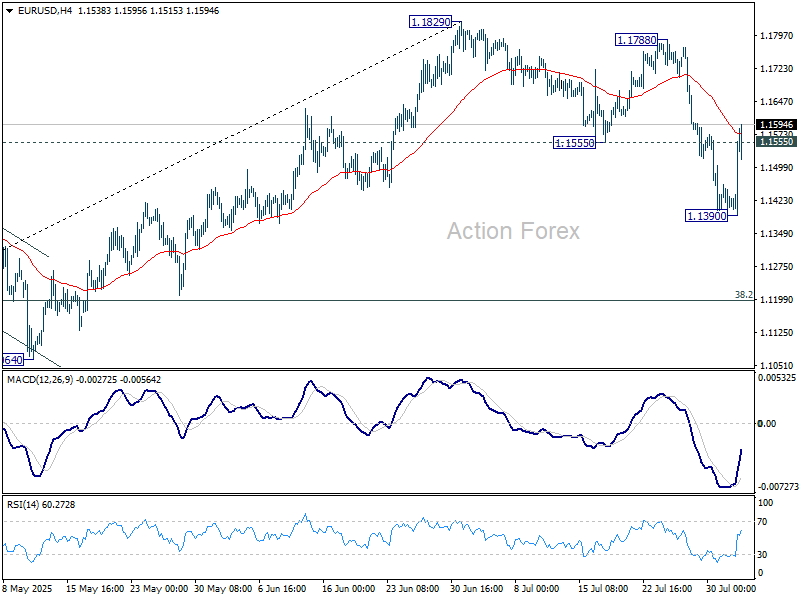
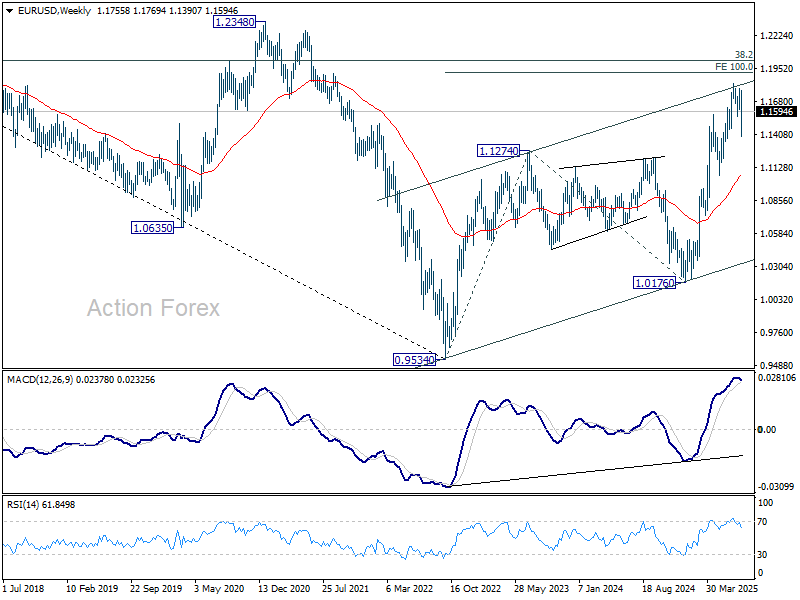
EUR/USD dived to 1.1390 last week, but subsequent rebound and break of 1.1555 support turned resistance suggests that fall from 1.1829 has completed as a three-wave correction. Initial bias is back on the upside this week for 1.1788/1820 resistance zone. On the downside, break of 1.1390 will resume the correction to 38.2% retracement of 1.0176 to 1.1829 at 1.1198.
In the bigger picture, rise from 0.9534 long term bottom could be correcting the multi-decade downtrend or the start of a long term up trend. In either case, further rise should be seen to 100% projection of 0.9534 to 1.1274 from 1.0176 at 1.1916. This will remain the favored case as long as 1.1604 support holds.
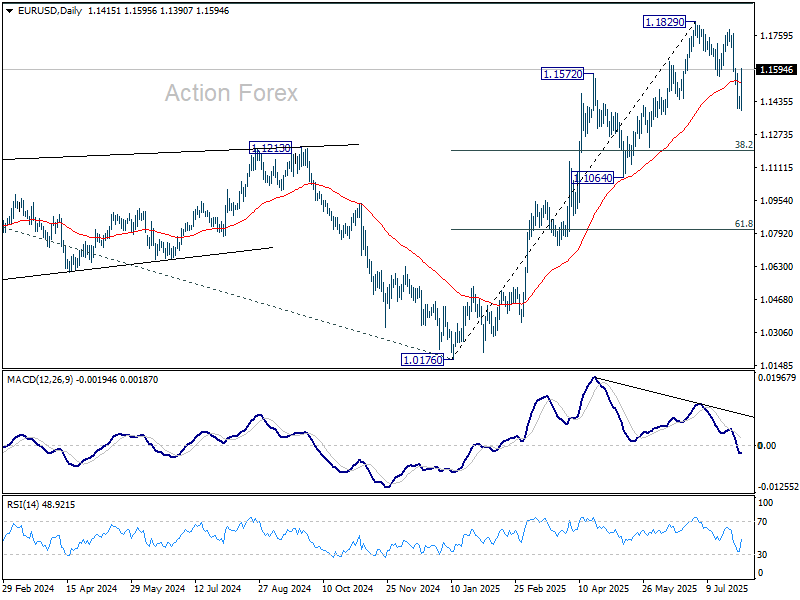
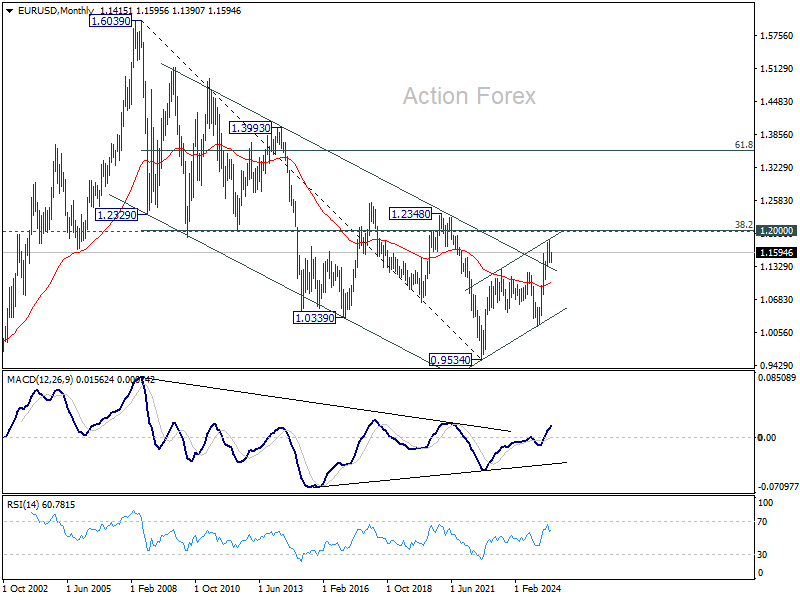
In the long term picture, a long term bottom was in place already at 0.9534, on bullish convergence condition in M MACD. Further rise should be seen to 38.2% retracement of 1.6039 to 0.9534 at 1.2019. Rejection by 1.2019 will keep the price actions from 0.9534 as a corrective pattern. But sustained break of 1.2019 will suggest long term bullish trend reversal, and target 61.8% retracement at 1.3554.
EUR/USD Weekly Outlook
EUR/USD dived to 1.1390 last week, but subsequent rebound and break of 1.1555 support turned resistance suggests that fall from 1.1829 has completed as a three-wave correction. Initial bias is back on the upside this week for 1.1788/1820 resistance zone. On the downside, break of 1.1390 will resume the correction to 38.2% retracement of 1.0176 to 1.1829 at 1.1198.
In the bigger picture, rise from 0.9534 long term bottom could be correcting the multi-decade downtrend or the start of a long term up trend. In either case, further rise should be seen to 100% projection of 0.9534 to 1.1274 from 1.0176 at 1.1916. This will remain the favored case as long as 1.1604 support holds.
In the long term picture, a long term bottom was in place already at 0.9534, on bullish convergence condition in M MACD. Further rise should be seen to 38.2% retracement of 1.6039 to 0.9534 at 1.2019. Rejection by 1.2019 will keep the price actions from 0.9534 as a corrective pattern. But sustained break of 1.2019 will suggest long term bullish trend reversal, and target 61.8% retracement at 1.3554.
USD/JPY Weekly Outlook
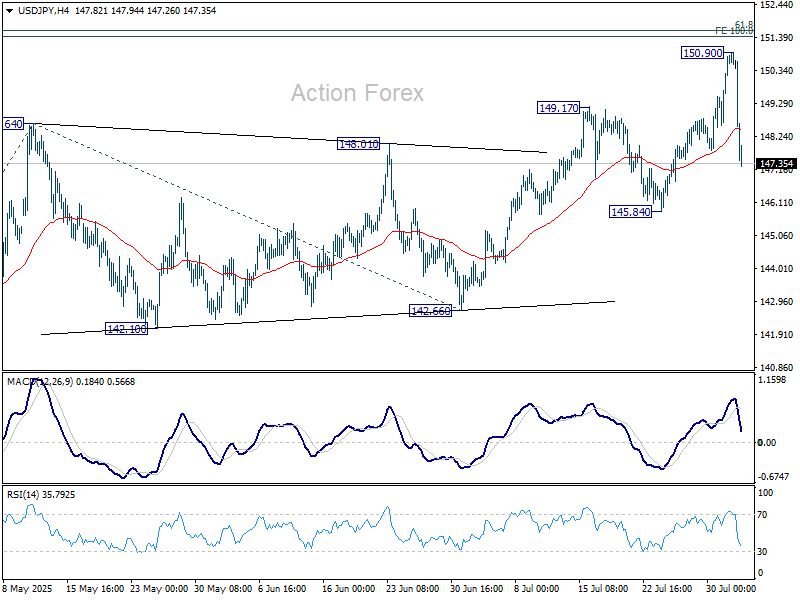
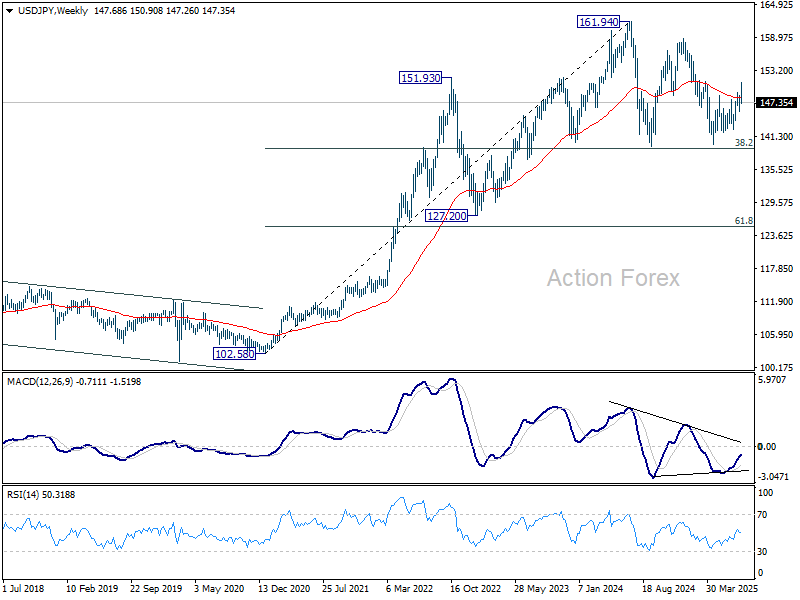
USD/JPY rose further to as high as 150.90 last week but reversed ahead of 100% projection of 139.87 to 148.64 from 142.66 at 151.43. Initial bias stays neutral this week first. On the downside, firm break of 145.84 support will argue that whole rise from 139.87 might have already completed. Deeper fall should then be seen to 142.66 support for confirmation. On the upside, above 150.99 will resume the rebound to 151.22 fibonacci level.
In the bigger picture, price actions from 161.94 (2024 high) are seen as a corrective pattern to rise from 102.58 (2021 low). Decisive break of 61.8% retracement of 158.86 to 139.87 at 151.22 will argue that it has already completed with three waves at 139.87. Larger up trend might then be ready to resume through 161.94 high. In case the corrective pattern extends with another fall, strong support is expected from 38.2% retracement of 102.58 to 161.94 at 139.26 to bring rebound.
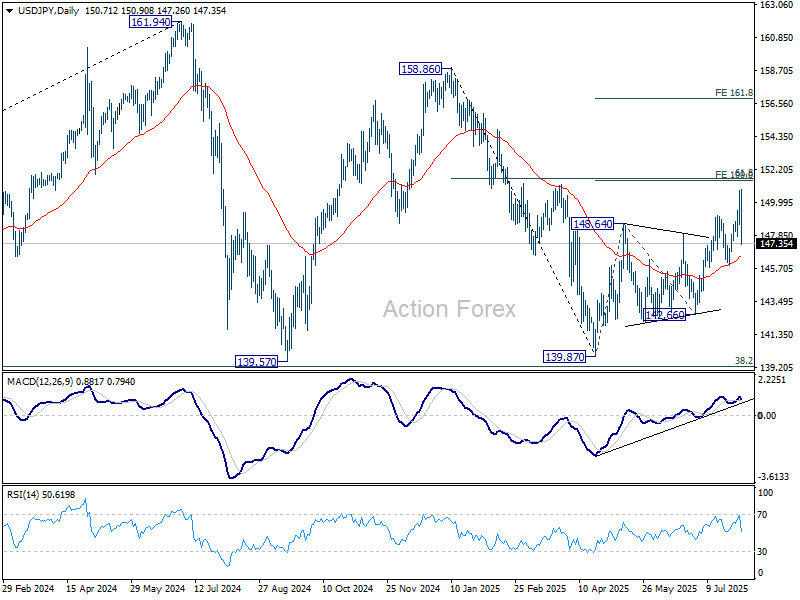
In the long term picture, there is no sign that up trend from 75.56 (2011 low) has completed. But then, firm break of 161.94 is needed to confirm resumption. Otherwise, more medium term range trading could still be seen.

GBP/USD Weekly Outlook
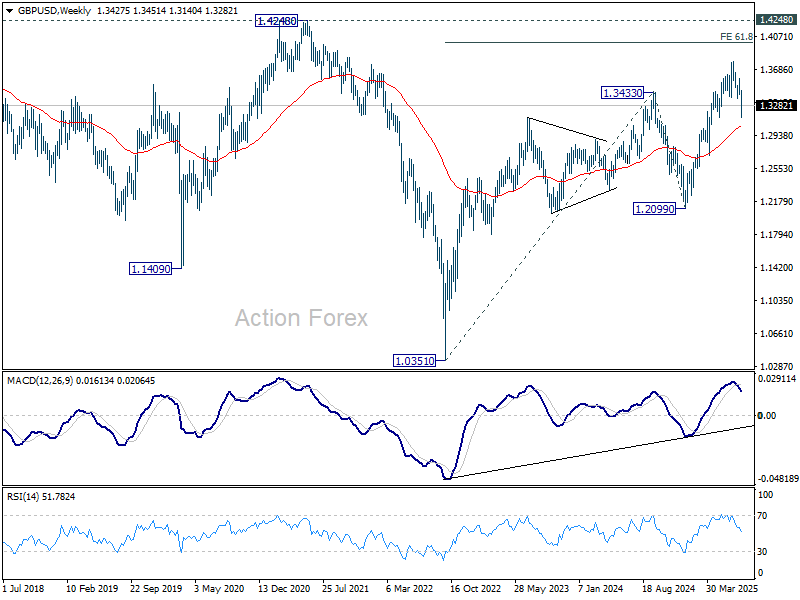
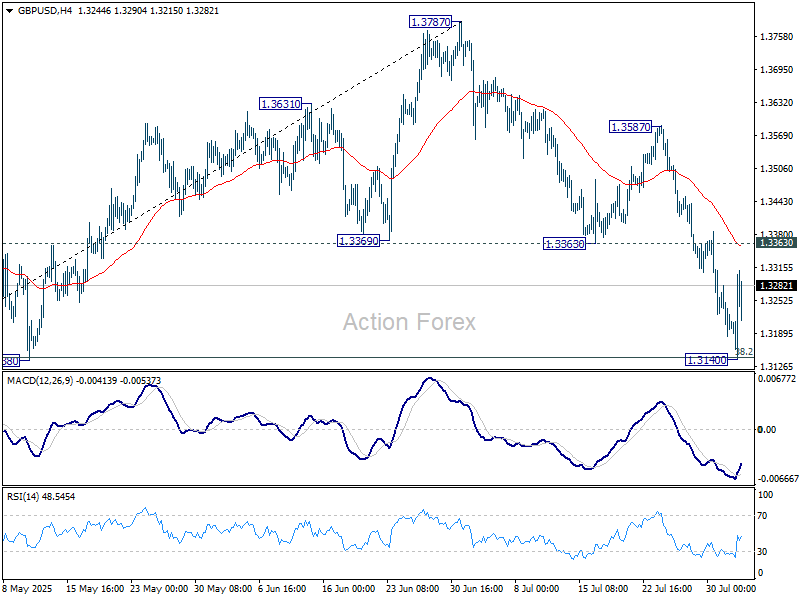
GBP/USD's fall from 1.3787 resumed to 1.3140 last week but rebounded after hitting 38.2% retracement of 1.2099 to 1.3787 at 1.3142. Initial bias remains neutral this week first. On the upside, sustained break of 1.3363 support turned resistance will indicate that the fall has completed as a three-wave correction. Further rally should then be seen back to 1.3587 resistance next. Nevertheless, sustained trading below 1.3142 will target 61.8% retracement at 1.2744.
In the bigger picture, up trend from 1.3051 (2022 low) is in progress. Next medium term target is 61.8% projection of 1.0351 to 1.3433 from 1.2099 at 1.4004. Outlook will now stay bullish as long as 55 W EMA (now at 1.3032) holds, even in case of deep pullback.
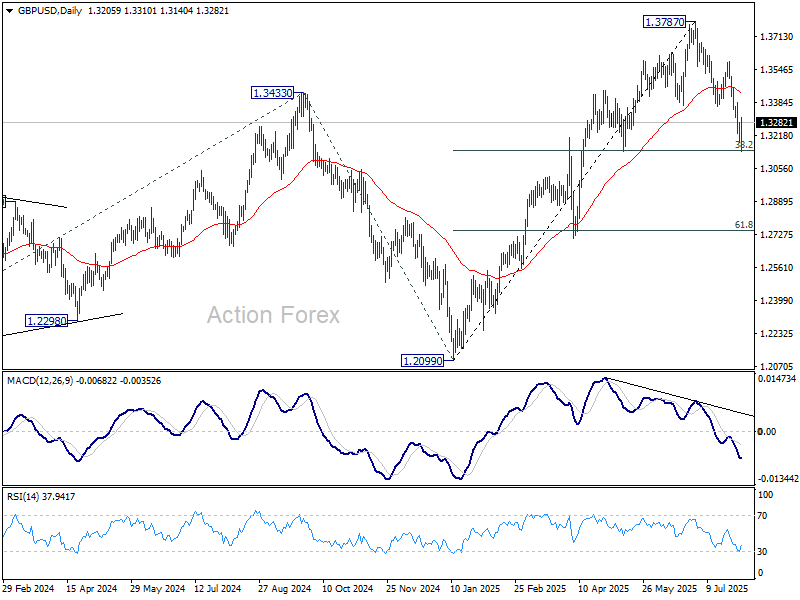
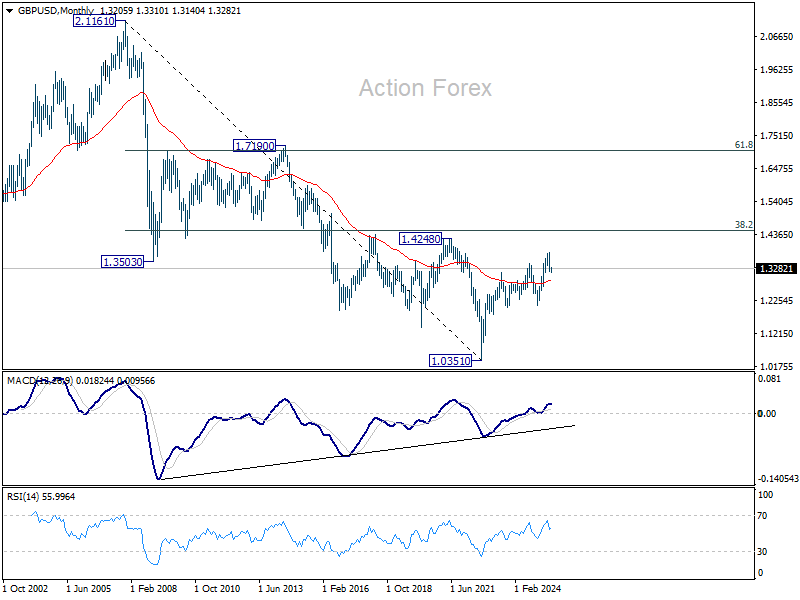
In the long term picture, for now, price actions from 1.0351 (2022 low) are still seen as a corrective pattern to the long term down trend from 2.1161 (2007 high) only. However, firm break of 1.4248 resistance (38.2% retracement of 2.1161 to 1.0351 at 1.4480) will be a strong sign of long term bullish reversal.