Sample Category Title
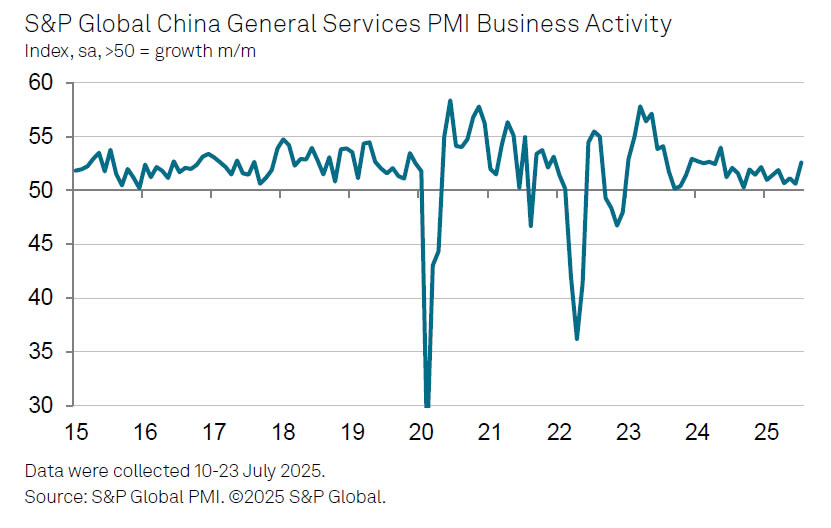
China’s Caixin Services PMI surges to 52.6, on stronger demand and renewed optimism
China’s Caixin Services PMI jumped sharply from 50.6 to 52.6 in July, well ahead of expectations at 50.4, marking the fastest pace of expansion since May 2024. PMI Composite, owever, fell from 51.3 to 50.8 as dragged down by weak manufacturing.
According to S&P Global’s Jingyi Pan, the rise was driven by better domestic demand and a notable improvement in external demand, with new export business expanding for the first time in three months. Business sentiment also improved, reaching the highest level since March.
Firms also began hiring again, albeit mostly part-time. Importantly, companies felt confident enough to raise output charges for the first time in six months — a sign that inflation pressures are being more easily passed on to clients.
Gold Edges Higher – Will the Rally Pick Up Speed?
Key Highlights
- Gold started a fresh increase above the $3,350 resistance.
- It now faces a major hurdle at $3,400 on the 4-hour chart.
- WTI Crude Oil prices declined below the $68.20 support zone.
- EUR/USD is recovering higher from the 1.1400 support zone.
Gold Price Technical Analysis
Gold prices formed a base above $3,325 and started a fresh increase. The bulls gained strength and were able to push the price above the $3,350 resistance.
The 4-hour chart of XAU/USD indicates that the price settled above the $3,350 level, the 100 Simple Moving Average (red, 4 hours), and the 200 Simple Moving Average (green, 4 hours). There was a move above the 61.8% Fib retracement level of the downward move from the $3,438 swing high to the $3,268 low.
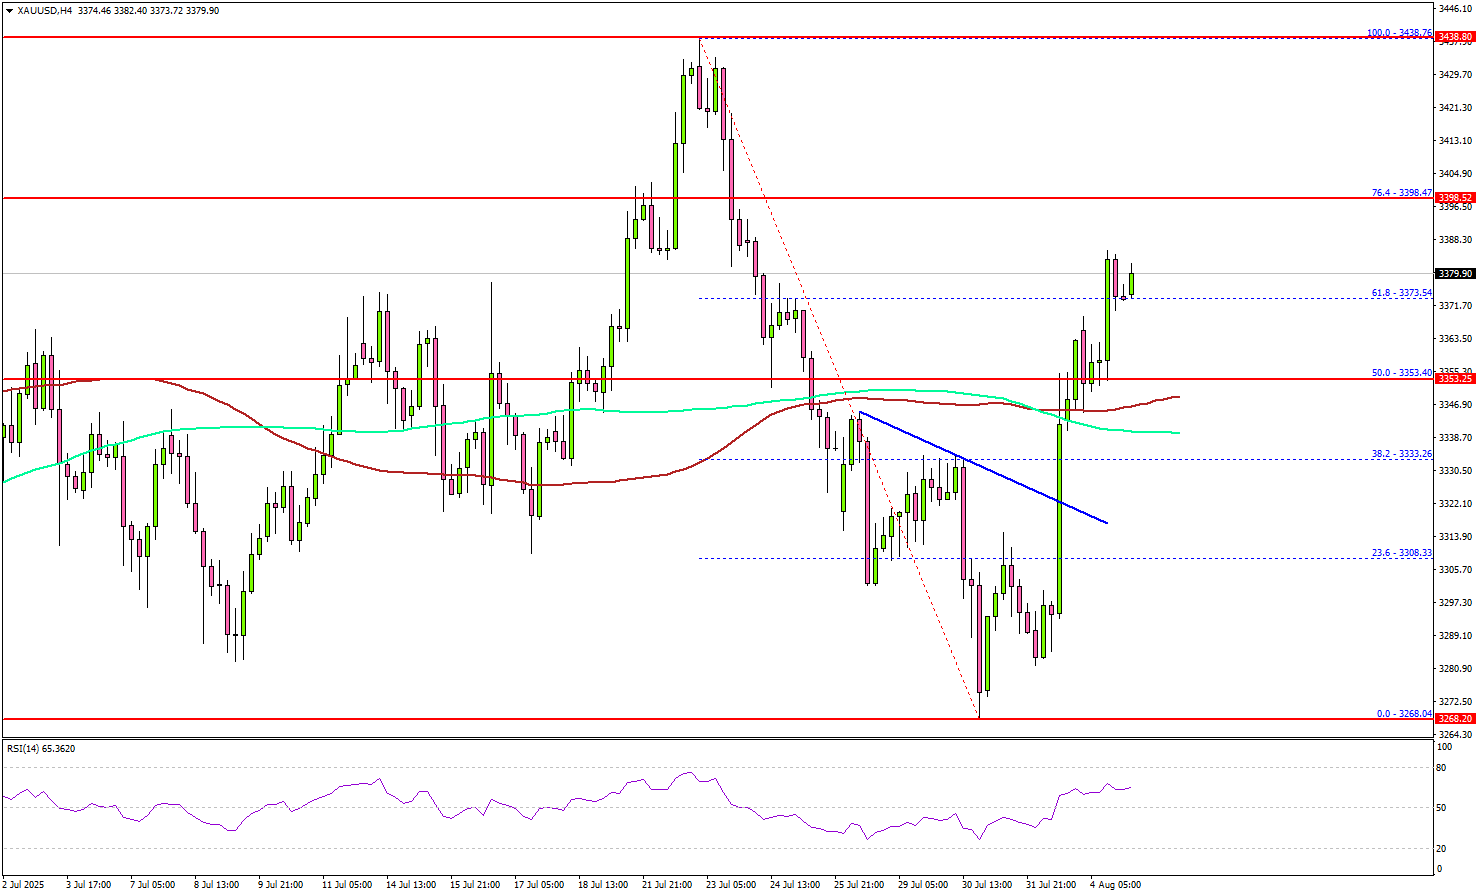
On the upside, immediate resistance is near the $3,400 level. It is near the 76.4% Fib retracement level of the downward move from the $3,438 swing high to the $3,268 low.
The next major resistance sits near the $3,420 level. The main barrier could be $3,432. A clear move above the $3,432 resistance could open the doors for more upsides. The next major resistance could be $3,440, above which the price could rally toward the milestone level of $3,450.
On the downside, initial support is near the $3,365 level. The first key support is $3,350. The next major support is near the $3,340 level. The main support is now $3,315.
A downside break below the $3,315 support might call for more downsides. The next major support is near the $3,300 level.
Looking at WTI Crude Oil, the price shows many bearish signs and could decline further below the $66.00 support zone.
Economic Releases to Watch Today
- Euro Zone Services PMI for July 2025 – Forecast 51.2, versus 51.2 previous.
- UK Services PMI for July 2025 – Forecast 51.2, versus 51.2 previous.
- US Services PMI for July 2025 – Forecast 55.2, versus 55.2 previous.
- US ISM Services Index for July 2025 – Forecast 51.5, versus 50.8 previous
Silver (XAG/USD): Silver Holds Firm Above $37.00 on Weak Jobs Data, Rate Cut Bets and Confirmed Reciprocal Tariffs
Trading in the region of $37.35700 in today’s session, Silver looks to continue bullish momentum shown in Friday’s session, rallying from monthly lows.
Silver (XAG/USD): Key takeaways from today’s session
- Writing after Friday’s weak job report, Silver has found support on a weakened dollar and as traders adjust expectations for Fed monetary policy
- Latest developments on trade tariffs are also boosting safe-haven inflows, benefiting silver pricing
Silver (XAG/USD): Weak US labor data bodes well for precious metals
Having recently succumbed to short-term selling pressure from all-time highs made in late July, recent US jobs data has helped bolster precious metal pricing.
Missing expectations by some margin, coupled with some significant revisions to previous months, Friday’s nonfarm payroll represents not only a poor result, but poses a serious threat to previously held convictions that the US labor market is healthy.
This goes double for the Fed, who have used the perceived health of the US labor market as a reason to defer the lowering of rates.
Meanwhile, POTUS Donald Trump claims the jobs numbers have been doctored for political gain, firing BLS official Erika McEntarfer. If nothing else, this raises questions on how future economic data will be recieved by markets alike.
At least one outcome has been a defiant increase in rate cut bets, with market ovewhelming predicting the Fed will cut in their upcoming decision, which is a undeniable positive for silver pricing.
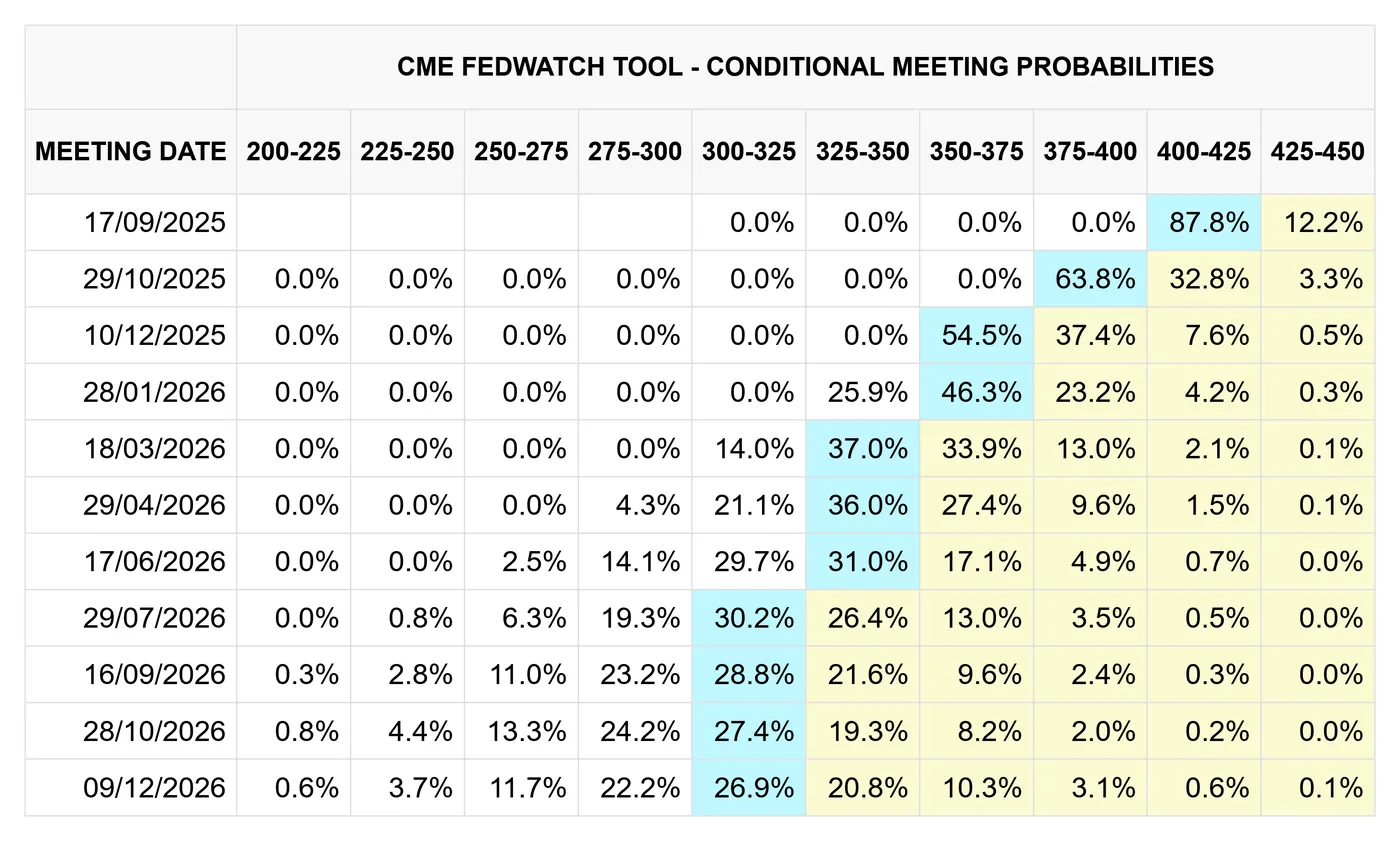
CME FedWatch, 04/08/2025
Putting things in perspective, silver, previous metals in general, boast one of the best yearly performances of all asset classes bar crypto, even while US rates have have been maintained at ~4.50% since December of last year.
Silver (XAG/USD): Commitment to reciprocal tariffs silver positive
In a relationship well studied by the market, recent developments surrounding tariffs are safe-haven flows, weakening the dollar, and ultimately increasing silver pricing.
Most recently, Trump has renewed his commitment to reciprocal tariffs, and although revised lower than first planned, the White House remains committed to a new era of protectionism for US domestic industries.
This time, it would seem that Brazil is one of the worst-affected countries, and is now subject to a 50% tariff on all US-bound imports since August 1st, since a formal trade agreement between the two nations was not made.
While the eventual outcome of trade tariffs, for better or worse, is yet to be fully understood, any increase in market uncertainty surrounding US trade continues to boost silver pricing.
Silver (XAG/USD): Technical analysis (04/08/2025)
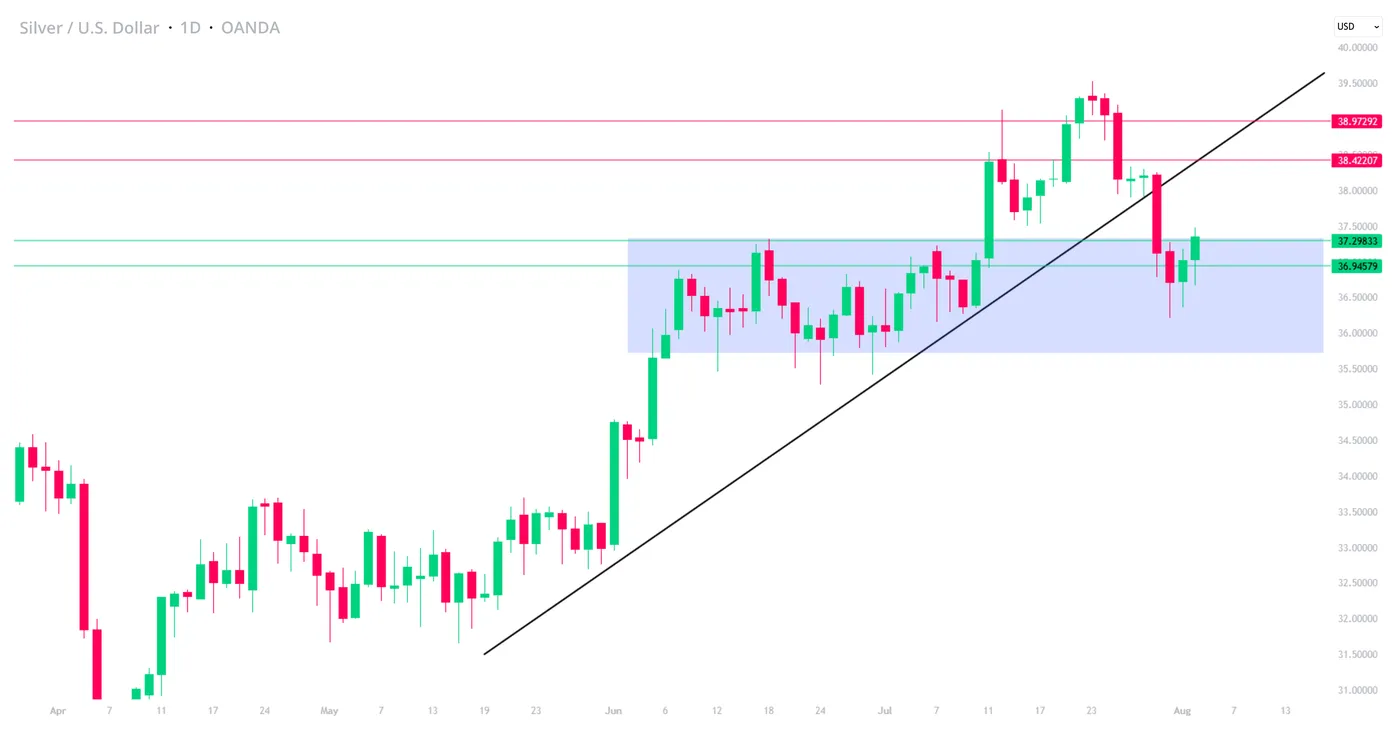
Silver (XAG/USD), OANDA, TradingView 04/08/2025
- On the daily timeframe, silver currently approaches an area of resistance at ~37.29833. If able to break and hold, this can also act as an area of support
- Having broke the upward trendline, silver will need to stablise before price is able to push higher
Crypto Bounce: Bitcoin and Ethereum Play Catch-up to Stock Market Highs
The session is risk-on as market participants already seem to be moving on from the consequent miss and downwards revisions to the NFP data – and this was just Friday.
Some questions remain on the current state of affairs as safe-havens have also appreciated on the session, but the rally is still way more consequent in risk-assets.
Cryptos haven't rejected the positive mood around markets as most digital assets are green today, and by a decent margin.
They were leading on the way down after starting to correct last Wednesday and most coins are now aiming to catch up to their recent highs.
Bitcoin wicked on its support zone at 112,000 and now trades around the $115,000 level – Sentiment will need to be watched closely to monitor potential bull traps, but for now the day is green.
Taking a look at the ongoing session for Cryptocurrencies
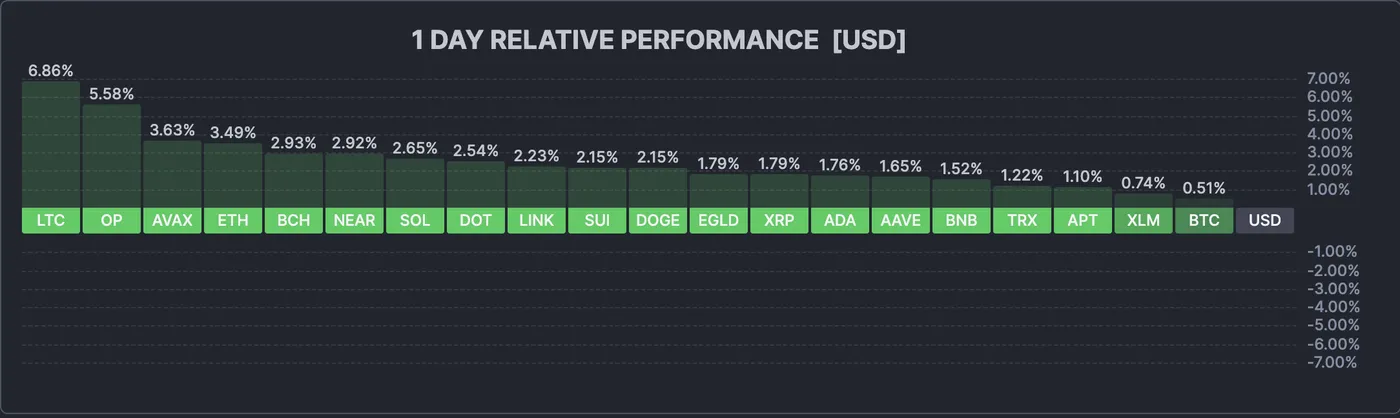
Current session in Cryptocurrencies, August 4, 2025 – Source: Finviz
The picture is very green for now, with cryptos up between 0.50% for BTC to 7% for Litecoin.
There has been some kind of small intraday top that has just formed though – let's take a look at Bitcoin and Ethereum to see if it has there is some more potential to the current move.
Bitcoin 4H Chart
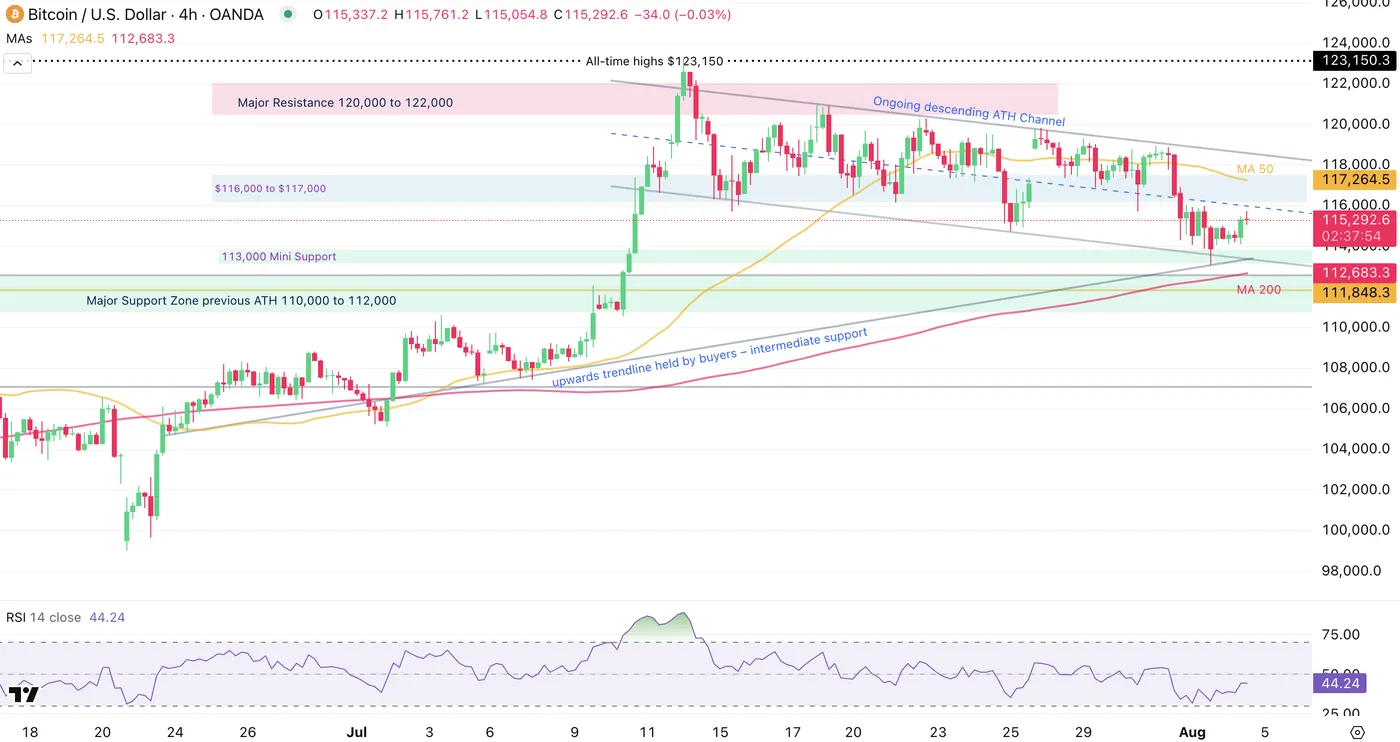
Bitcoin 4H Chart, August 4, 2025 – Source: TradingView
This weekend marked some touches to the $112,000 level serving as Main support which triggered some small buying.
Momentum is stalling a tid bit as the middle level of the downwards ATH descending channel is approaching.
Traders will need to be watch for the reactions at the current level:
Rejecting here shows a more bearish outlook (as prices would fail to breach the mid-line, a typical sign of buyer exhaustion) while consolidating here / breaking above would point to a test of the higher bounds of the channel around $118,500.
Levels to place on your charts:
Support Levels:
- lower bound of descending Channel $113,200
- Previous ATH Support $110,000 to $112,000
- $100,000 Major Support
Resistance Levels:
- $116,000 to 117,000 Pivot (confluence with 4H MA 50)
- $120,000 Resistance (+/- $300)
- Current ATH Resistance $121,000 to $123,000
Ethereum 4H Chart
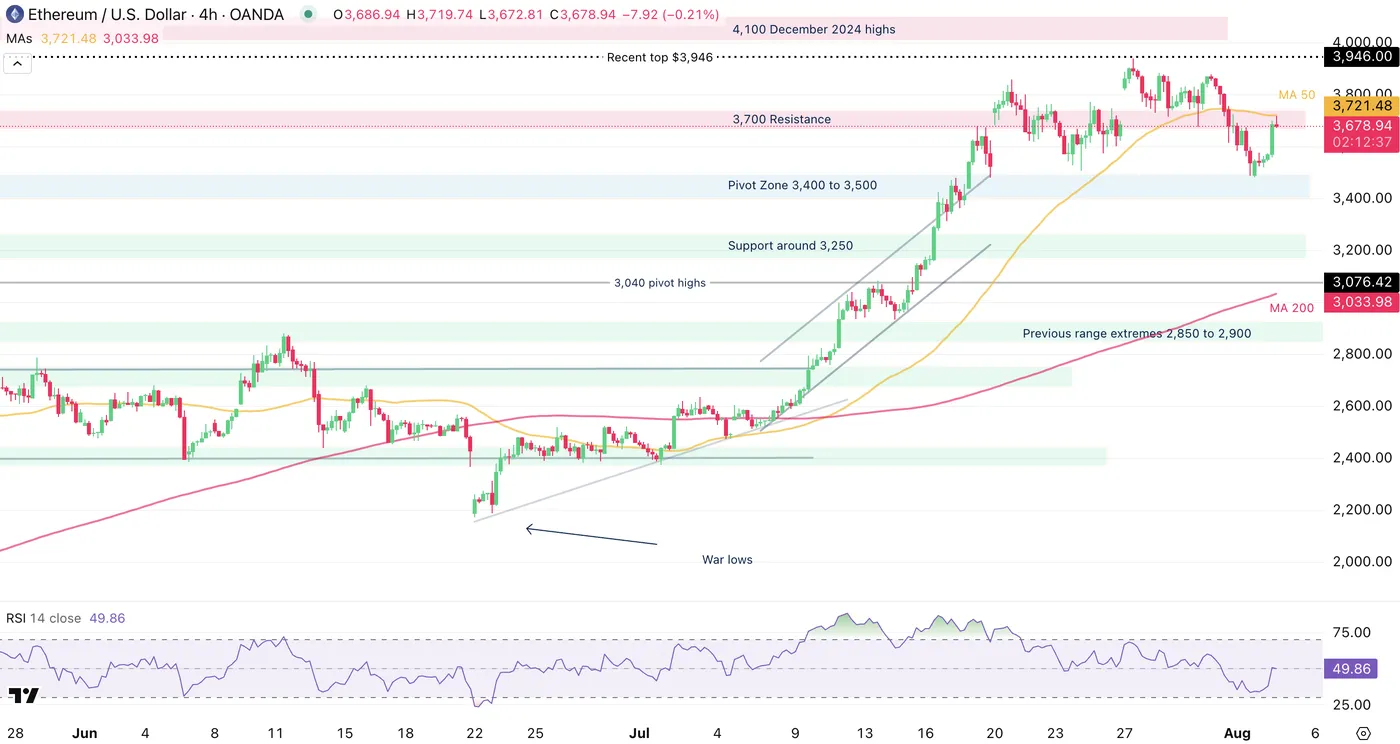
Ethereum 4H Chart, August 4, 2025 – Source: TradingView
Ethereum has rallied strongly in the session, up at one point 4.30%.
Some sellers seem to be appearing at the 4H MA 50 at a confluence with the $3,700 resistance zone.
RSI is back from bearish to neutral but the imminent action is essential as the momentum seems to be stalling around here – Failing to pass above the neutral line gives a more bearish tilt.
Levels to place on your charts:
Support Levels:
- Overnight lows $3,483
- Pivot Zone 3,400 to 3,500
- Support around 3,250
Resistance Levels:
Immediate resistance Between $3,700 to $3,750
- 4H MA 50 $3721
- $3,946 Intermediate highs
- $4,090 December 2024 highs
- $4,870 All-time highs
Safe Trades!
Ethereum Wave Analysis
Ethereum: ⬆️ Buy
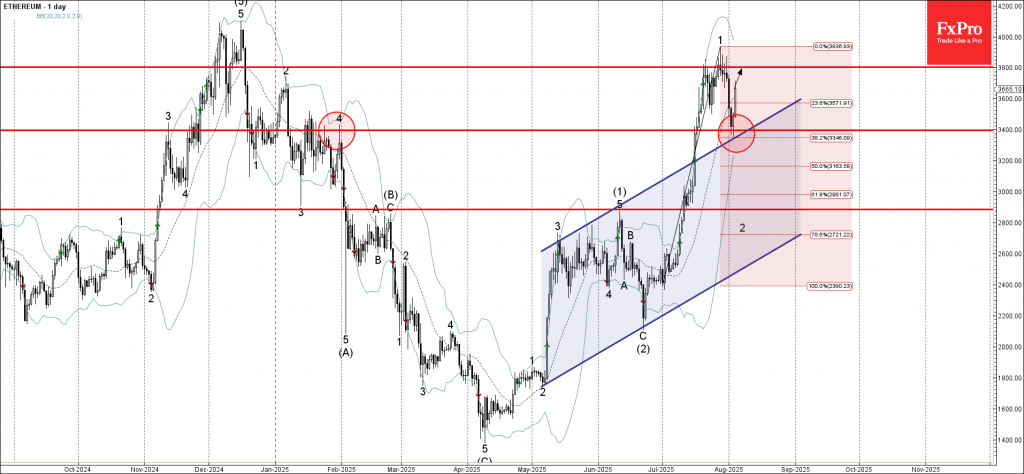
- Ethereum reversed from the key support level 3400.00
- Likely to rise to resistance level 3800.00
The Ethereum cryptocurrency recently reversed from the support zone between the key support level of 3400.00 (formerly a resistance level from January) and the upper trendline of the recently broken up channel from May.
This support zone was further strengthened by the 38.2% Fibonacci correction of the previous sharp upward impulse from July.
Given the clear daily uptrend, Ethereum cryptocurrency can be expected to rise to the next resistance level 3800.00.
GBPJPY Wave Analysis
GBPJPY: ⬇️ Sell
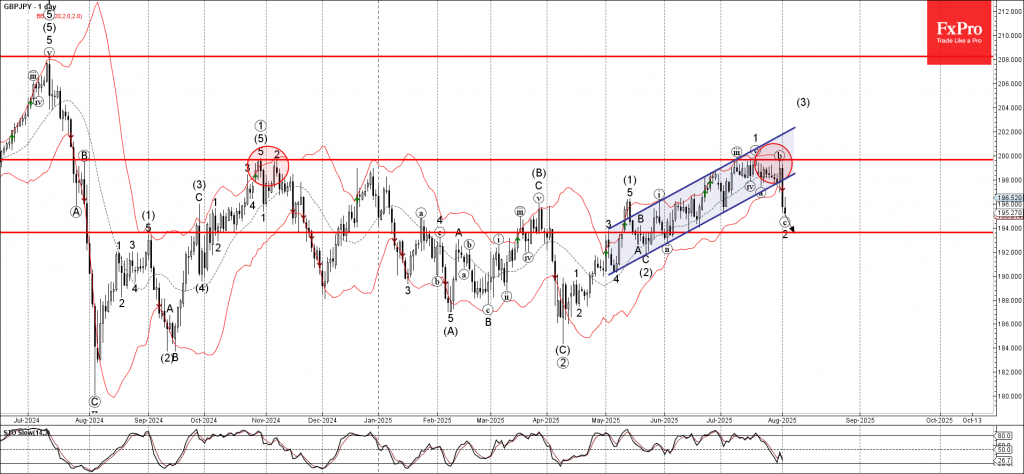
- GBPJPY reversed from the resistance zone
- Likely to fall to support level 194.00
GBPJPY currency pair recently reversed from the resistance zone between the round resistance level 200.00 (which has been reversing the price from October) and the upper daily Bollinger Band.
The downward reversal from this resistance zone created the daily Japanese candlesticks reversal pattern Bearish Engulfing, which started the active wave c.
Given the predominantly bearish sterling sentiment seen today, GBPJPY can be expected to fall to the next support level 194.00 (target for the completion of the active wave 2).
GBPCHF Wave Analysis
GBPCHF: ⬆️ Buy
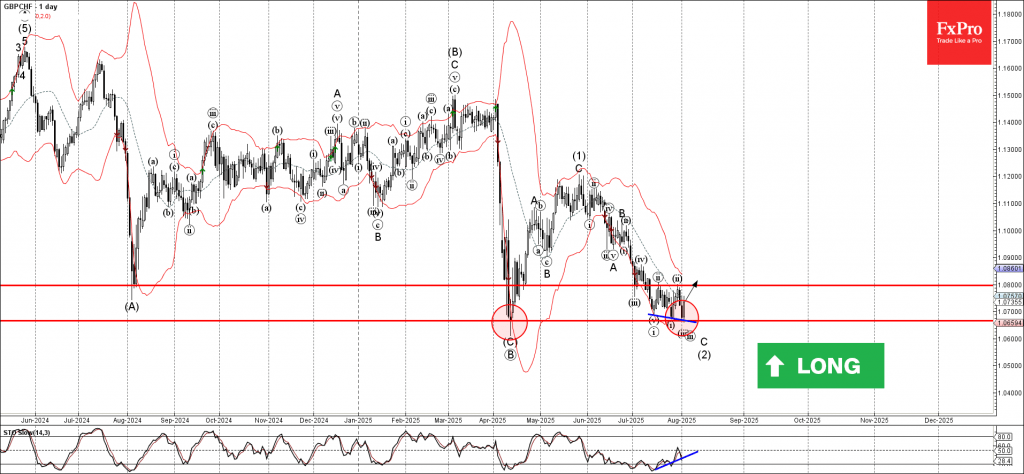
- GBPCHF reversed from key support level 1.0665
- Likely to rise to the resistance level 1.0800
GBPCHF currency pair recently reversed from the support zone between the pivotal support level 1.0665 (former strong support from April) and the lower daily Bollinger Band.
The upward reversal from this support zone will likely form the daily Japanese candlesticks reversal pattern Bullish Engulfing, if the pair closes today near the current levels.
Given the strength of the support level 1.0665 and the bullish divergence on the daily Stochastic, GBPCHF can be expected to rise to the next resistance level 1.0800 (which stopped earlier corrections (ii) and ii).
Silver Wave Analysis
Silver: ⬆️ Buy
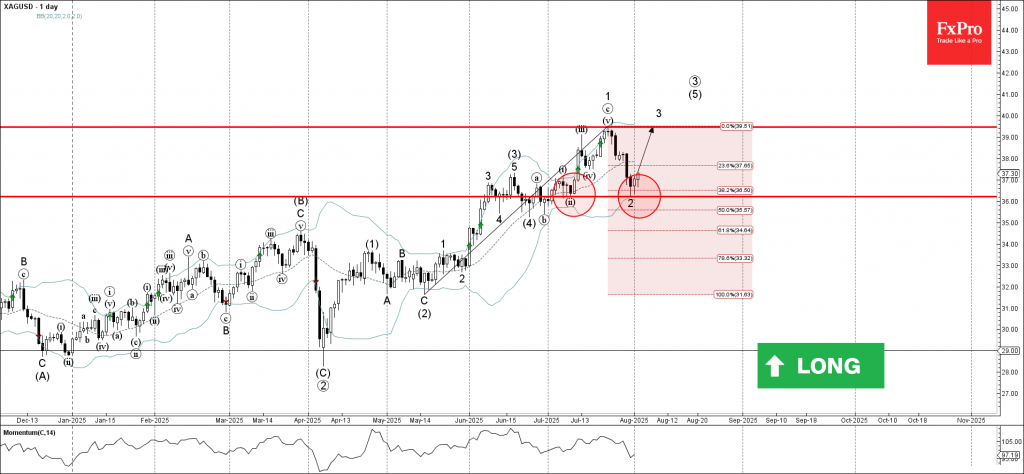
- Silver reversed from the support zone
- Likely to rise to the resistance level 39.45
Silver recently reversed from the support zone between the support level 36.20 (which also stopped wave ii at the start of July), lower daily Bollinger Band and the 38.2% Fibonacci correction of the upward impulse from May.
The upward reversal from this support zone created the daily Japanese candlesticks reversal pattern, Piercing Line – which marked the end of the earlier correction 2.
Given the clear daily uptrend, Silver can be expected to rise to the next resistance level at 39.45 (top of earlier impulse wave 1 from July).
WTI OIL Extends Steep Fall After OPEC+ Decision to Further Increase Output
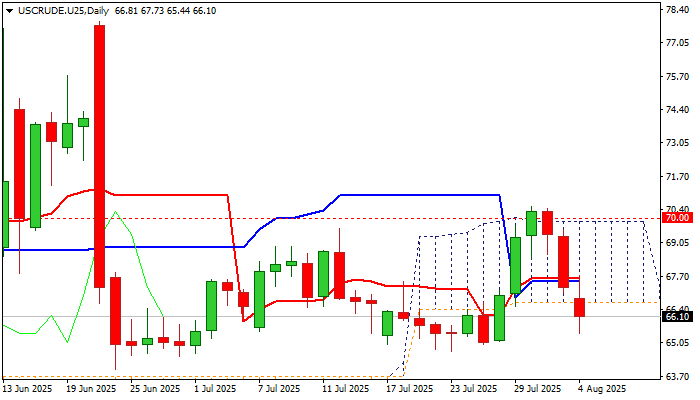
WTI oil extends steep fall into third consecutive day to almost fully retrace last week’s $64.99/$70.50 rally.
Oil came under pressure after repeated upside failure at $70 zone (psychological / daily Ichimoku cloud top), with latest decision of OPEC+ to further boost production by 547K bpd in September adding pressure and so far offsetting support from concerns about impact from US tariffs on export from a number of their trading partners and threats of a massive sanctions on Russia and countries that buy Russian crude oil.
Absence of expected reaction from largest Russian oil buyers (China and India) who signaled that they will not comply with Trump’s demands, left fresh bears fully in play for now and threatening of further weakness.
Today’s acceleration broke below thick daily cloud (spanning between $66.64 and $69.89) generated fresh bearish signal (to be confirmed on daily close below cloud base) and exposed key near-term supports at $65.00/64.70 100DMA / higher base, formed in the last week of July.
Weakened daily studies (break below the cloud and below 200/10/20 DMA’s / 14d momentum entered negative territory / south-heading RSI slid below neutrality zone) support scenario, with daily cloud base ($66.64) to ideally cap upticks and guard converged daily Kijun /Tenkan-sen ($67.49/$67.61) respectively, violation of which would sideline bears.
Res: 66.64; 67.12; 67.61; 67.92
Sup: 65.44; 65.00; 64.70; 63.99