Sample Category Title
Eco Data 7/31/19
[php_everywhere instance="1"]
Was the Fed’s Rate Hike in December a “Policy Mistake”?
Executive Summary
Some analysts now criticize the Fed’s December 2018 rate hike as a “policy mistake”.1 In our previous three reports, we developed a framework to analyze the Federal Open Market Committee (FOMC) and private sector forecast behavior.2 In this report, we use the same framework to analyze whether the committee’s December 2018 monetary policy rate decision was overly restrictive and inconsistent with its forecasts. The Fed previously stated it would take a “data dependent” approach to setting policy, or rely on incoming data to reveal where the economy is at the time of each FOMC meeting relative to its goals. With this in mind, we evaluate the economic projections compared to the FOMC’s federal funds rate forecast projections released at the year-end FOMC meeting. We also introduce an alternative method, in which we examine the gap between the federal funds rate forecasts and the Fed’s economic data projections. Our analysis suggests that the FOMC’s December 2018 rate hike seems to have been overly restrictive and inconsistent with its economic forecast.
A Theoretical Framework to Evaluate the Cost of Forecast Error
In the previous three reports, we used a theoretical framework to evaluate the FOMC’s forecasts and answer the question of over-optimism, and used the same framework to evaluate the private sector (Blue Chip consensus). In practice, forecasts do not always hit their targets, meaning there may be room for error. The total cost of forecast errors can be divided into an under-forecast, where the forecast is lower than the actual value, and an over-forecast, where the forecast is higher than the actual value. This leads us to the question of whether the cost of under-forecasting is identical to the cost of over-forecasting, known as a symmetric loss function. In this case, the forecaster is indifferent between under- and over-forecasting. Conversely, an asymmetric loss function has the potential to dictate a preference for forecast errors. If the forecaster knows that under-forecasting could cause more damage than over-forecasting, they may tend to over-forecast. We have previously suggested that the loss function was asymmetric.
We use the same method to evaluate whether the Fed’s monetary policy stance was overly restrictive (or accommodative) and inconsistent (or consistent) with its near-term economic forecasts. In theory, if the FOMC forecasts GDP growth and inflation to rise, a tight monetary policy stance should be implemented.
Was the FOMC’s Policy Overly Restrictive?
Some analysts now criticize the Fed’s December 2018 rate hike as a “policy mistake”. 3 Notably, James Bullard, president of the St. Louis Federal Reserve Bank, was the first Fed official to suggest the central bank made a mistake with the December rate hike. He suggested that the rate increase pushed monetary policy into a restrictive setting and put downward pressure on inflation.
Forecast Analysis
In our past work we used FOMC forecast data dating back to 1992, however, in this report we focus on the post-Great Recession era. We examine historical GDP growth, inflation and unemployment rate forecast data compared to the federal funds target rate forecast from the FOMC’s Greenbook/Summary of Economic Projections (SEP) as well as the actual rate.4
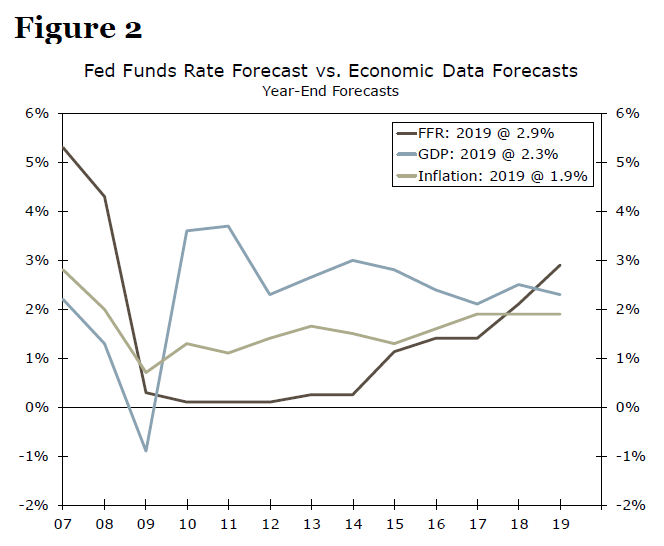
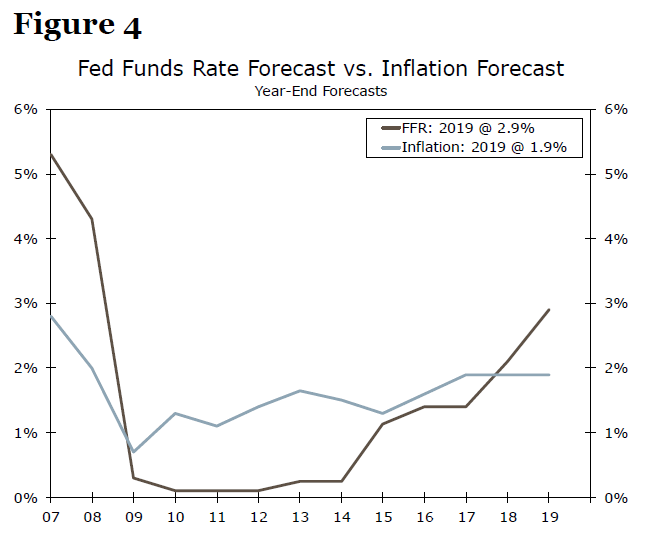
We use forecast data since 2006, but we start our analysis in 2009 to analyze if the committee’s monetary policy forecast was consistent with its growth forecasts, assuming external factors, such as trade tensions, are embedded within the forecast. In 2010 and 2011 GDP was forecast to climb 3.6% and 3.7%, respectively, while the fed funds rate was forecast to remain unchanged (median forecast of 0.1%) (Figure 3). The Fed may have followed an accommodative policy, rather than the expected restrictive policy during this period due to painfully slow growth lingering from the Great Recession, low inflation and an expected pick-up in the unemployment rate (Figure 4). The FOMC also introduced several rounds of quantitative easing (QE) during this period to jump start the recovery. In 2012, we find that GDP growth was expected to slow to 2.3% while the policy rate was held steady. The central bank’s decision to hold rates steady in an environment with decelerating growth likely stemmed from lingering uncertainty regarding the depth of the Great Recession.
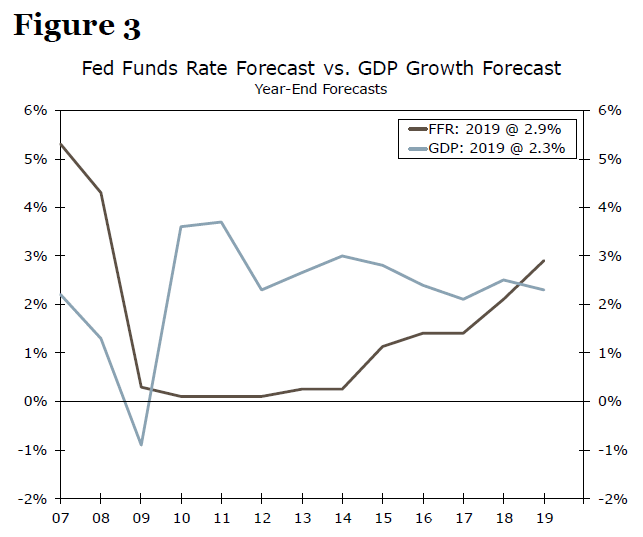
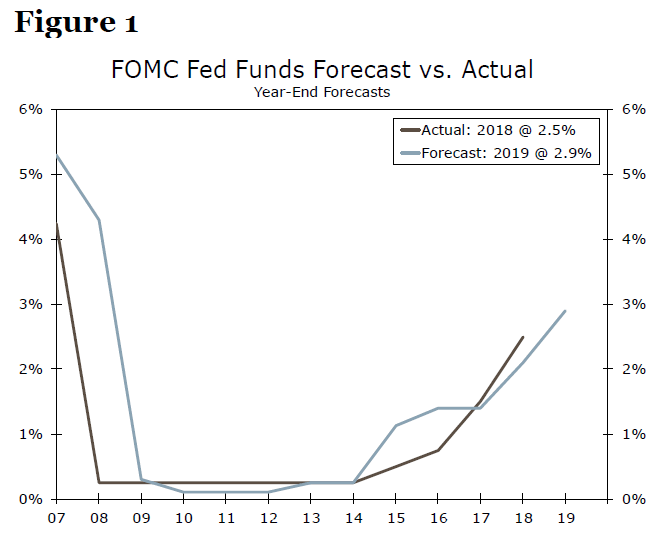
In 2015-2017 GDP growth was expected to remain between 2-2.5%, while the fed funds rate was forecasted to rise 1.25 percentage points. The FOMC’s rate decision may have been influenced by rising inflation expectations, an above-average trend in the GDP growth forecast and/or a declining trend in the unemployment rate. Overall, the Fed’s monetary policy stance in 2009 through 2017 seems consistent with the FOMC’s economic projections.
The SEP released in December 2017 forecast GDP to rise 2.5% in 2018 after rising 2.1% in 2017, inflation to remain flat at 1.9% and the fed funds rate to rise to 2.1% (median estimate) from 1.4%. The Fed’s restrictive monetary policy in 2018 may have been justified by the relatively stronger growth forecasts. Meanwhile, the SEP released in December 2018 forecast softer GDP growth and steady inflation, at 1.9%, but estimated the fed funds rate would rise to 2.9% from 2.1%. In theory, the rising fed funds forecast is inconsistent with muted inflation, which never hit the Fed’s 2% target, and lower GDP growth forecasts. Therefore, our analysis suggests that the December 2018 rate hike may have been overly restrictive and inconsistent given the FOMC’s economic and fed funds rate projections for 2019.
Gap Method to Analyze Inconsistent and Overly Restrictive Behavior
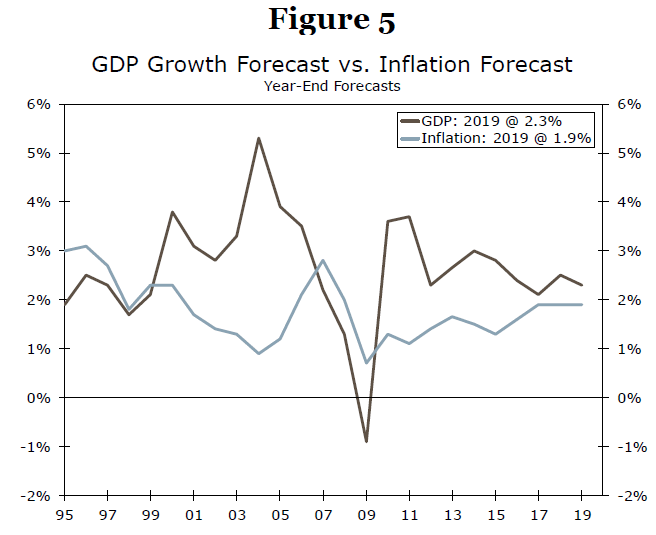
Next we introduce an alternative method, in which we examine the gap between the fed funds rate forecasts and the Fed’s economic projections. In order to help us characterize the FOMC’s forecast behavior. A wider gap between GDP growth/inflation and the fed funds forecasts is typically associated with accommodative policy, while a narrow gap suggests policy normalization. The gap’s magnitude represents the potential change in monetary policy. Shown in Figure 3 and Figure 4, the gap widened from 2009-2015. During this period the federal funds rate bottomed, reaching the nominal lower bound (0.00%). Rather than adjusting the fed funds rate, the Fed introduced QE in an effort to stimulate the economy. Thus we assume a widening gap correlates with monetary easing, while the narrowing gap in 2015-2018 represents policy normalization. In 2018, the gap turns negative for the first time in the post-Great Recession era, as the fed funds rate was forecast a higher rate than GDP and inflation growth. With GDP growth trending downward and inflation flat, below the Fed’s 2% target, the negative gap suggests forecast inconsistency.
Recently, the Fed has given a strong signal of a potential rate cut, which may widen the gap again. Historically, we see changes in the Fed’s behavior (i.e. over-optimism) when the gap widens. This means that when the gap widens, the Fed tends to be overly optimistic, while the narrowing of the gap encourages the Fed to introduce stimulus measures and be less optimistic. Even though we do not have a fed funds forecast readily available from 2002-2004, the Fed’s decision to cut rates during the period was consistent with its forecast for inflation to trend lower and for GDP growth to trend higher (Figure 5). In 2010-2012, the gap between the fed funds rate forecast and GDP growth and inflation widened significantly. During this period the FOMC was overly optimistic. We also see a similar trend in 2017 and 2018 when the gap began to narrow, as the Fed changed its behavior and began to be less optimistic.
FOMC’s “Patient” Pivot
In late 2018, the FOMC suggested that the economy was moving more consistently with the Fed’s dual mandate objectives, decreasing downside risk. Thus the FOMC’s decision to adopt a “patient” stance in early 2019 did not come as a surprise to most market participants. In light of headline and core inflation slipping in the first quarter, the FOMC’s pivot to a “patient” stance was justified. In our view, the Fed’s decision to hike rates in December 2018 was inconsistent and seems to have been overly restrictive given the SEP for 2019 suggested a gradual slowdown in growth.
APPENDIX
Our analysis uses historical data from the Fed’s Greenbook and the FOMC’s Summary of Economic Projections (SEP). As the FOMC did not begin publishing the SEP until 2012, we use the forecasts complied by the Fed in the Greenbook and given to the FOMC ahead of each meeting as a proxy for the FOMC’s forecasts from 1992-2012. Our three variables of interest are GDP growth, inflation and the unemployment rate.
For each variable, we take the one-year ahead forecast published in the December Greenbook/SEP of the prior year. For example, we use the December 1991 Greenbook to get the full-year 1992 forecast. For GDP growth, both the Greenbook and the SEP calculate the annual growth rate as the change from the fourth quarter of the prior year to the fourth quarter of the given year.
While we only have limited readily available fed funds rate forecasts, we use the Greenbook forecasts as a proxy for the FOMC’s forecasts from 2006-2012. Once the FOMC began publishing the SEP in 2012, we use the median year-ahead forecast from the December “Dot Plot,” which displays the fed funds rate projections of FOMC members.
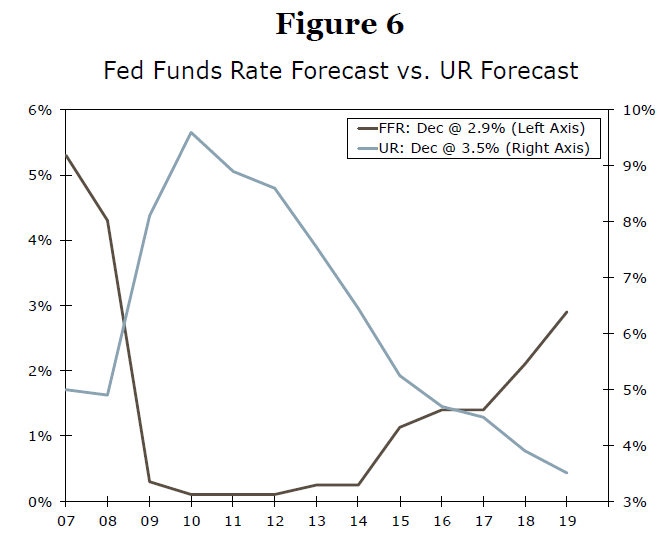
Although in our report we mainly highlighted our evaluation of the relationship between the fed funds rate forecast and the GDP growth and inflation forecasts, we acknowledge the unemployment rate forecasts are also consistent with our overall conclusion. Shown in Figure 6, the gap between the fed funds rate and the unemployment rate also widened in the past year.
1 Saphir, Ann. “Fed at ‘end of road’ on rate hikes, Bullard says”. January 10, 2019.
2 Please see “Is the FOMC Overly-Optimistic?” Published on July 31, 2018, “Is the FOMC or the Private Sector More Optimistic?” Published on August 28, 2018, “Is the FOMC or the Private Sector More Consistent?” Published on October 17, 2018.
3 Please see footnote 1 for more details.
4 For more detail about the data used in our analysis, please see the appendix of this report. We analyze if the Fed’s monetary policy forecast was consistent with its growth forecasts.
US consumer confidence rose to 135.7, highest this year
Conference Board US Consumer Confidence Index rose to 135.7 in July, up from 124.3, and beat expectation of 125.0. Present Situation Index rose from 164.3 to 170.9. Expectations Index Rose from 97.6 to 112.2.
Conference Board said: “After a sharp decline in June, driven by an escalation in trade and tariff tensions, Consumer Confidence rebounded in July to its highest level this year,”
“Consumers are once again optimistic about current and prospective business and labor market conditions. In addition, their expectations regarding their financial outlook also improved. These high levels of confidence should continue to support robust spending in the near-term despite slower growth in GDP.”
NZDUSD Retains Short Term Weakness
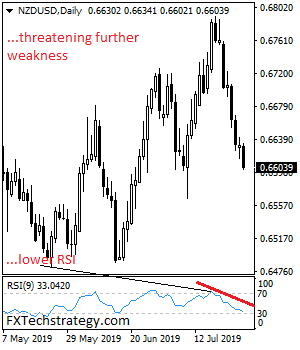
NZDUSD retains short term weakness as it declined further during Tuesday trading session. Resistance comes in at the 0.6650 level where a break will turn attention to the 0.6700 level. A break of here will have to happen to create scope for a move higher towards the 0.6750 level. Further out, resistance resides at the 0.6800 level. Support stands at the 0.6550 level. Further down, the 0.6500 level comes in as the next downside target and then the 0.6450 level. Its daily RSI is bearish and pointing lower suggesting further weakness. All in all, NZDUSD faces more downside pressure short term
BoE Meets; Spotlight on Forecasts as Risk of No-Deal Brexit Jumps
The Bank of England will announce its latest policy decision on Thursday at 11:00 GMT and will also publish its quarterly inflation report, followed by a press conference with Governor Mark Carney at 11:30 GMT. Markets are anticipating the Bank to strike a more dovish tone but whether this will involve signalling a rate cut is far from clear. What is certain, however, is that the meeting is unlikely to halt sterling’s slide, which is under pressure from the growing risk of a disorderly Brexit.
BoE unlikely to follow Fed and ECB in cutting rates
With the US Federal Reserve poised to cut rates this week and the European Central Bank widely expected to follow suit in September, the Bank of England remains one of the few major central banks that has not signalled some form of policy easing. The BoE has so far stood by its prediction that interest rates will need to rise by a limited and gradual extent over the next 2-3 years if there is a smooth UK exit from the European Union.
But as a no-deal Brexit increasingly becomes a realistic prospect under a Boris Johnson government and the outlook for the world economy darkens, BoE policymakers have only talked of the growing downside risks without committing to any policy response measures. This means the most likely outcome is for the BoE to adopt a more neutral stance on Thursday as it leaves the Bank Rate unchanged at 0.75%.
No change in policy expected; forecasts in focus
With the Brexit deadline just three months away, investors are in one mind that all the Bank can do until then is stay on hold as Prime Minister Johnson plays hardball with the EU. The Monetary Policy Committee’s (MPC) biggest challenge will instead be on its communication as it attempts to provide credible forecasts using a baseline scenario that Britain will leave the EU with a deal on October 31.
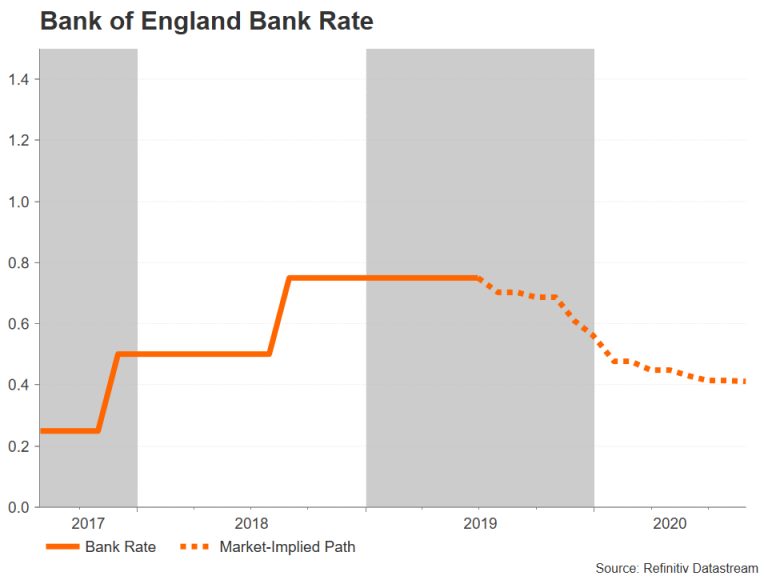
Those forecasts are due to be updated on Thursday in the August Inflation Report and Carney has hinted at possible changes to how the projections will be calculated. As markets are increasingly pricing a higher chance of a no-deal Brexit, the market-implied path of the Bank Rate, which the BoE uses in its own prediction, has shifted to point to a full 25 basis points cut by March 2020.
If the MPC was to stick with its assumption of a smooth Brexit, then by its own calculations, it would overshoot its 2% inflation target if rates were cut over the next year. So policymakers need to come up with a way to incorporate the Brexit risk into their projections without changing the assumption of an orderly Brexit.
BoE policy may have little impact on pound
But while the Bank’s credibility is at stake at how the Institution manages its communication and forecasting in the lead up to the Brexit deadline, the impact on the markets might be more minimal given that economic data and monetary policy have become secondary to politics since the 2016 referendum.
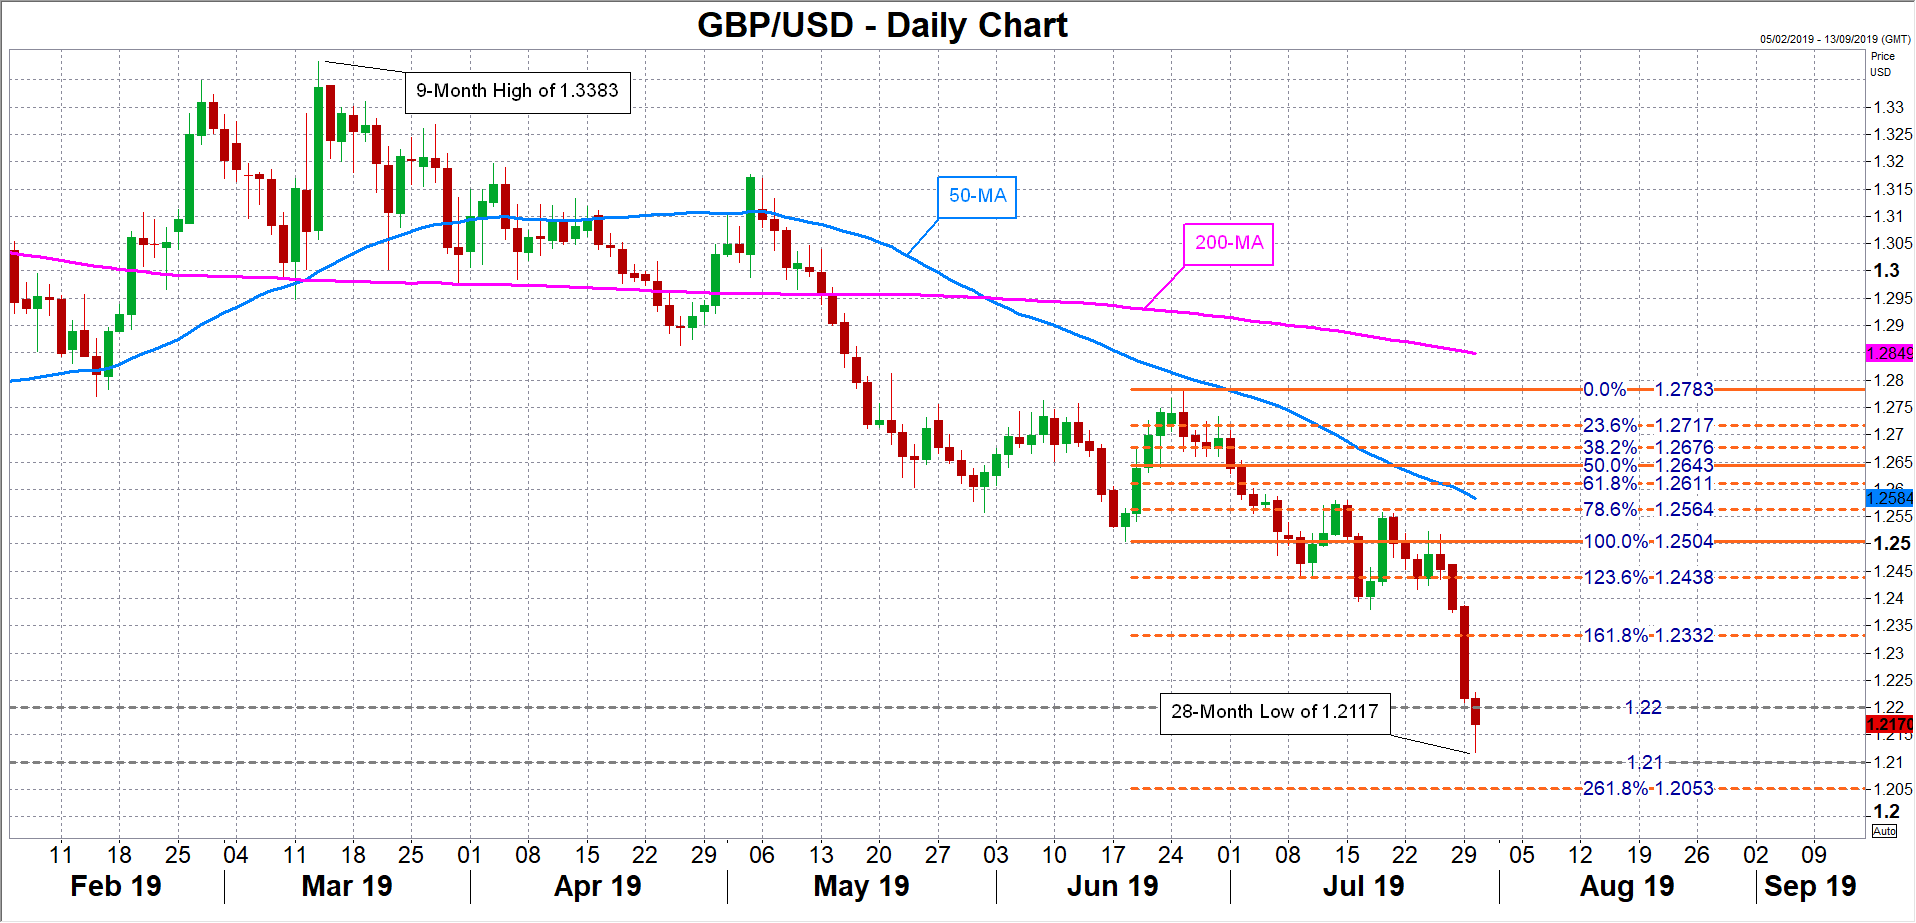
The pound has been plunging this week, crashing below the $1.22 level for the first time since 2017. If the Bank surprises and takes a much grimmer view of the British economy than investors are anticipating, the $1.21 mark could become an easy target for the bears. Sharper losses are likely if the MPC goes one step further and flags a possible rate cut. This could open the way for the 261.8% Fibonacci extension of the June upleg at $1.2053.
On the other hand, if the Bank sticks to its existing forecasts that some tightening will be needed over the coming period, the pound could find some support from its recent declines and stabilise near the $1.22 handle.
Outlook clouded by new Johnson government
One factor that could prevent the MPC from adopting a more dovish view is the new spending plans by Johnson. The new PM has pledged millions on transport, policing and farming, which has fuelled speculation of a snap election. If a general election is called in the coming weeks, this would further complicate the decision making for the BoE by adding to the cloud of uncertainty over the UK’s economic outlook.
Fed Rate Decision: One Cut at a Time
The Federal Reserve is virtually certain to cut rates on Wednesday at 18:00 GMT – the question is how deep it will slash. A 50 basis points (bp) cut seems excessive given recent Fed commentary, so a 25bp move is probably on the cards instead. Since markets still price in a ~20% chance for a 50bp cut, the immediate reaction in the dollar may be higher. Whether any surge is sustained though, will depend on the signals that policymakers send about the pace and depth of future cuts.
It will be a huge week for the US dollar, as besides the Fed rate decision on Wednesday, the latest nonfarm payrolls report will also be released on Friday. On the monetary front, a rate cut is certain according to market pricing, so the real question revolves around the size of this cut – will it be 25 or 50bp?
Bearing in mind some recent comments from Fed officials, a 25bp move seems far more likely. First and foremost, even the most dovish policymaker – James Bullard – said he would like to cut only by 25bps at the upcoming meeting. Bullard voted to cut rates last month and was firmly opposed to raising rates last year, so if he isn’t on board with a 50bp move, who is?
At the time of writing, a 25bp cut is fully priced in, and markets also factor in an almost 20% probability for a 50bp move. This means that more easing is priced in than the Fed is likely to deliver on Wednesday, so the knee-jerk reaction in the dollar may be higher on the decision.
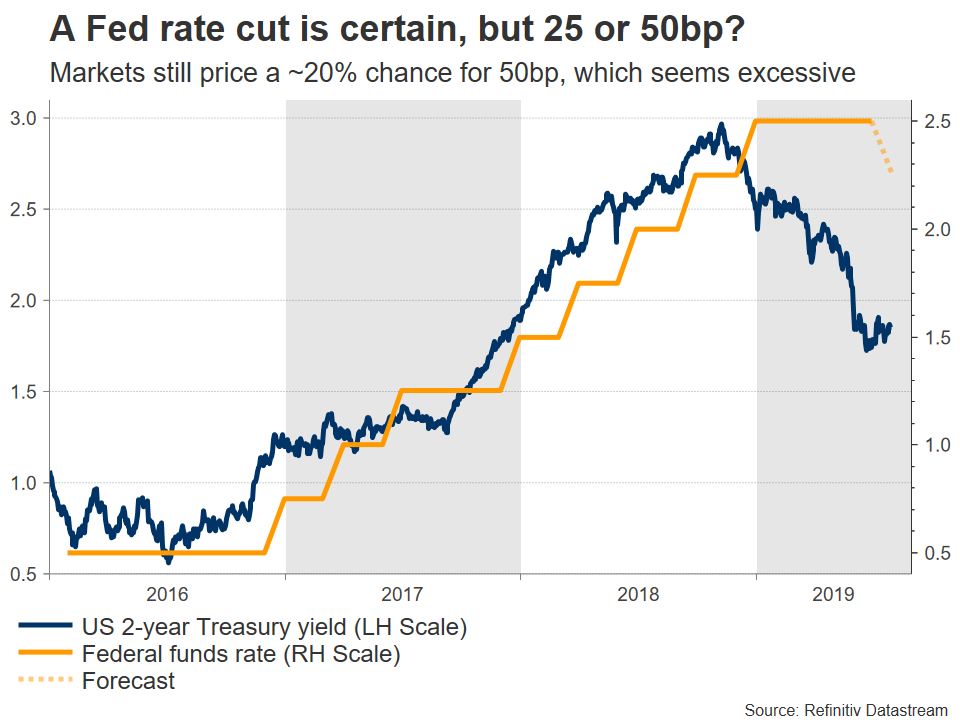
Whether any surge is sustained though, will depend on the signals about the pace and scope of future rate cuts that Chairman Powell sends in the press conference. Is this a one-off ‘insurance’ cut, or the beginning of a prolonged easing cycle? Markets are pricing in a total of four rate cuts – or roughly 100bp of rate reductions – by this time next year.
On balance, Powell is more likely to emphasize that more cuts may be needed soon – vindicating the market’s dovish expectations and therefore sending the dollar back down. He has repeatedly indicated that “an ounce of prevention is better than a pound of cure” and that his Fed will “act as appropriate to sustain the expansion”. These imply that they don’t intend to ‘fall behind the curve’ by delivering less easing than markets expect overall, especially with the risk of a recession looming.
In the big picture, the outlook for the dollar still seems negative. The major central banks are entering an easing cycle, and the Fed has the most scope and ‘firepower’ with which to ease. Hence, the dollar’s downside may be far greater than the euro’s for example as the ECB has much less room to cut, given its already-negative rates. This argues for a higher euro/dollar over time – though a lot will also depend on how aggressive the ECB’s upcoming stimulus package is.
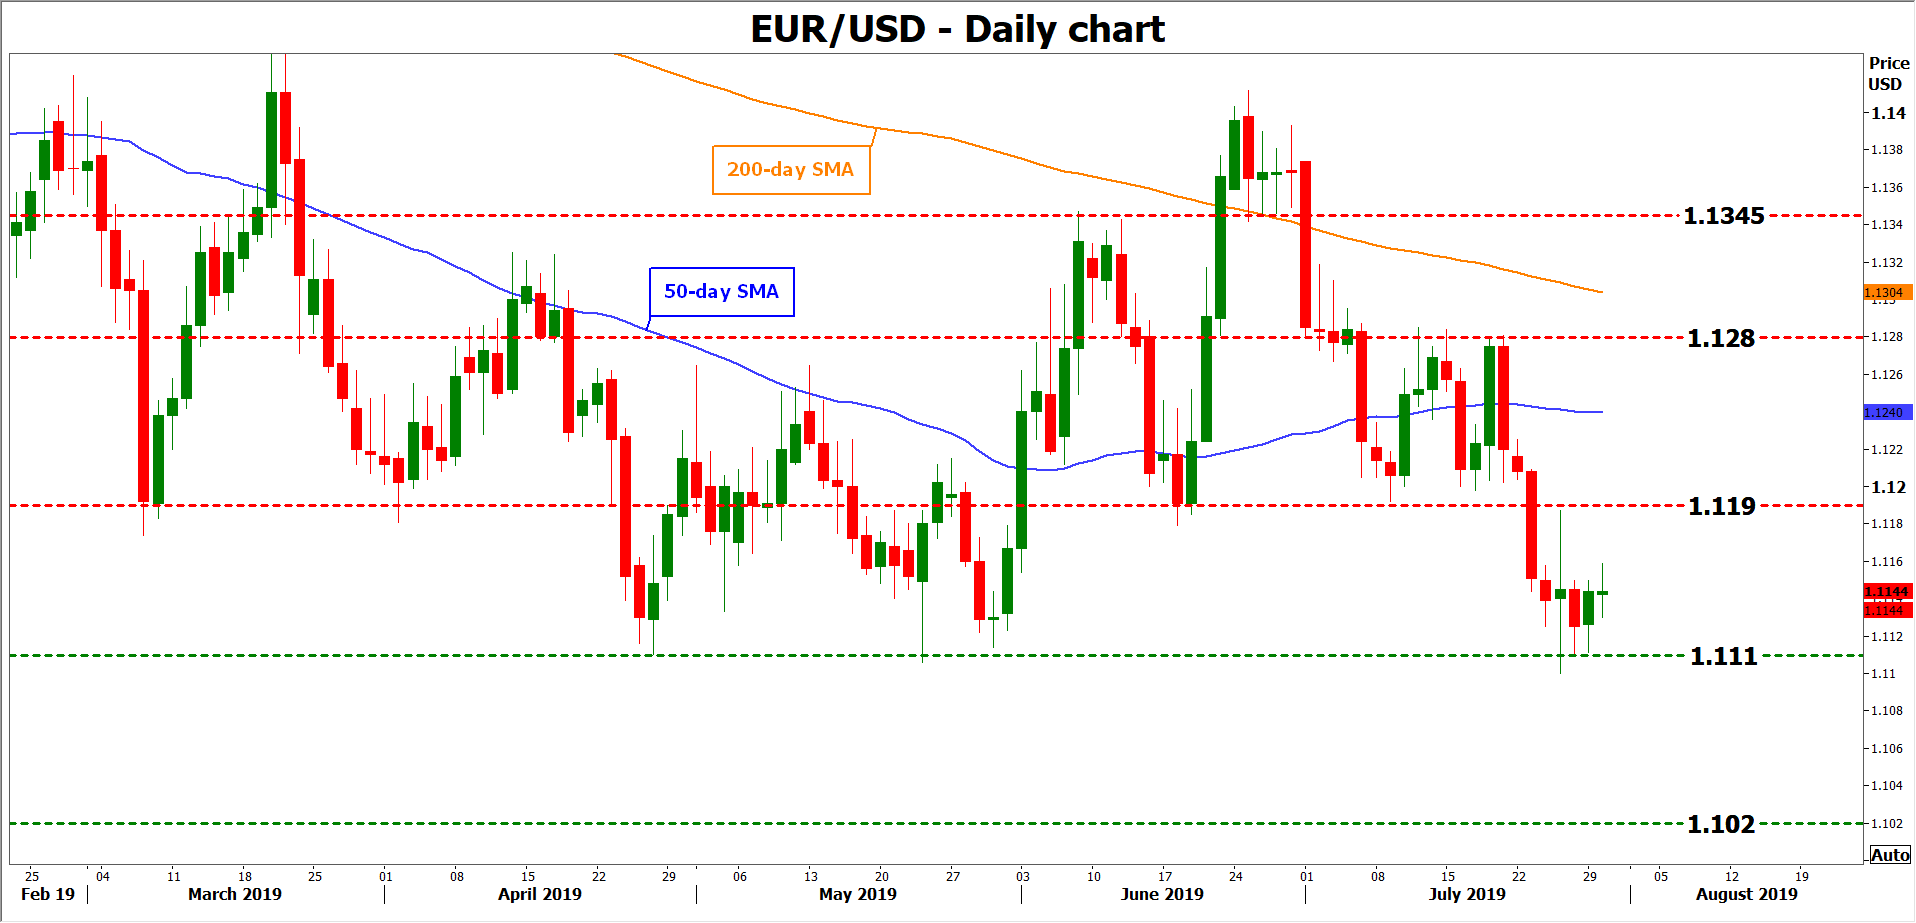
Taking a technical look at euro/dollar, immediate support to declines may be found near 1.1110, with a downside break opening the door for a test of the 1.1020 zone.
On the flipside, a rebound may stall initially near the 1.1190 area, marked by the inside swing low on July 9. A bullish violation would turn the focus to 1.1280.
ECB Monetary Easing Warranted, Flash GDP Growth and Inflation Eyed Next
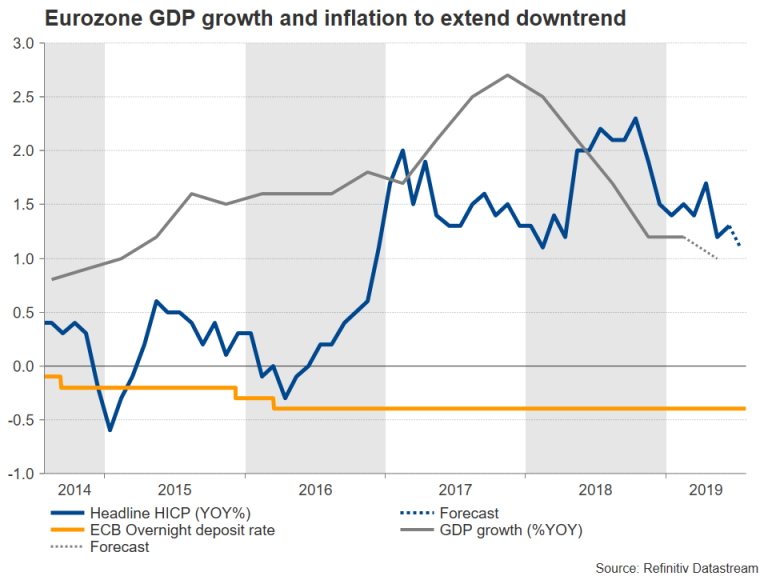
The Flash Harmonized Consumer Price Index (HCPI) and initial GDP growth estimates will be on the watchlist early on Wednesday. Following a dovish policy meeting by the European Central Bank last week, the data could assure markets that further monetary easing is the right choice for the months coming ahead. What markets don’t know yet though is the size and the duration of the upcoming stimulus package, with investors and hence the euro eagerly waiting this week’s data to give some direction.
GDP growth and inflation slowdown to continue
Recent business PMI surveys out of the EU and the powerhouse Germany arrived weaker and so the EU flash inflation and GDP growth readings are forecast to do the same on Wednesday at 0900 GMT.
Both the headline and the core HCPI measures are expected to slip to 1.1% year-on-year (y/y) from 1.3% in June according to Refinitiv estimates despite a robust labor market. Separately, the preliminary GDP report for the second quarter is likely to be even discouraging, with forecasts suggesting a softer growth of 0.2% q/q compared to 0.4% in the previous quarter, which could result in an annual expansion of 1.0% versus 1.2% previously.
New stimulus package might not be easy decision
Compared to its previous policy meetings, the ECB added the word “lower” to its forward guidance on interest rates last week, admitting that a cut in the deposit rate is very likely in the coming months. Policymakers also messaged that this might not be the only option to stimulate the eurozone economy but other measures “such as the design of a tiered system for reserve remuneration” which would reduce the charge for some banks to store their reserves in the central bank, as well as, a second round of quantitative easing might accompany the reduction in borrowing costs.
Following Draghi’s press conference speech, markets turned almost certain that a 0.10bps rate cut could be delivered as soon as in September when the central bank updates its economic projections and starts a new series of quarterly targeted longer-term refinancing operations (TLTRO-III).
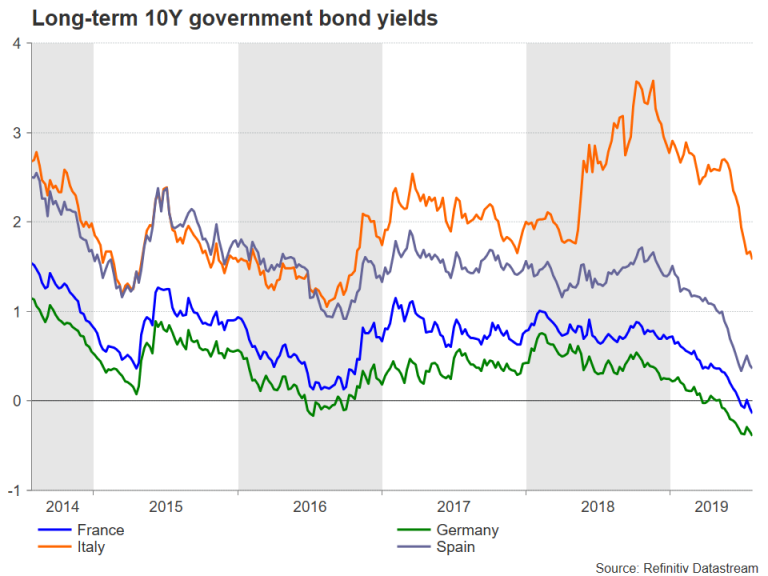
Yet, analysts are still in the dark concerning “the size and the composition” of a potential new asset purchase program. For example, the ECB could find it hard to purchase government bonds from Germany where the government is running an excessive budget surplus. Note that a government issues new bonds when total spending exceeds the revenue it collects through taxation. Worth of mention is also the fact that the ECB has set out its bond purchases in proportion to the amount each country has paid into the central bank, meaning that larger economies get the most. Besides, questions are also arising about how willing the ECB is to buy bonds from Germany and France where the 10-year yields are currently negative.
Technical analysis
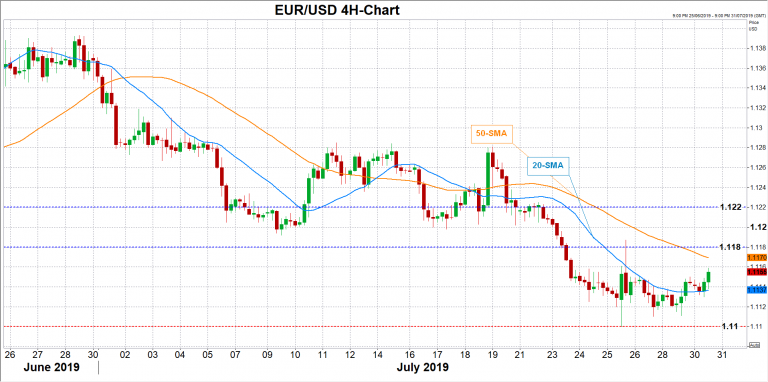
All in all, Draghi could inject a bigger amount of liquidity through its monetary policy and for a longer period if economic terms in the eurozone deteriorate along with Brexit and trade developments. On Wednesday, flash GDP growth and inflation figures could provide insight on the bloc’s performance, and hence evidence on how big the stimulus wave could be, adding more volatility to the euro. A worse-than-expected outcome may likely push EURUSD under the 1.1100 strong support area and towards the 1.1000 psychological mark.
Alternatively, in the event of a positive surprise, EURUSD could look for resistance within the 1.1180-1.1220 area.
Keep in mind that the Federal Open Market Committee is highly anticipated to slash its funds rate on Thursday and any change in the language could shake the euro as well.
USDTRY Revisits the 200-day SMA after Three-Week Gradual Move Lower
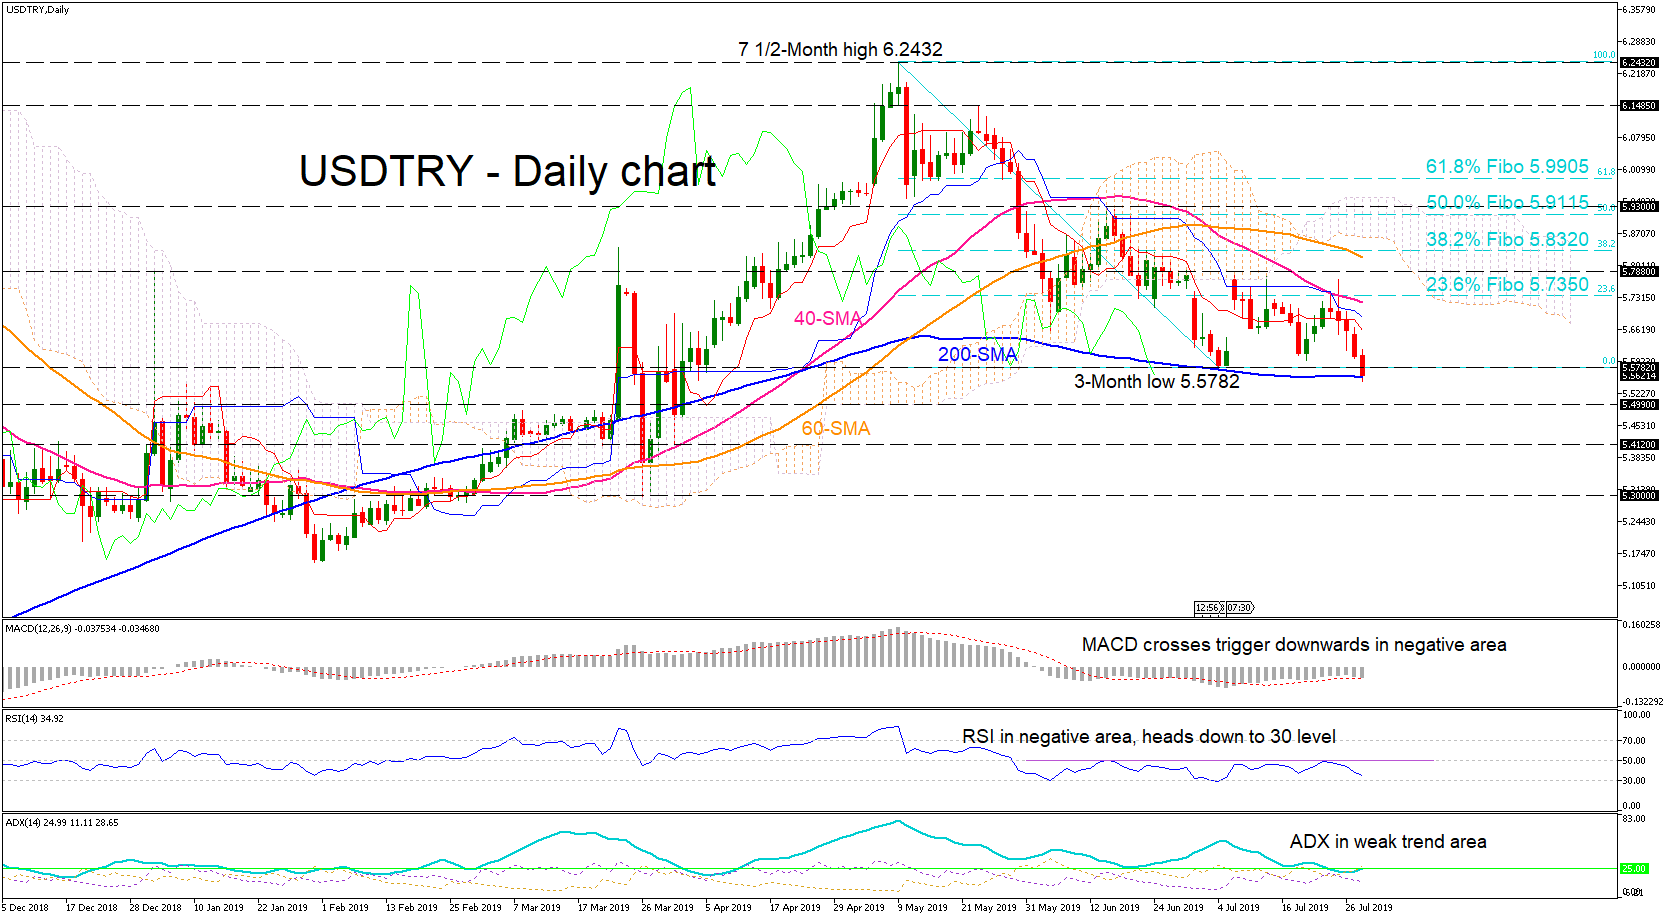
The USDTRY recorded multiple red days after a move off the 5.7350 resistance, which was the 23.6% Fibonacci retracement of the down leg from a seven-and-a-half-month high of 6.2432 to a low of 5.5782. The selling interest brought the price to sit on the 200-day simple moving average (SMA) slightly past the three-month low of 5.5782 formed on July 4.
The Tenkan-sen and Kinjun-sen are pointing down, agreeing with the negative directional momentum suggested from the MACD and the RSI, as the MACD has crossed its trigger down, and the RSI creeps towards the oversold area. The ADX is currently showing a short-term weak trend.
A continued selling interest may push the pair past the 200-day SMA to meet a support area of 5.5000 – 5.4990, before opening a test of the low of 5.4120 from April 1. A fiercer sell-off could bring attention to the 5.3000 hurdle support from March 27.
If the 200-day SMA holds, an upside move could initially see resistance come from the averages of the Ichimoku indicator around 5.6600 – 5.6900 before the 40-SMA near 5.7350, which is the 23.6% Fibo. If buyers insist, next resistance could occur at 5.7880, while slightly higher a barrier of 5.8320, which is the 38.2% Fibo, coupled with the 60-day SMA could seem to be a tougher opponent.
Overall, the short-term looks to be bearish for now, and a breach below the 200-SMA would confirm that perspective.
EURGBP Hit New 23-Month High on Rising Fears of Disorderly Brexit
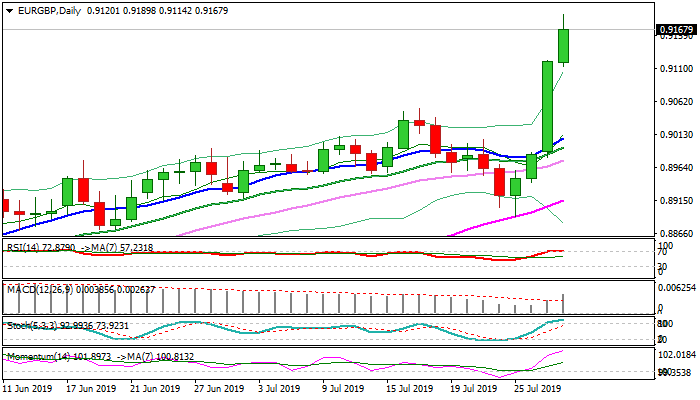
The cross rose to new multi-month high at 0.9189 on Tuesday, in extension of Monday’s strong bullish acceleration (the pair was up nearly 1.5% for the day on the biggest daily advance since 15 Nov 2018) fueled by rising fears of disorderly Brexit and all negative impact that will be caused.
Additional pressure on collapsing pound came from today’s comments of new PM Boris Johnson, who promised to lead Britain out of the EU on 31 Oct no matter what.
Strong rally in past two days broke above the last obstacles at 0.91 zone that opened way towards key med-term barrier at 0.9306 (29 Aug 2017 high).
Overbought conditions may delay bears, but corrective dips are expected to offer better buying opportunities, as pound’s sentiment remains very negative.
Markets already speculate about test of parity level (the pair reached the closest level at 0.9802 on 30 Dec 2008) despite lowered bets for such scenario.
Former high at 0.9050 (17 July) is expected to contain extended dips and keep bulls intact.
Res: 0.9189; 0.9203; 0.9226; 0.9306
Sup: 0.9142; 0.9114; 0.9050; 0.9000
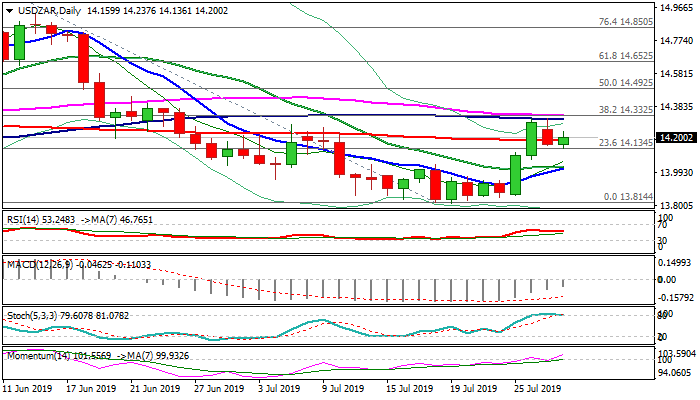
USD/ZAR Outlook: Bullish N/T Outlook above 14.12 Fibo Support
Bulls are regaining traction and return above 200DMA (14.18) after two-day pullback (following double-rejection at 100DMA at 14.30), found footstep at 14.13 (just above Fibo 38.2% of 13.81/14.31 upleg).
Signals from daily techs are still mixed, as bullish momentum continues to rise, but stochastic is reversing from overbought zone, while RSI is flat and MA's are in mixed setup.
Strong bullish momentum and daily cloud twist on 2 Aug, work in favor of bulls, which need firm break above key barriers at 14.30/33 zone (100DMA/Fibo 38.2% of 15.17/13.81/55DMA) to spark fresh extension of recovery phase from 13.81 base (also 200WMA) towards targets at 14.49 (Fibo 50%) and 14.53 (daily cloud base).
Conversely, repeated close below 200DMA would keep pivotal Fibo support at 14.12 under pressure, with break lower to risk deeper pullback.
Res: 14.23; 14.30; 14.33; 14.40
Sup: 14.12; 14.06; 14.02; 14.00