Sample Category Title
USD/CAD Daily Outlook
Daily Pivots: (S1) 1.3131; (P) 1.3150; (R1) 1.3183; More....
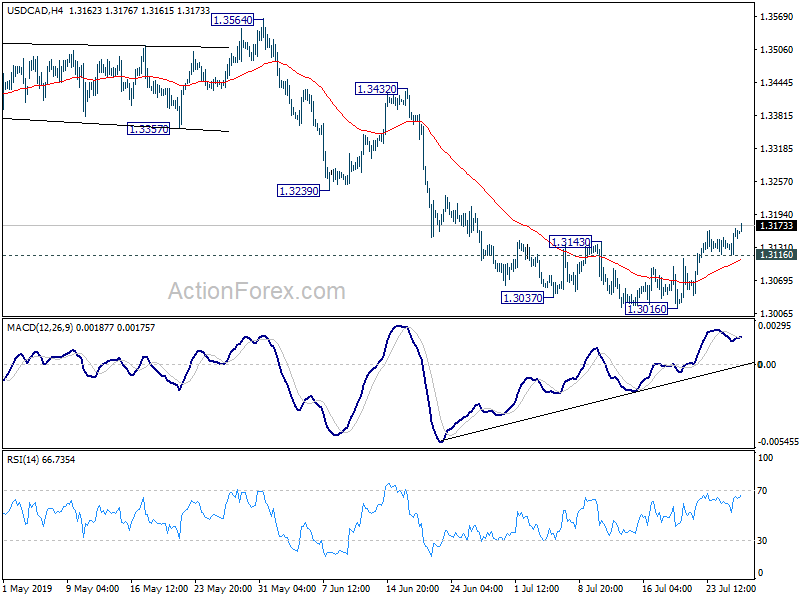
Intraday bias in in USD/CAD remains on the upside this point. Rebound from 1.3016 short term bottom would target 55 day EMA (now at 1.3212). Sustained break there would pave the way back to 1.3564/3664 resistance zone. On the downside, break of 1.3116 minor support will turn bias back to the downside for 1.3016 low instead.
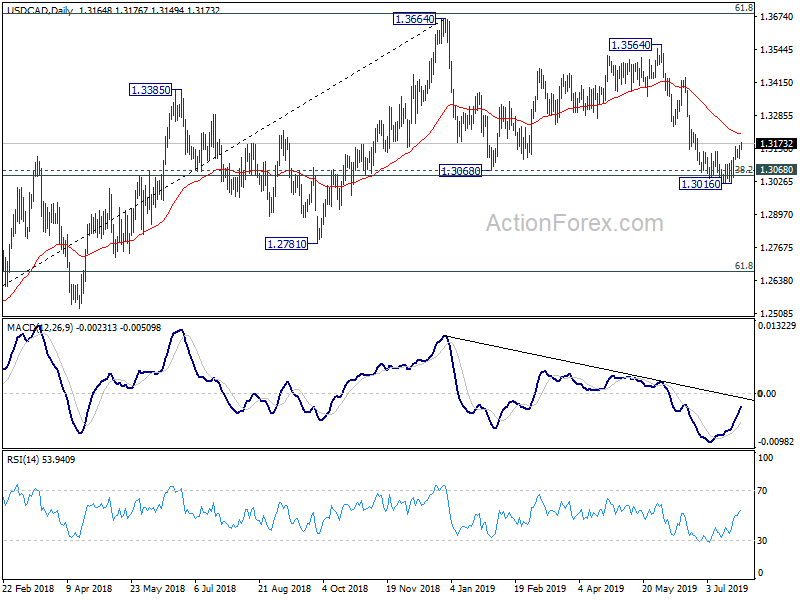
In the bigger picture, decisive break of 1.3068 cluster support (38.2% retracement of 1.2061 to 1.3664 at 1.3052) will confirm completion of up trend from 1.2061 (2017 low). Further fall should be seen to 61.8% retracement at 1.2673 next. On the upside, sustained break of 61.8% retracement of 1.4689 (2016 high) to 1.2061 at 1.3685, is needed to confirm resumption of up trend from 1.2061 (2017 low). Otherwise, risk will stay on the downside.
Dollar Could Get Lift From Stronger-Than-Expected US GDP Print
Most Asian currencies are set to end the week on the back foot against the US Dollar, with the Dollar Index (DXY) having gained about 0.7 percent so far this week. The Greenback has been whipsawed lately by shifting market expectations over the scope of next week's widely expected Fed rate cut. Despite the Fed's dovish rhetoric, the Dollar Index has shown remarkable resilience, recovering from sub-96 levels in late June to now being within touching distance of the 98 mark.
A better-than-expected US Q2 GDP print due Friday could be another stepping stone for the DXY to embrace the 98 handle for the first time since May. The Greenback is expected to remain fundamentally supported by the US economy's resilience compared to its major developed peers, especially in light of ECB President Mario Draghi's admission that the EU economic outlook is getting "worse and worse".
ECB leaves door open for Fed to cut rates first
The Euro hit a fresh two-year low only to recover sharply after the European Central Bank (ECB) paved the way for an interest rate cut later this year. Although the ECB left interest rates unchanged at the July meeting, at the time of writing, markets are pricing in an 84.7 percent chance of a 10-basis point cut to interest rates in September.
At already a record low of minus 0.4 percent, investors will wonder if pushing interest rates further into negative territory will be enough to sustain the EU's economic growth momentum. More stimulus, such as a revival of the ECB's bond-buying programme, may be required to ensure the EU's economic conditions do not capitulate in the face of persistent global headwinds.
Should markets grow increasingly optimistic of a larger-than-expected stimulus package for the EU economy in September, accompanied by deteriorating economic data in the interim, that could open a path below 1.10 for EURUSD. The dovish language adopted by Draghi should hearten Euro bears, as the rate-cuts chorus among global central bankers grows louder.
Boris vs. Brussels in Brexit bog
The Brexit impasse has already reared its ugly head, just days into Boris Johnson's tenure as UK Prime Minister, as European Commission President Jean-Claude Juncker rejected Johnson's suggestion for any changes to the existing Brexit deal. The deadlock appears to solidify market concerns over the prospects of a no-deal Brexit, keeping the Pound rooted around the 1.24 mark against the US Dollar.
Investors will be looking for signs as to who will break first - Boris or Brussels. Should both sides stick to their guns and a no-deal Brexit materialises, that is set to trigger a fresh round of risk aversion in Q4 while dragging the global growth outlook lower as we step into 2020.
AUD/USD Daily Outlook
Daily Pivots: (S1) 0.6935; (P) 0.6960; (R1) 0.6977; More...
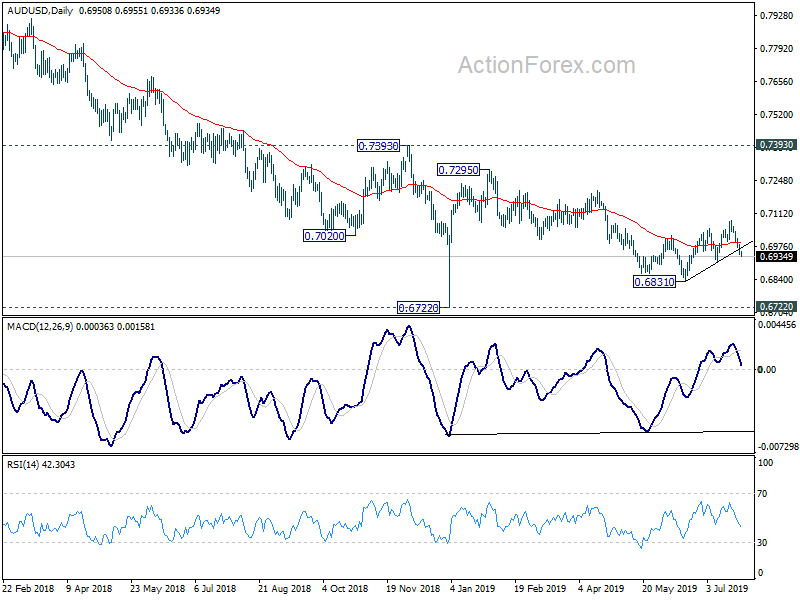
Intraday bias in AUD/USD remains on the downside for 0.6910 support. Break will confirm that rebound from 0.6831 has completed with three waves up to 0.7082. Such development will also argue that fall from 0.7295 is in progress for 0.6722 low. On the upside, above 0.6991 minor resistance will turn intraday bias neutral first.
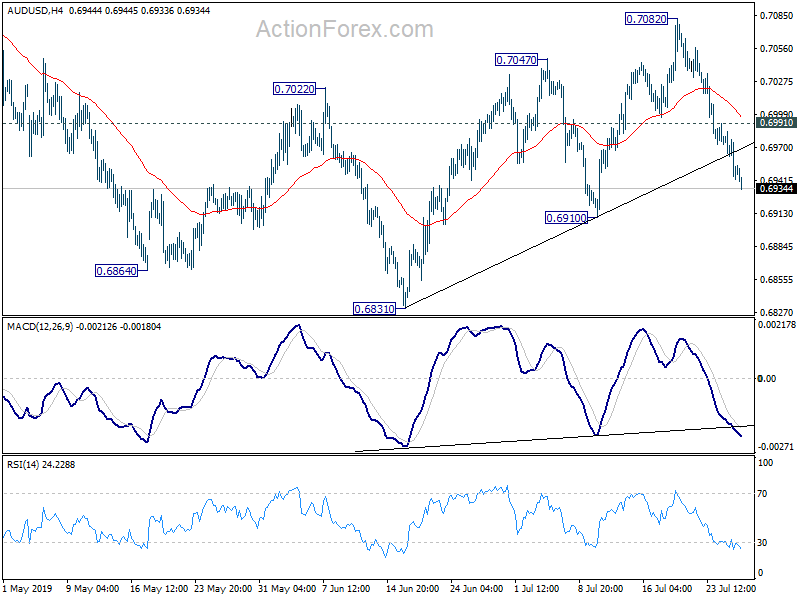
In the bigger picture, with 0.7393 key resistance intact, medium term outlook remains bearish. The decline from 0.8135 (2018 high) is seen as resuming long term down trend from 1.1079 (2011 high). Decisive break of 0.6826 (2016 low) will confirm this bearish view and resume the down trend to 0.6008 (2008 low). However, firm break of 0.7393 will argue that fall from 0.8135 has completed. And corrective pattern from 0.6826 has started the third leg, targeting 0.8135 again.
EUR/USD Daily Outlook
Daily Pivots: (S1) 1.1103; (P) 1.1145; (R1) 1.1190; More...
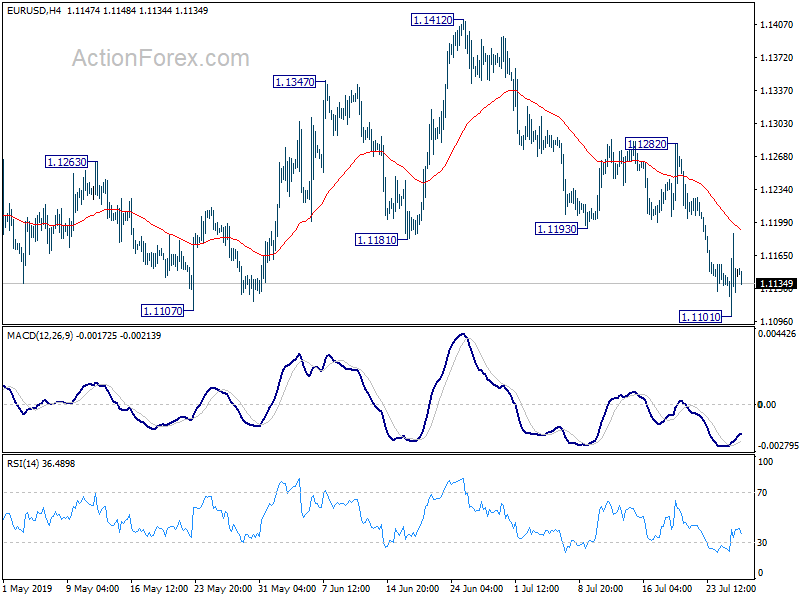
Intraday bias in EUR/USD stays neutral for the moment and stronger recovery could be seen. But for now, break of 1.1282 resistance is needed to confirm completion of fall from 1.1412. Otherwise, another decline will remain mildly in favor. Though, firm break of 1.1282 will bring stronger rise to 1.1412 resistance.
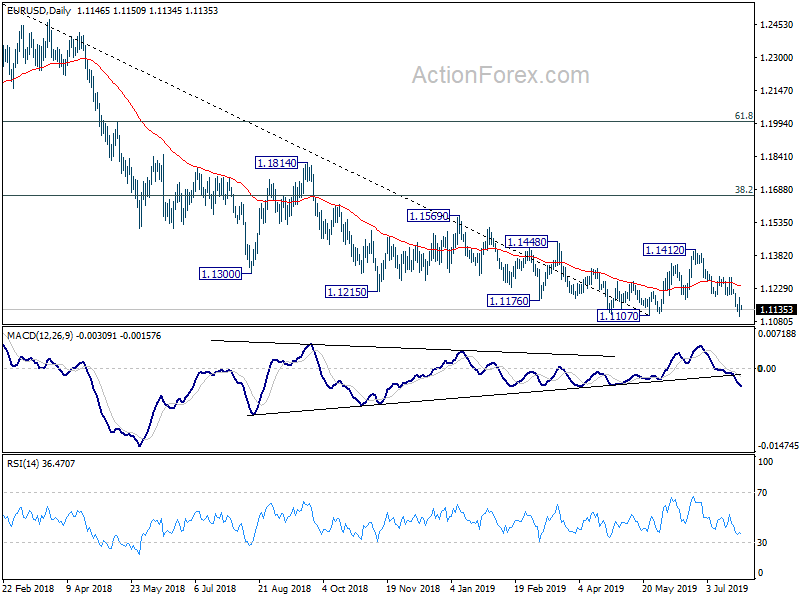
In the bigger picture, on the one hand, 1.1107 is seen as a medium term bottom on bullish convergence condition in weekly MACD. On the other hand, rejection by 55 week EMA retains medium term bearishness. Outlook stays neutral for now. On the downside, break of 1.1107 will resume the down trend from 1.2555 (2018 high) to 78.6% retracement of 1.0339 to 1.2555 at 1.0813. Meanwhile, break of 1.1412 will resume the rebound to 38.2% retracement of 1.2555 to 1.1107 at 1.1660.
GBP/USD Daily Outlook
Daily Pivots: (S1) 1.2422; (P) 1.2470; (R1) 1.2503; More....
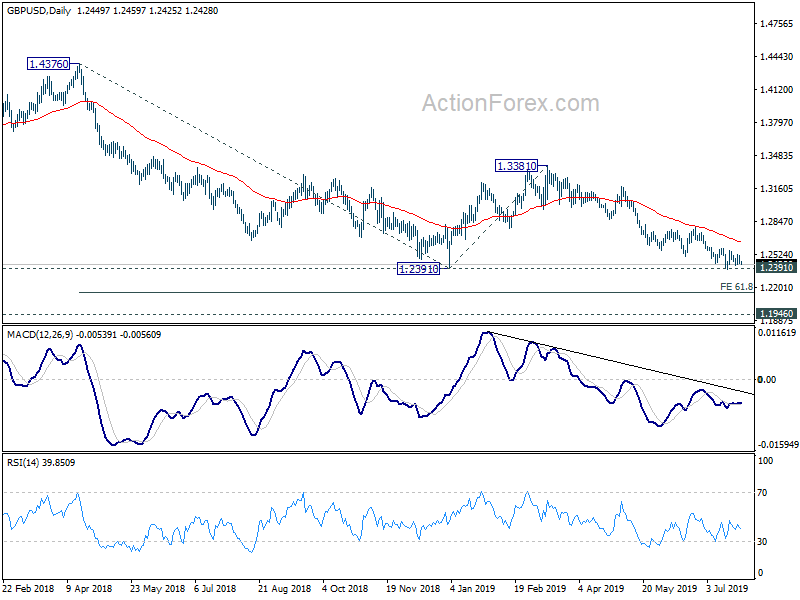
Intraday bias in GBP/USD remains neutral and outlook is unchanged. With 1.2579 resistance intact, further decline is in favor. On the downside, sustained break of 1.2391 key support will resume larger down trend for 61.8% projection of 1.4376 to 1.2391 from 1.3381 at 1.2154 next. Though, break of 1.2579 will indicate short term bottoming and bring stronger rebound back to 1.2783 resistance. In this case, consolidation from 1.2391 would extend with another rise, towards 1.3381 resistance, before completion.
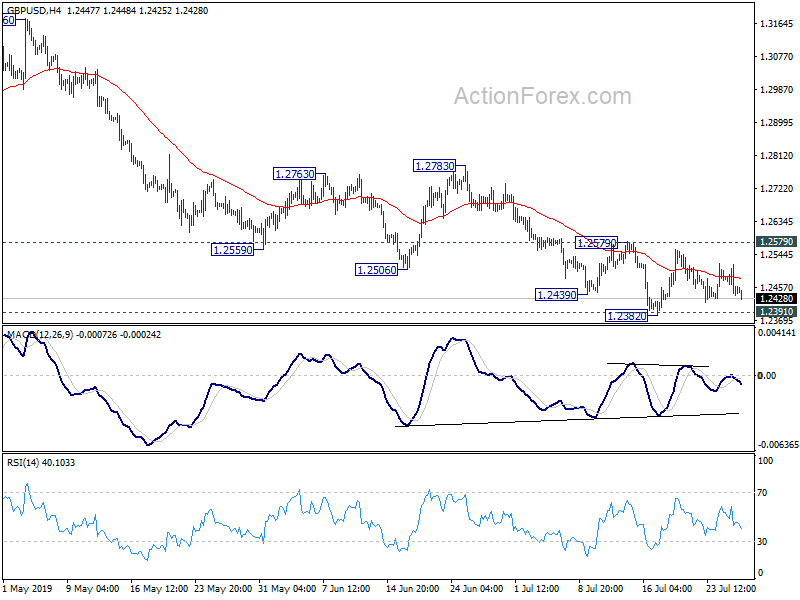
In the bigger picture, down trend from 1.4376 (2018 high) is still in progress. Break of 1.2391 would target a test on 1.1946 long term bottom (2016 low). For now, we don't expect a firm break there yet. Hence, focus will be on bottoming signal as it approaches 1.1946. In any case, medium term outlook will stay bearish as long as 1.3381 resistance holds, in case of strong rebound.
Chinese Buyers Are Highly Active In OTC Market
Bitcoin price has plunged nearly 34 percent from its high of $13,851 formed on June 26, but it is still up almost 158 percent year-to-date. Among the top 3 coins: ETH and XRP, Bitcoin’s performance is unmatchable because ETH is up only 58.56 percent YTD while Ripple’s XRP is actually down -12.93 percent. It is broadly recognised that the crypto-winter has come to an end, but there is also another reality, this time the bull strength is largely for Bitcoin. This is mainly due to the reason that investors are playing safe and they do not want to be burnt like before when half of the space was covered by sham projects, and until this day, ETH is paying the price of this.
So the question is which way Bitcoin is going to move given that the price has retraced more than one third from its recent high?
In traditional markets, when the price retraces 10% from its previous high, it usually means correction, and a 20 percent drop stipulates that we are in a bear market. But, in crypto market similar principle cannot be applied and this is because traditional markets do not experience gains of 158 percent in six months.
In order to analyse this and find out if bulls have lost control of the price, one can use the golden principle: look at the current price movement and compare it with the major moving averages. However, before I do that, it is also important to keep an eye on the OTC market and see what kind of orders are there and most importantly, who are the buyers?
During the peak (when Bitcoin price touched $20,000), the premium for the Bitcoin price in the OTC market in Dubai was nearly 20% plus the spot price. Sticking to the same measure, the premium for Bitcoin price in the OTC market in Dubai is between 10-15% now. These unofficial OTC dealers say that the reason for the premium being too high is due to two reasons: firstly, there is a lot of optimism that something is about to come out of China with the respect to Bitcoin regulation. This is why Chinese buyers are happy to pay to the premium. Secondly, it is the US sanctions on different countries. This has brought more buyers in the market, clearly bullying behaviour doesn’t work.
In fact, something which needs some serious attention is that the governments which are suffering from the US sanctions such as Russia, Iran, North Korea (and many more) can easily form a collation together and firepower the bitcoin mining process by using the government electric power.
Now, going back to the topic of technical analysis, the price is in a constant battle with 50-day moving average, it dropped below this a few times in the past few days. It was the first time since February, that the price closed below this average on Wednesday. Lucky for the bulls, the price crossed above this moving average yesterday. This back an forth move tells me that the bears are trying their best to push the bitcoin price lower. In terms of support, I believe that the immediate support level is near the 100-day moving average which is trading at $7,364.
To conclude, it appears that the trading range is going to be between $7,364 to $14,000.
USD/JPY Daily Outlook
Daily Pivots: (S1) 108.21; (P) 108.48; (R1) 108.91; More...
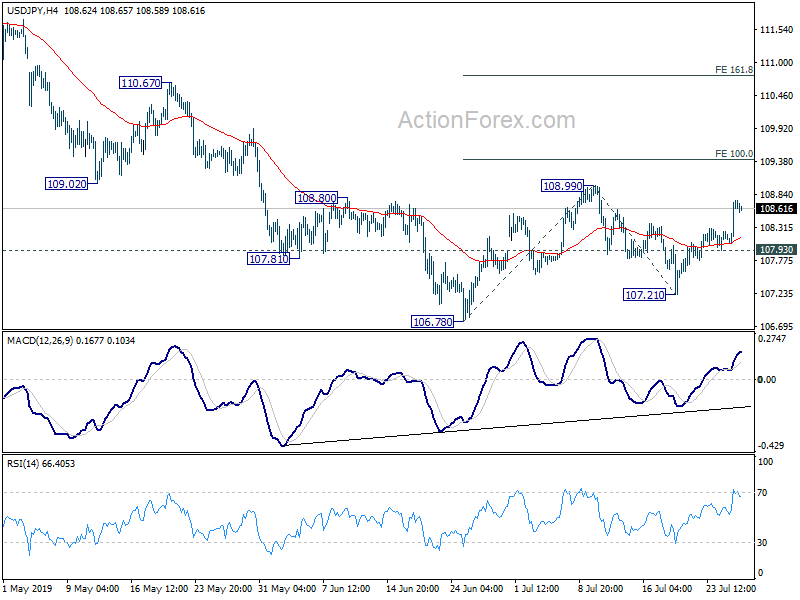
Intraday bias in USD/JPY remains on the upside for the moment. Rebound from 106.78 is in progress. Break of 108.99 will target 100% projection of 106.78 to 108.99 from 107.21 at 109.42 and then 161.8% projection at 110.78. On the downside, below 107.93 minor support will turn bias back to the downside instead.
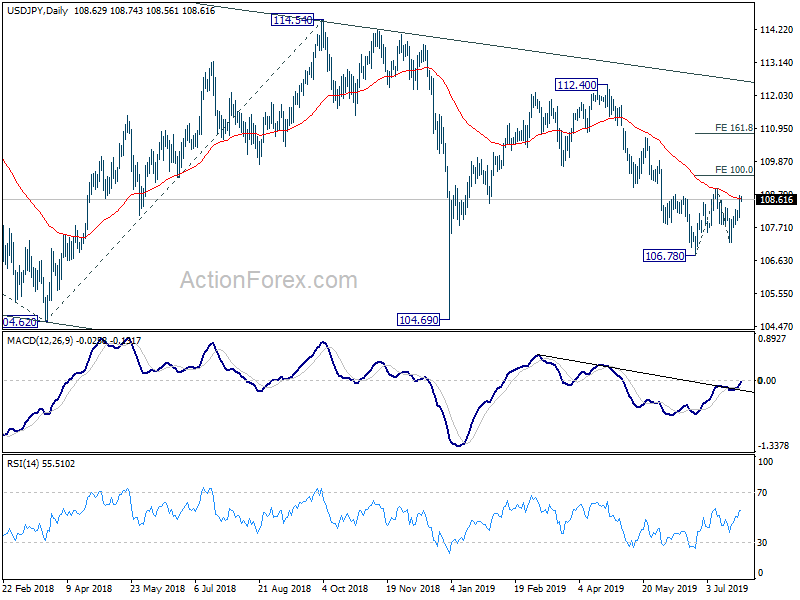
In the bigger picture, decline from 118.65 (Dec. 2016) is still in progress, with the pair staying inside long term falling channel. Break of 104.62 will target 100% projection of 118.65 to 104.62 from 114.54 at 100.51. For now, we'd expect strong support above 98.97 (2016 low) to contain downside to bring rebound. In any case, break of 112.40 is needed to the first serious sign of medium term bullishness. Otherwise, further decline will remain in favor in case of rebound.
EUR/USD Performance Was Mainly Driven By The ECB Story
Markets
The ECB promised but did not deliver (yet) yesterday. There will be more stimulus: a rate cut will probably come as soon as September which is likely to be accompanied by a tiered deposit system. The ECB is also looking into options for revamping quantitative easing but Draghi didn't want to elaborate on that. Click here for a detailed review. However, investors have been frontrunning more easing quite a lot and were hoping for acts rather than just words. Bond yields suffered knee-jerk losses after the policy statement announcing more stimulus, but rebounded during the press conference. The German 10-yr yield touched a new low at -0.42% but finished at -0.36% (+1.5 bp). Other maturities added 1.8 (2-yr) to 3.1 (30-yr) bps. Peripheral spreads were unchanged. Solid US data and Draghi spill-overs triggered a bear flattening of the US yield curve, with daily changes varying from 4.7 bps (2-yr) to 3.7 bps (10-yr). The focus today will be on US GDP growth for Q2. Markets anticipate a rather soft 1.8% QoQa growth. Net trade might have contributed negatively but we believe that ‘core' GDP growth (investment, consumption) will be at the higher end of expectations. The latter is key for markets. Decent to strong fundamentals will further erode odds of a 50 bps rate cut by the Fed next week, which could cause outperformance of US Treasuries vs. the German Bund today.
FX markets traded similarly to bond markets yesterday. EUR/USD traded muted ahead of the ECB before slipping near the crucial 1.11 support after the policy statement got published. However, as was the case in bonds, ECB frontrunners were forced to reposition. EUR/USD jumped higher in the 1.11 big figure but closed the session little changed at 1.1147. The EUR/USD performance was mainly driven by the ECB story. At the same time, USD/JPY performed rather strong, especially considering the correction on global equity markets. Strong US durable orders data probably reinforced the view that it is too early for aggressive Fed easing next week, supporting the dollar. USD/JPY closed the session at 108.63 (from 108.19). Today, the focus for FX trading turns from the euro to the dollar. Headline US GDP growth will probably print rather soft, but the underlying story might remain constructive. In theory, this narrative might be (slightly) supportive for the dollar. However, it probably won't be enough for markets to scale back Fed easing expectations further out in time. Yesterday, the EUR/USD 1.11 range bottom again proved to be very solid. We assume that today's US data won't be strong enough for a break beyond this level. The established 1.11/1.13 range might survive in the run-up to next week's Fed meeting.
Freshly sworn in PM Johnson held a first Parliamentary debate with its new cabinet yesterday. The most important takeaway was him again demanding the removal of the Irish backstop from the current Brexit deal and pledging the UK would leave the EU on October 31 without a deal if necessary. Concrete steps on his approach were absent. EUR/GBP trading therefore mainly found inspiration with the ECB. The couple slipped to an intraday low of 0.89 but soon recovered on euro strength post ECB, although some sterling weakness could have played part as EU officials called Johnson's backstop demand "unacceptable". The couple eventually closed higher in the mid 0.89's. With an empty UK/EMU calendar, there's little to inspire sterling investors today. We hold our neutral bias on the pound as markets await the first Brexit negotiations. Trading is likely to be technically in nature.
News Headlines
The US House of Representatives passed the spending and debt limit bill announced by president Trump earlier this week. The legislation – which raises federal budget spending and suspends debt limits over the next two years – is now heading for the Senate to be debated next week.
PM Sanchez did not receive enough support for his bid to become Spain's next PM during a second vote yesterday as he failed to convince the far-left Podemos. Sanchez refuses to "throw in the towel" however, saying he will continue to talk with the three largest opposition parties to unblock the impasse.
Gold Reached The Biggest Extreme, What’s Next?
In this Chart of the Day, we have explained that Gold has reached the biggest extreme from 2015 lows by reaching our target area at $1450. However, Gold is calling for another push higher in biggest time frame charts still but near-term cycles are calling for a pullback to reset before another push higher takes place. Now let's take a look at the shorter cycles & look at Elliott wave structures below:
Gold 1 Hour Elliott Wave Chart
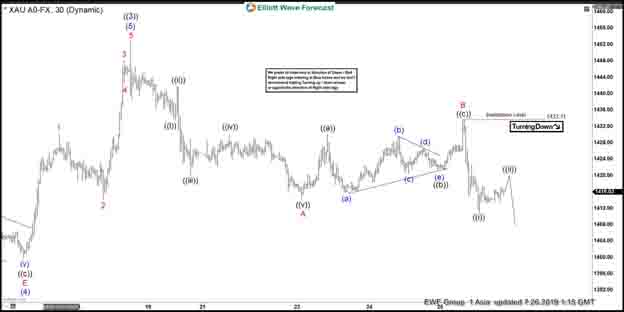
Gold 1 hour Elliott wave Chart from Asia update, in which a pullback to $1389.82 low ended the wave (4) pullback. Up from there, a rally to $1452.95 high ended wave (5), which also completed a bigger wave ((3)). Down from there, the wave ((4)) pullback is taking place in 3, 7 or 11 swings to correct the rally from 4/23/2019 low (1265). While the pullback from the peak is taking place as a zigzag structure where wave ((i)) ended at $1433.30 low. Wave ((ii)) ended at $1441.85 high, wave ((iii)) ended at $1423.60 low, wave ((iv)) bounce ended at $1430.02 high and wave ((v)) ended at $1416.88 low, which also completed wave A lower.
Up from there, wave B bounce unfolded as a lesser degree zigzag structure where wave ((a)) ended at $1430.23 high. Wave ((b)) ended at $1421.40 low and wave ((c)) ended at $1433.71 high. Down from there, wave C remains in progress in another 5 waves structure looking for more downside towards $1395.36-$1385.67 100%-123.6% Fibonacci extension area of A-B. Then from there, Gold will determine either if it's going to rally for new highs in wave ((5)) or just do a 3 wave bounce and fail again to do the double correction lower. We don't like selling it and expect buyers to appear again in wave ((4)) pullback at the later stage of the market.
ETHUSD Rejected From $220.00
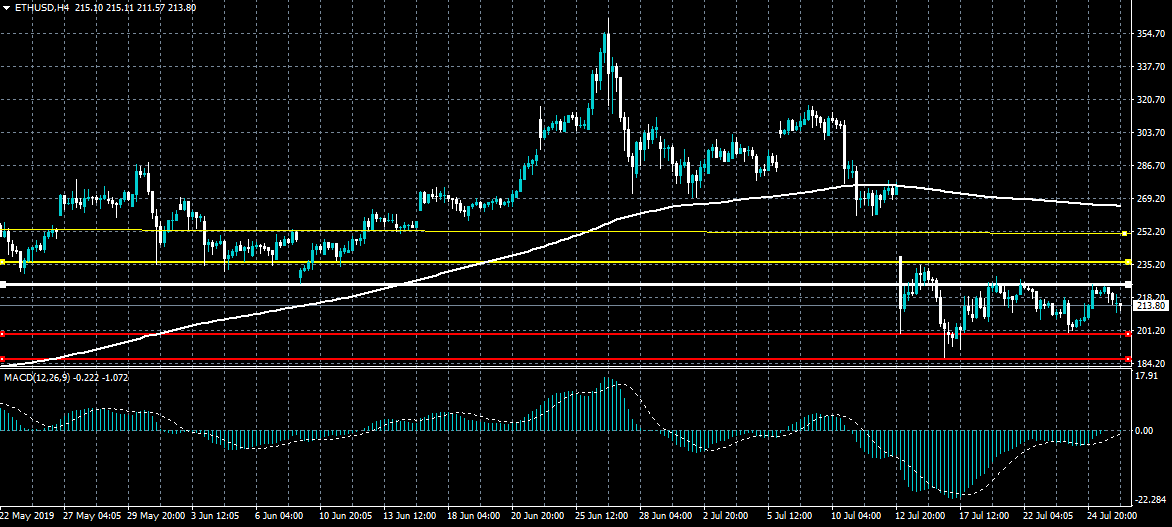
Ethereum has once again been rejected from the $220.00 level after bouncing sharply from its weekly pivot point on Wednesday. Technical failure before the $220.00 level is likely to prompt yet another critical technical test of $200.00 support zone. A sustained break below the $200.00 level should prompt a strong move lower towards at least the $185.00 resistance level.
If the ETHUSD pair trades above the $220.00 level, key resistance is found at the $235.00 and $250.00 levels.
If the ETHUSD pair trades below the $220.00 level, key support is found at the $200.00 and $185.00 levels