Sample Category Title
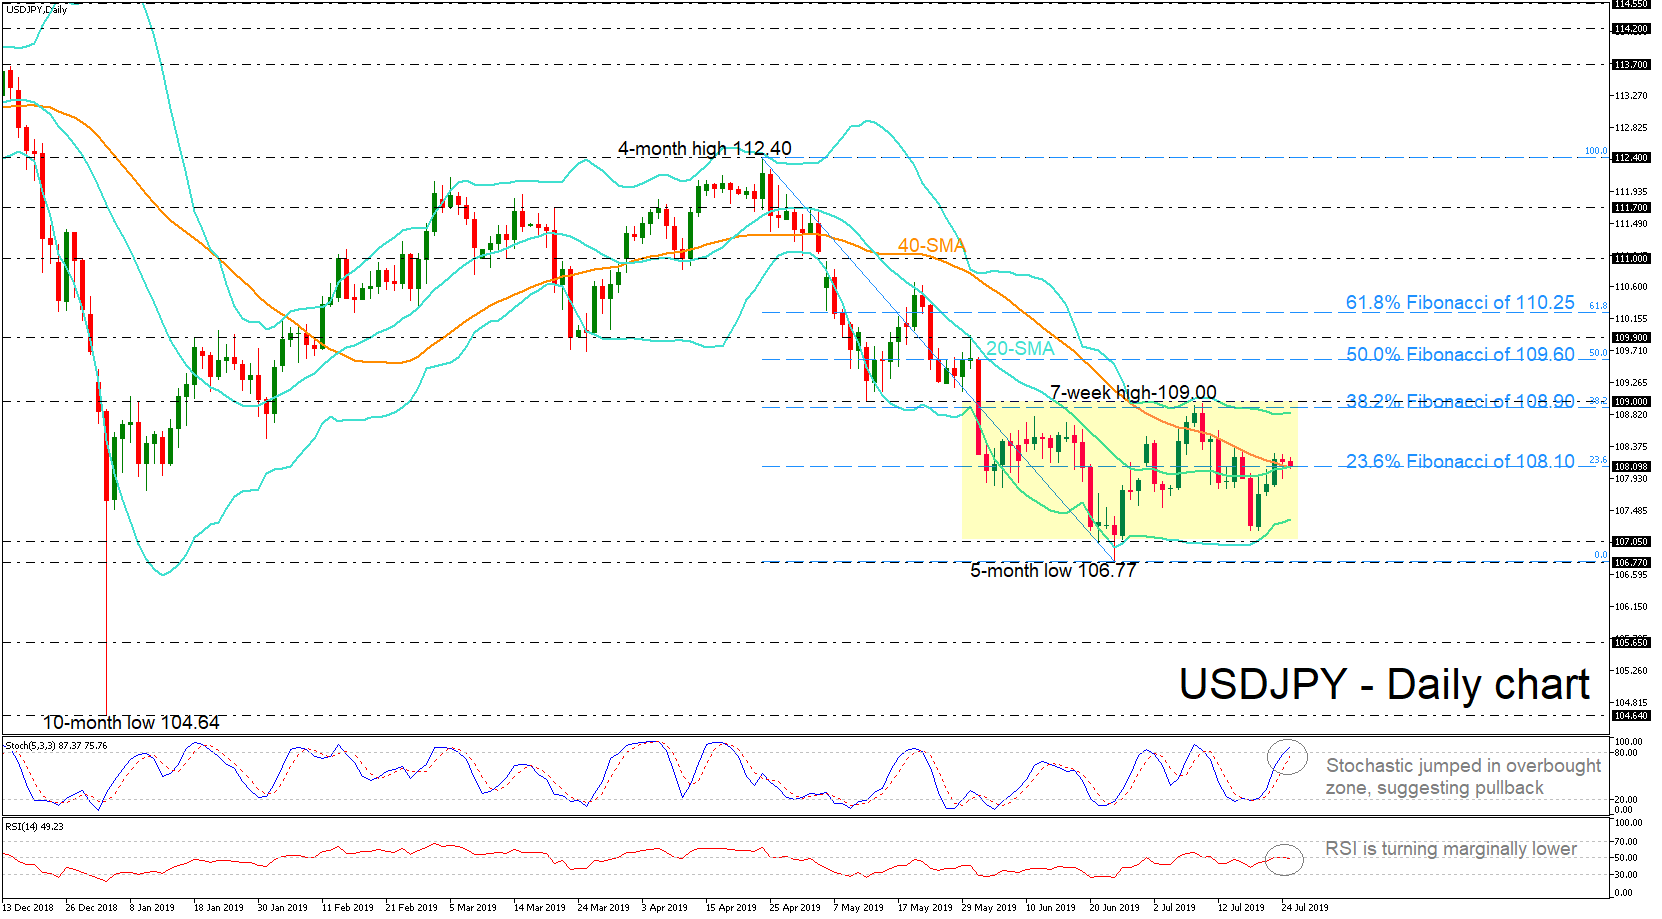
USD/JPY The Bias Remains Bullish
Pivot (invalidation): 108.00
Our preference Long positions above 108.00 with targets at 108.30 & 108.50 in extension.
Alternative scenario Below 108.00 look for further downside with 107.80 & 107.60 as targets.
Comment A support base at 108.00 has formed and has allowed for a temporary stabilisation.
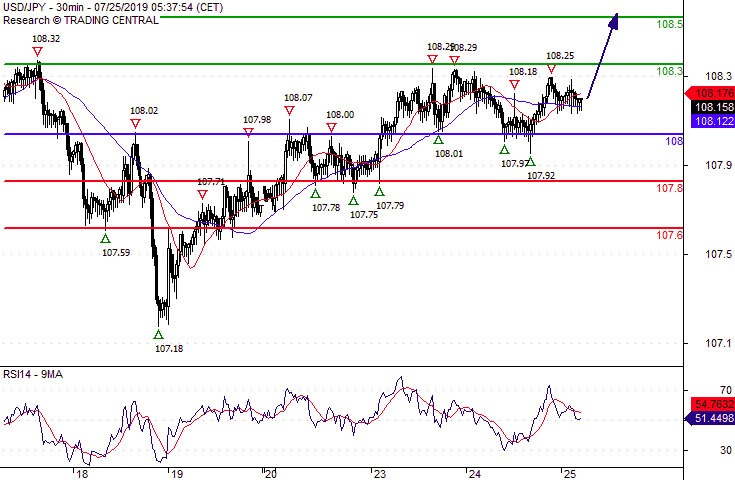
GBP/USD Turning Down
Pivot (invalidation): 1.2500
Our preference Short positions below 1.2500 with targets at 1.2470 & 1.2450 in extension.
Alternative scenario Above 1.2500 look for further upside with 1.2520 & 1.2540 as targets.
Comment The RSI lacks upward momentum.
EUR/JPY Daily Outlook
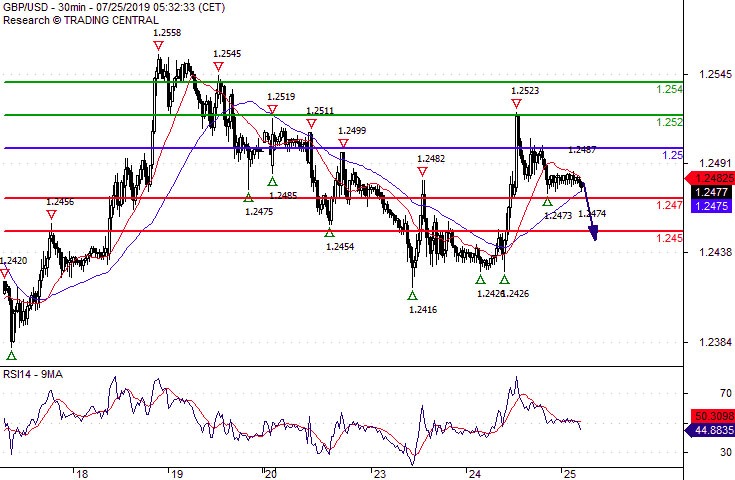
Daily Pivots: (S1) 120.24; (P) 120.47; (R1) 120.74; More....
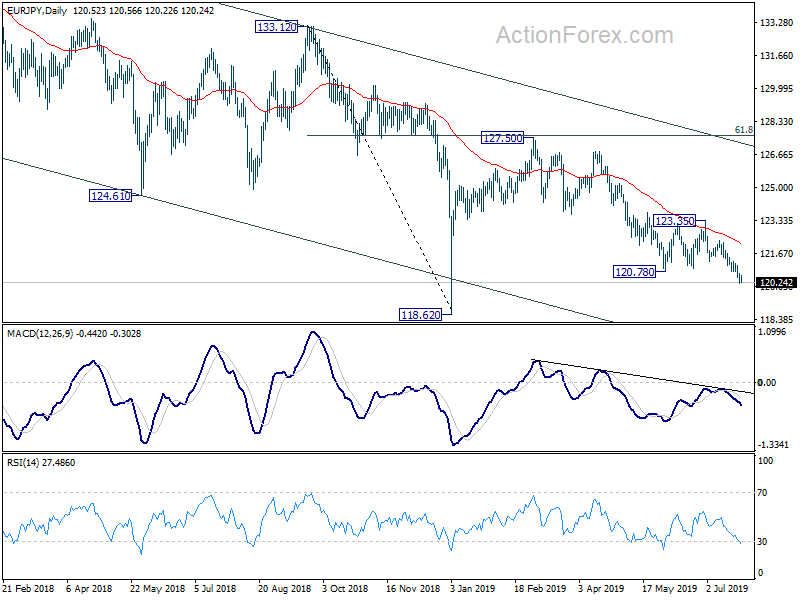
EUR/JPY's is in progress and intraday bias remains on the downside. Current decline from 127.50 should target 118.62 low next. Break will resume medium term down trend. On the upside, above 120.78 minor resistance will turn intraday bias neutral and bring consolidation first. But outlook will stay bearish as long as 122.32 resistance holds.
In the bigger picture, down trend from 137.49 is still in progress with the cross staying inside long term falling channel. Break of 118.62 will extend the fall to 109.48 (2016 low). On the upside, break of 127.50 resistance is needed to be the first sign of medium term reversal. Otherwise, outlook will remain bearish in case of strong rebound.
EUR/USD Towards 1.1105
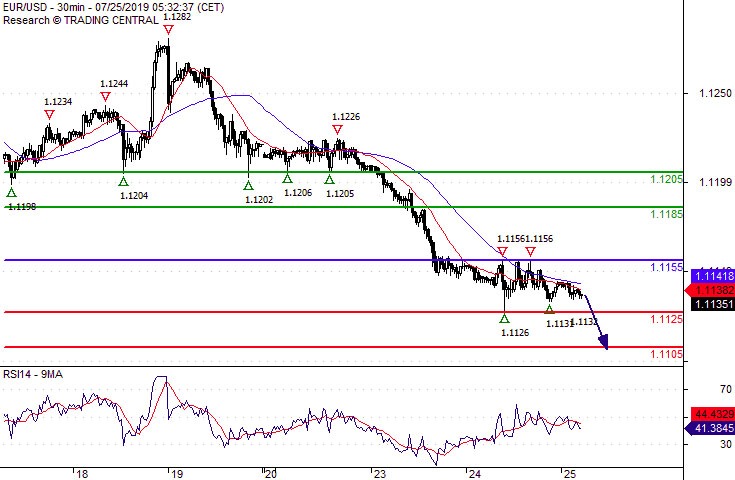
Pivot (invalidation): 1.1155
Our preference Short positions below 1.1155 with targets at 1.1125 & 1.1105 in extension.
Alternative scenario Above 1.1155 look for further upside with 1.1185 & 1.1205 as targets.
Comment A break below 1.1125 would trigger a drop towards 1.1105.
EUR/GBP Daily Outlook
Daily Pivots: (S1) 0.8894; (P) 0.8935; (R1) 0.8963; More...
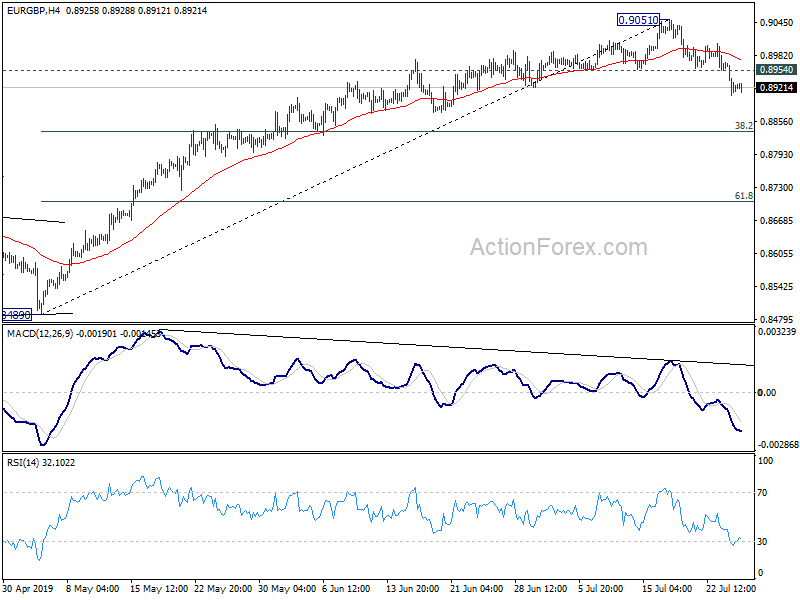
Intraday bias in EUR/GBP remains on the downside at this point. Fall from 0.9051 short term top is seen as correcting rise from 0.8489. Break of EMA (now at 0.8891) will target 38.2% retracement of 0.8489 to 0.9051 at 0.8836. On the upside, above 0.8954 will turn intraday bias first. But deeper pull back would remain in favor as long as 0.9051 resistance holds.
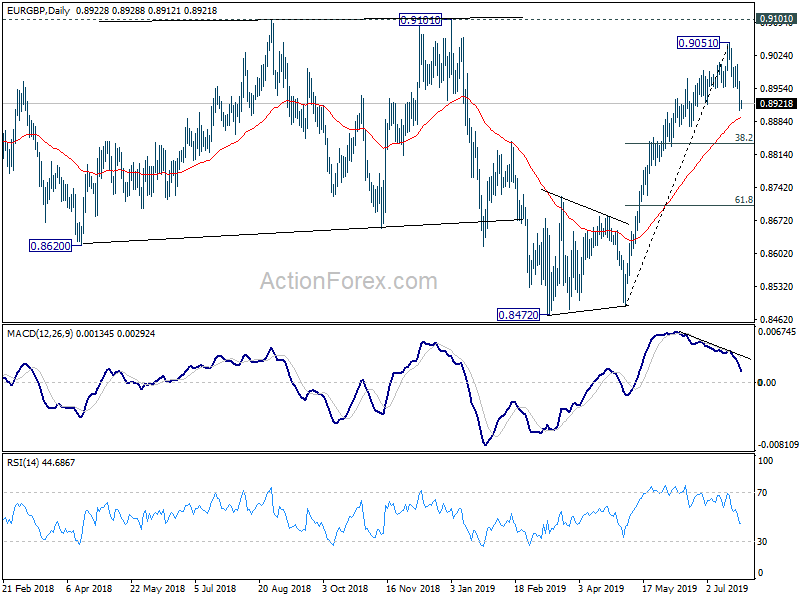
In the bigger picture, medium term decline from 0.9305 (2017 high) is seen as a corrective move. No change in this view. Current development argues that it might have completed with three waves down to 0.8472, just ahead of 38.2% retracement of 0.6935 (2015 low) to 0.9306 at 0.8400, after hitting 55 month EMA (now at 0.8545). Decisive break of 0.9101 resistance will confirm this bullish case. However, firm break of 55 week EMA (now at 0.8805) would possibly extend the correction another another fall to below 0.8472 before completion.
EUR/AUD Daily Outlook
Daily Pivots: (S1) 1.5926; (P) 1.5951; (R1) 1.5988; More...
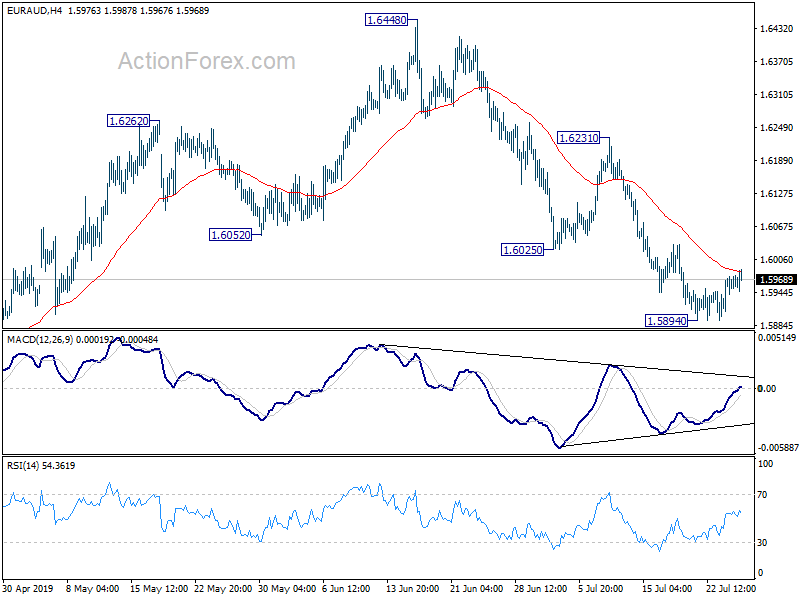
EUR/AUD is staying in consolidation from 1.5894 temporary low and intraday bias stays neutral. Stronger recovery cannot be ruled out. But upside should be limited below 1.6231 resistance to bring another fall. Decline from 1.6448 is seen as the third leg of the consolidation pattern from 1.6765 high. Break of 1.5894 will target 1.5683 support and below.
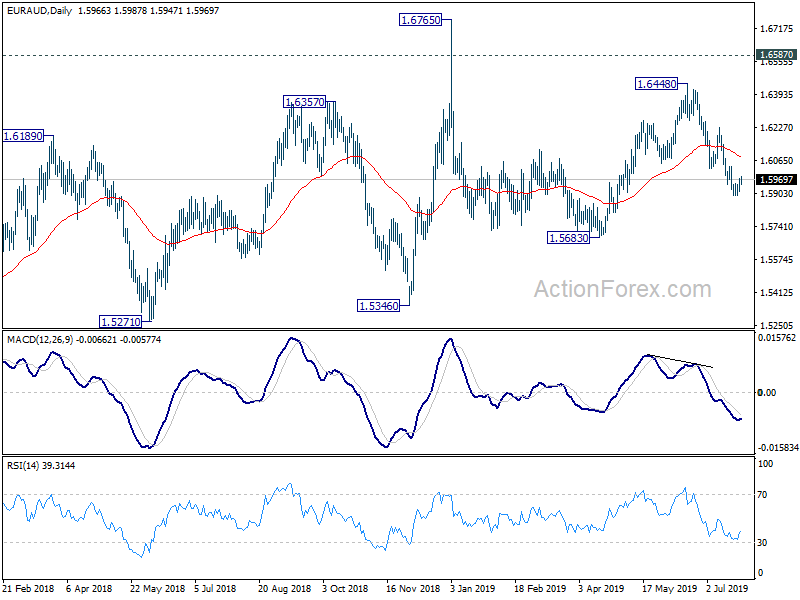
In the bigger picture, as long as 1.5346 support holds, outlook will still remain bullish. Up trend from 1.1602 (2012 low) is expected to resume sooner or later. Break of 1.6765 will target 61.8% retracement of 2.1127 (2008 high) to 1.1602 at 1.7488 next. However, firm break of 1.5346 key support will indicate trend reversal and turn outlook bearish.
Gold Prices Consolidate Ahead of ECB’s Meeting
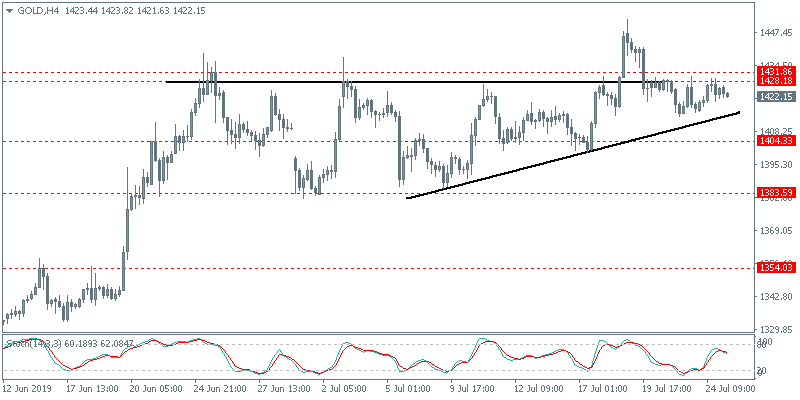
The precious metal is trading within the range from the past few days. This comes as the European Central Bank is due to meet later today. The markets are expecting the ECB to announce plans to restart QE and potentially even cut interest rates lower. The dovish forward guidance could influence gold prices in the short term, to the upside.
Will XAUUSD Breakout from the Resistance?
Gold prices have been trading rather flat just below the resistance area of 1431–1428 level. This sideways range could remain in place in the short term. The bias remains mixed at the moment, however. Gold prices could see an upside breakout if it manages to close convincingly above the resistance area. Alternately, we expect the lower support at 1404 to hold the declines for now.
WTI Crude Oil Ignores EIA Inventory Draw
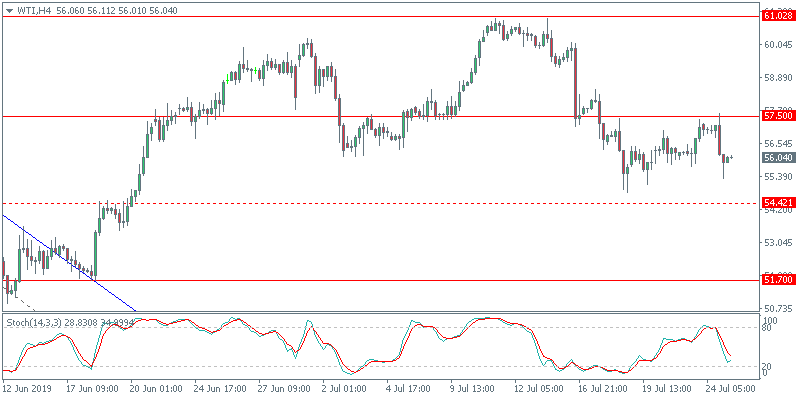
Crude oil prices were a bit volatile on Wednesday. The Energy Information Administration's weekly crude oil inventory report showed a drawdown of 10.8 million bpd. This was larger than forecasts. Yet, oil prices ignored the report as they closed in the red by Wednesday.
Oil Likely to Extend Declines to 54.42 Support
The reversal in oil prices met with the resistance area of 57.50. As a result, oil prices failed to breakout higher above this level. The declines we see could eventually settle near the minor support that is at 54.42 level. As long as this support holds, oil prices could remain caught within the range.
EURUSD Subdued Ahead of Key Policy Meeting
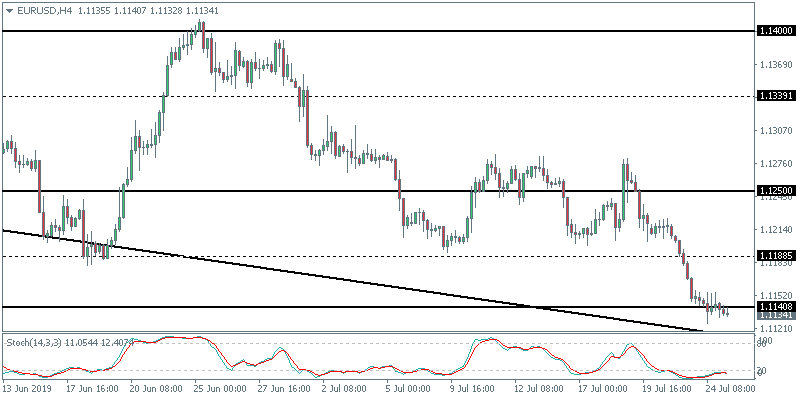
EURUSD was seen holding on to the support area of 1.1140. With the ECB due to meet later today, the currency pair could remain in a consolidating phase for the short term. Depending on the outcome of the ECB meeting, the euro currency could react in either direction.
Will the EURUSD Hold the Support?
The common currency is expected to remain trading near the 1.1140 level in the near term. The bias remains to the downside. The next lower target is seen at 1.1100. However, there is scope for price to pullback modestly higher. The resistance area of 1.1188 will be tested in the near term. A breakout above this level could see further gains in the near term.
USDJPY Bulls Look Exhausted Near Short-Term SMAs, Narrow Range Holds
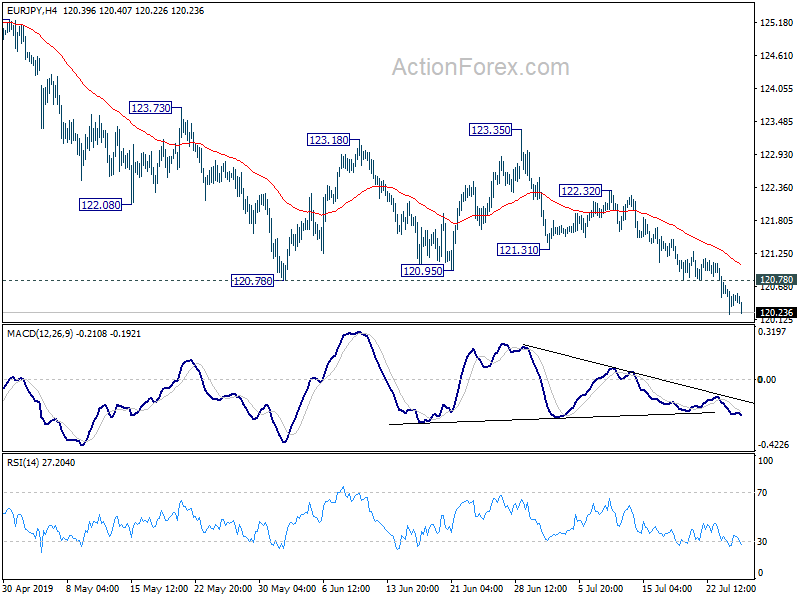
USDJPY is holding around the 23.6% Fibonacci retracement level of the downleg from 112.40 to 106.77 near 108.10 and the expected bullish crossover within the 20- and 40-simple moving averages (SMAs) in the daily timeframe. Currently, the price has been developing within a narrow range of 107.05 – 109.00 over the last two months and the Bollinger Bands are squeezing, approaching the market price.
Looking at the momentum indicators, the RSI is marginally falling below the 50 level, while the stochastic oscillator has already entered the overbought zone and is returning slightly lower, suggesting a downside pullback in the market.
If prices continue to head lower, support should come from the lower Bollinger band, around 107.35, before meeting the 107.05 barrier. A drop below it would open the door for the five-month low of 106.77 ahead of the 105.65 area, shifting the bias back to bearish.
However, should an upside reversal take form in the congestion area, immediate resistance will likely come from the upper Bollinger band, which stands near the 38.2% Fibonacci mark and the 109.00 psychological mark. A successful jump above these crucial levels could open the way for an upside rally towards the 50.0% Fibo of 109.60.
To summarize, USDJPY is currently looking neutral in the short-term timeframe, while in the medium-term the picture is seen as bearish unless the price returns to the 61.8% Fibonacci of 110.25.