

Sample Category Title
Australia’s CBA Manufacturing PMI Fell In July
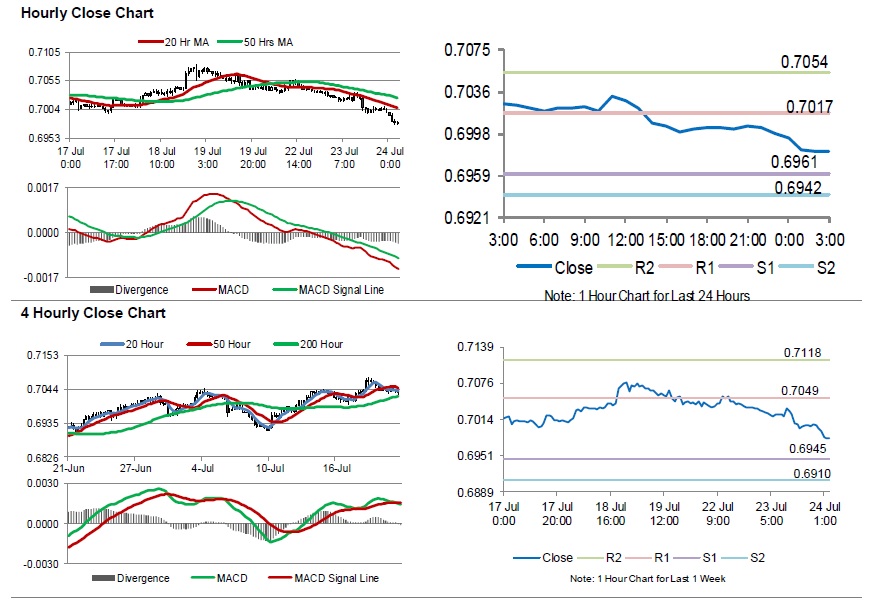
For the 24 hours to 23:00 GMT, the AUD declined 0.50% against the USD and closed at 0.6998.
LME Copper prices declined 0.7% or $39.5/MT to $5968.0/MT. Aluminium prices declined 0.7% or $13.0/MT to $1795.0/MT.
In the Asian session, at GMT0300, the pair is trading at 0.6981, with the AUD trading 0.24% lower against the USD from yesterday's close.
Overnight data showed that Australia's CBA manufacturing PMI eased to a level of 51.4 in July, following a reading of 52.6 in the prior month. Moreover, the nation's services PMI fell to a level of 51.9 in July, compared to a reading of 52.6 in the preceding month.
Separately, the IMF expects China, Australia's largest trading partner, to record a moderate growth of 6.2% in 2019 and 6.0% in 2020.
The pair is expected to find support at 0.6961, and a fall through could take it to the next support level of 0.6942. The pair is expected to find its first resistance at 0.7017, and a rise through could take it to the next resistance level of 0.7054.
The currency pair is trading below its 20 Hr and 50 Hr moving averages.
Gold: Yellow Metal Trading Higher In The Morning Session
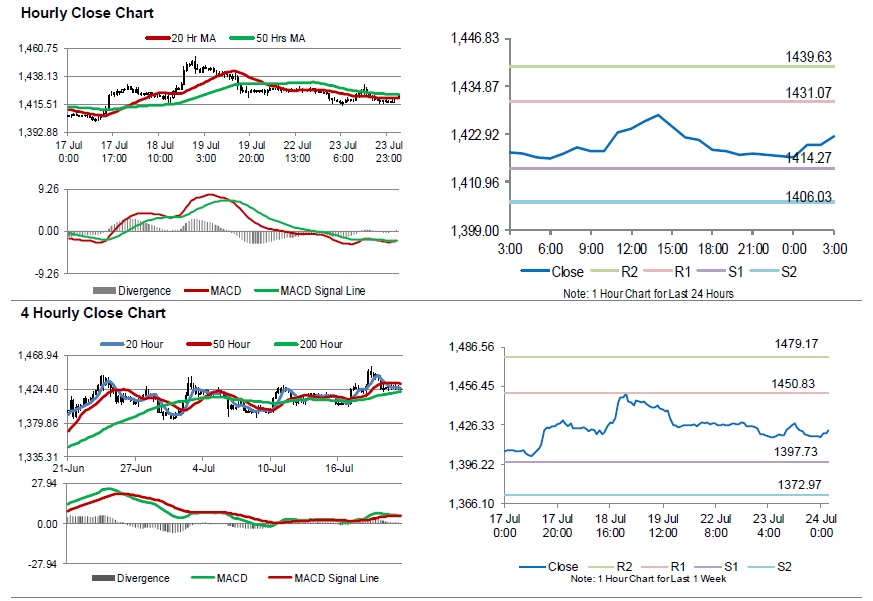
For the 24 hours to 23:00 GMT, Gold declined 0.49% against the USD and closed at USD1417.80 per ounce, amid broad strength in the greenback.
In the Asian session, at GMT0300, the pair is trading at 1422.50, with gold trading 0.33% higher against the USD from yesterday’s close.
The pair is expected to find support at 1414.27, and a fall through could take it to the next support level of 1406.03. The pair is expected to find its first resistance at 1431.07, and a rise through could take it to the next resistance level of 1439.63.
The yellow metal is showing convergence with its 20 Hr and 50 Hr moving averages.
Silver: White Metal Trading On A Stronger Footing This Morning
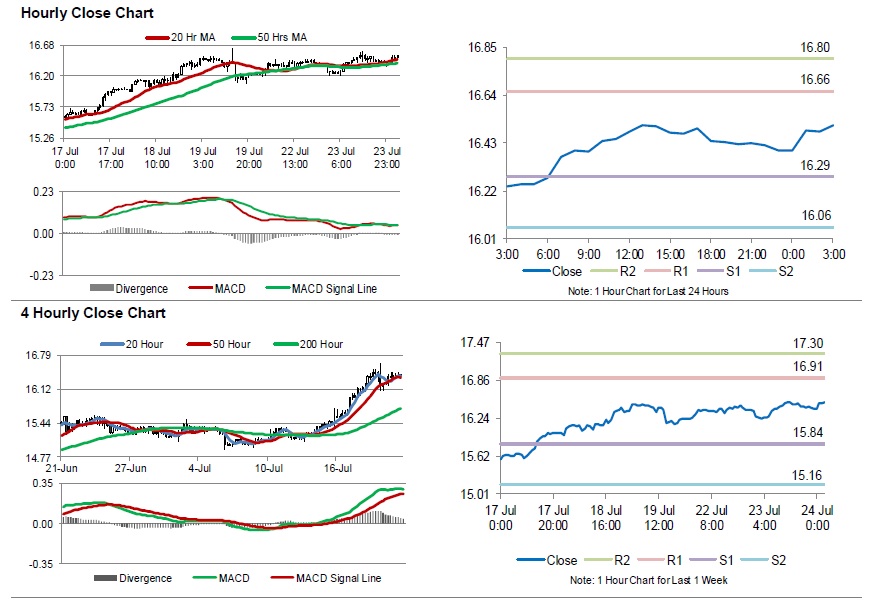
For the 24 hours to 23:00 GMT, Silver rose 0.15% against the USD and closed at USD16.40 per ounce.
In the Asian session, at GMT0300, the pair is trading at 16.51, with silver trading 0.67% higher against the USD from yesterday’s close.
The pair is expected to find support at 16.29, and a fall through could take it to the next support level of 16.06. The pair is expected to find its first resistance at 16.66, and a rise through could take it to the next resistance level of 16.80.
The white metal is showing convergence with its 20 Hr moving average and trading above its 50 Hr moving average.
Crude Oil: Oil Trading Lower, Ahead Of EIA’s Weekly Crude Oil Inventories Data
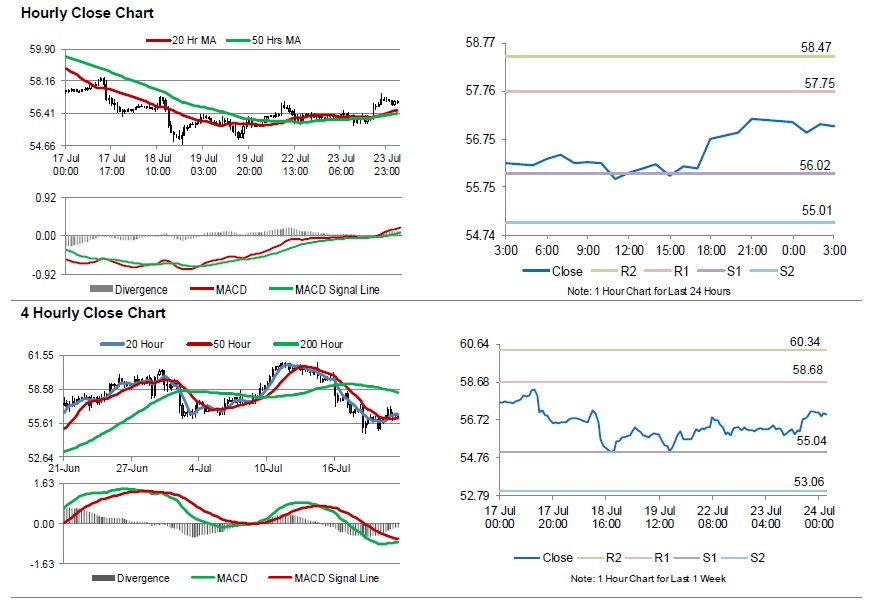
For the 24 hours to 23:00 GMT, Crude Oil rose 1.73% against the USD and closed at USD57.13 per barrel, after the American Petroleum Institute (API) reported that US crude oil inventories fell by 11.0 million barrels to 449 million barrels in the week ended 19 July 2019.
In the Asian session, at GMT0300, the pair is trading at 57.02, with oil trading 0.19% lower against the USD from yesterday's close.
The pair is expected to find support at 56.02, and a fall through could take it to the next support level of 55.01. The pair is expected to find its first resistance at 57.75, and a rise through could take it to the next resistance level of 58.47.
Crude oil is trading above its 20 Hr and 50 Hr moving averages.
Australia PMI composite dropped to 51.8, sharp fall in employment
Australia CBA PMI manufacturing dropped to 51.4 in July, down from 52.0. PMI services dropped to 51.9, down from 52.6. PMI composite dropped to 51.8, down from 52.5.
CBA noted that "Slower growth fed through to staffing levels, which decreased for the first time in three months." More importantly, employment decreased for the greatest extent since the survey began in May 2016. Reduction in jobs were centered of service sector.
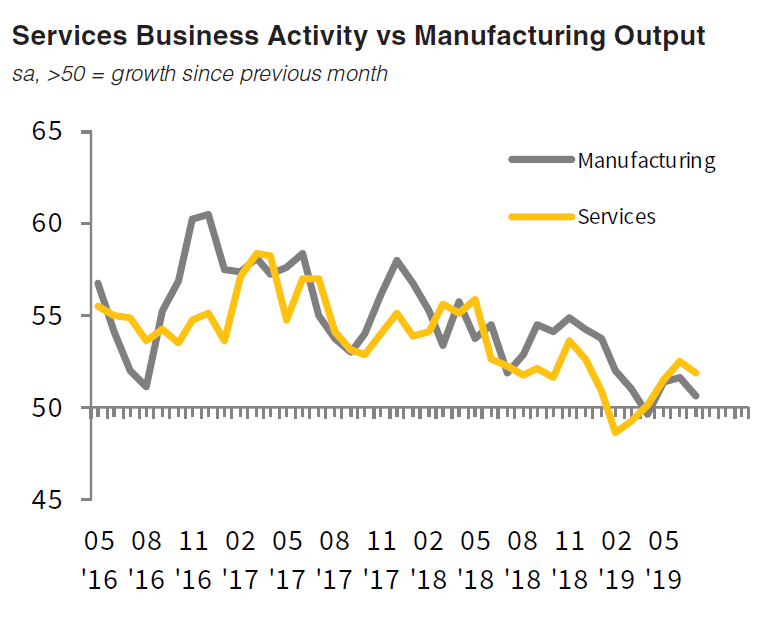
Commenting on the Commonwealth Bank Flash PMI data, CBA Senior Economist, Belinda Allen said:
"A slight retreat in growth momentum in business activity in July, although the index does sit comfortably above the critical 50 level that separates expansion and contraction".
"Overall the "flash" PMI does suggest business activity should continue to expand in Q3. A combination of monetary policy stimulus, tax rebates currently hitting household bank accounts and early signs of a recovery in the housing market should see the Australian economy stabilise, if not pick up over the 2H 2019. The sharp fall in employment intentions underlines the importance of the tax cuts now filtering into the economy and calls for more policy stimulus via infrastructure spending and microeconomic reform. Input costs continued to lift and is worth watching if businesses can pass it on, we could see some impact on consumer inflation over 2H 2019 and into 2020".
XAU/USD Bullish Break Makes Pullback To 78.6% Fibonacci
The current wave outlook is suggesting that the uptrend is not finished yet and a continuation of the bullish trend is likely to take place within a wave 3 (pink). The triangle chart pattern was most likely wave 4 (blue) consolidation and price has started a wave 5 (blue) breakout.
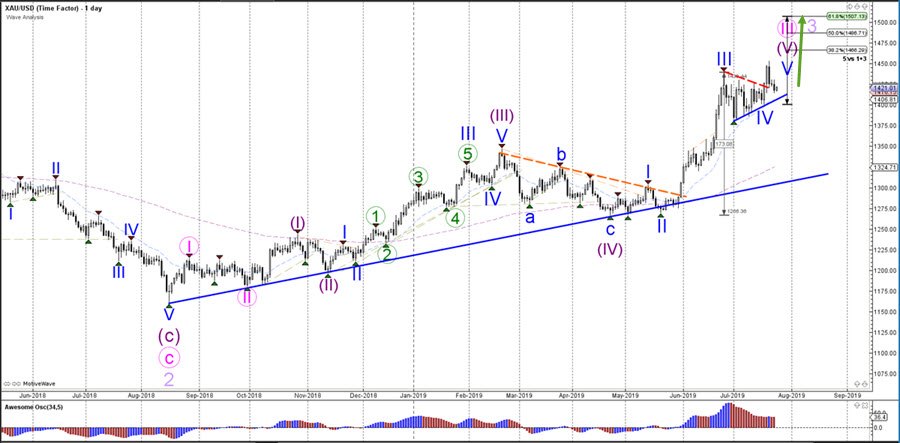
The XAU/USD could have made a bullish wave 1 (green) and the current pullback could be a deep wave 2 (green) retracement. This wave outlook remains valid as long as price stays above the 100% Fibonacci levels of wave 2 vs 1. A break above the resistance trend lines (red) could indicate the start of the wave 3 (green) and a move higher towards the Fibbonacci targets of wave 5 vs 1+3.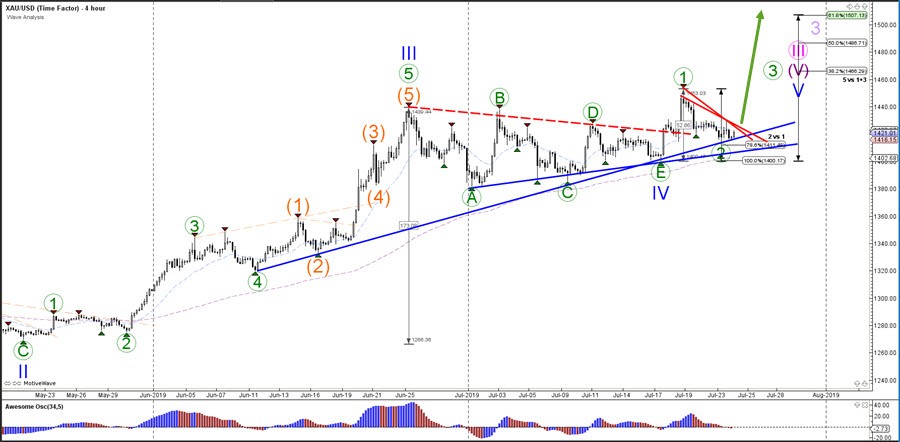
Pound Softens Further In Asia
Boris Johnson wins vote
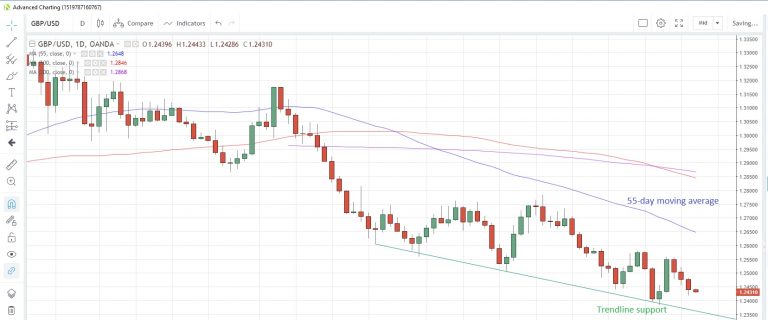
The pound traded lower from opening levels during the Asian morning, but failed to take out yesterday's one-week low in the aftermath of Boris Johnson winning the Tory Party leadership race by a large margin. Today could be the fourth consecutive down-day in a row for GBP/USD, the longest stretch since mid-June. The next possible technical support level could be found at the downward-sloping trendline drawn from the May 23 low, which is about 1.2363 today. GBP/USD is currently trading at 1.2430.
GBP/USD Daily Chart
UK gets a surprise growth upgrade
In its July World Economic Outlook, the IMF downgraded its global economic forecasts for this year and next by 0.1% from its April review. It now sees growth at 3.2% for 2019 and 3.5% for 2020. Downgrades were also made to China's growth estimates by 0.1% for each year, and are now at 6.2% for this year and 6.0% for 2020.
In contrast, the IMF upgraded its growth forecast for the UK to 1.3% from 1.2%. However, that estimate is based on an assumption of an orderly Brexit followed by a gradual transition to the new era. The Fund named a no-deal Brexit as one of the key risks to both UK and global growth.
Flash PMIs top the agenda
It's a day of flash PMI readings from Markit for July today, with most estimates suggesting a mild improvement from June. Germany's manufacturing PMI is expected to increase to 45.2 from 45.0 with the reading for the Euro-zone probably held steady at 47.6, according to the latest survey of economists.
In the US session, the Markit manufacturing PMI is seen rising to 51.0 from 50.6. Aside from the PMI, we see US new home sales for June, which are expected to rise 6.0% m/m, a strong rebound from May's 7.8% drop.
Daily Markets Broadcast
Wall Street higher as trade talks set to restart
US indices closed higher yesterday after it was confirmed that face-to-face negotiations between the US and China will take place on Monday. Boris Johnson is voted in as the new leader of the UK Tory Party and hence becomes the UK PM. The IMF downgraded global growth forecasts for this year and next by 0.1% from its April estimates. 2019 growth is seen at 3.2% and 2020 growth at 3.5%.
US30USD Daily Chart
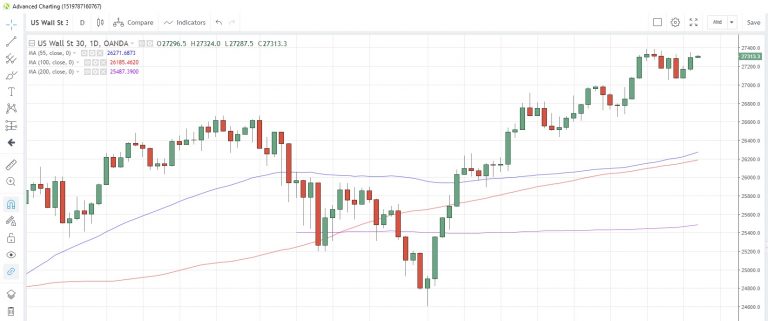
he US30 index rose for a second day yesterday, edging back toward record highs
The 100-day moving average at 26,185 and the 55-day average at 26,271 continue to track each other higher
The US Markit flash manufacturing PMI is seen improving to 51.0 in July from 50.6 in June.
DE30EUR Daily Chart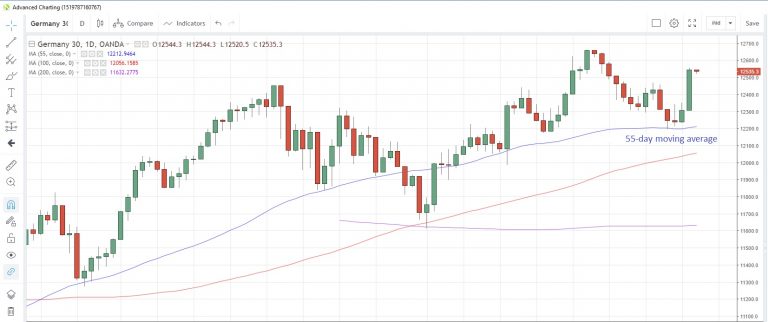
The Germany30 jumped the most in five weeks yesterday amid upbeat corporate earnings out of Europe and positive sentiment on Wall Street
The index has held above the 55-day moving average at 12,213, which has supported prices on a closing basis since June 3
Germany's July Markit flash manufacturing PMI is expected to show a small rise to 45.2 from 45.0 in June. The Euro-zone reading probably held steady at 47.6, according to the latest survey of economists.
CN50USD Daily Chart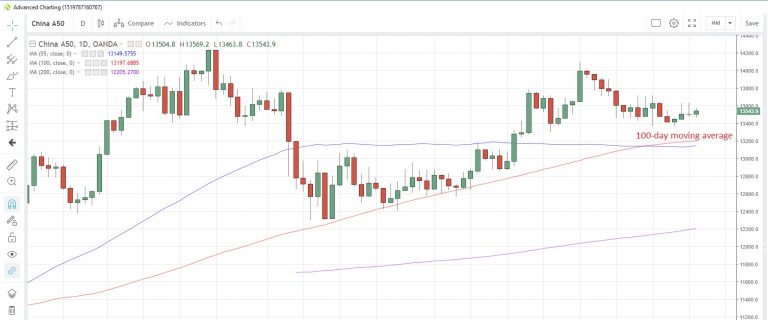
The China50 index advanced yesterday and could extend those gains into today's session following the higher close on Wall Street and the news that trade talks will be held on Monday
The index has traded above the 100-day moving average, which finished at 13,197 yesterday, since June 10
In its latest update, the IMF also downgraded China's growth forecast to 6.2% for this year and 6.0% for next. Both saw a reduction of 0.1%.
AUD/USD Likely To Remain Supported On Dips
Key Highlights
- The Aussie Dollar started a downside correction from 0.7080 against the US Dollar.
- AUD/USD is likely to find strong bids near 0.6970 or 0.6950 in the near term.
- The Housing Price Index in May 2019 increased 0.1% (MoM), less than the +0.3% forecast.
- The US Manufacturing PMI in July 2019 (Preliminary) could rise from 50.6 to 51.0.
AUDUSD Technical Analysis
This past week, the Aussie Dollar followed a solid bullish path above 0.7000 against the US Dollar. The AUD/USD pair traded as high as 0.7081 and recently started a downside correction.
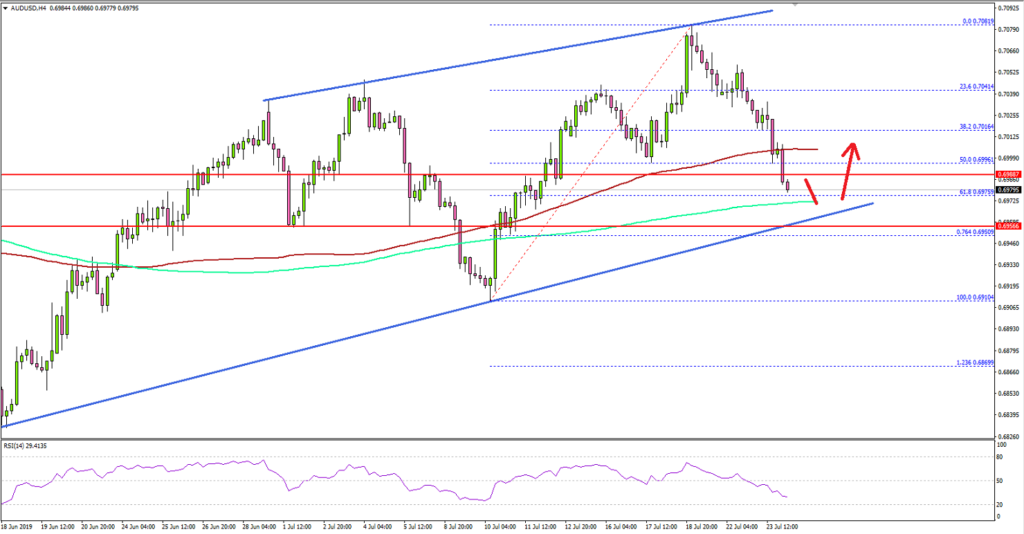
Looking at the 4-hours chart, the pair failed near 0.7080 and a connecting resistance trend line. As a result, there was a bearish reaction and the pair declined below the 0.7060 and 0.7040 support levels.
Moreover, the pair traded below the 50% Fib retracement level of the upward move from the 0.6910 low to 0.7081 high. On the downside, there are many key supports near the 0.6970, 0.6980 and 0.6960 levels.
The 61.8% Fib retracement level of the upward move from the 0.6910 low to 0.7081 high is likely to act as a strong support, followed by 0.6980. The main support is near 0.6950 and a connecting bullish trend line on the same chart.
If there is a downside break below 0.6950, the pair could continue to decline towards 0.6910 or 0.6900. Conversely, the pair might bounce back above 0.7040 and 0.7050.
Fundamentally, the US Housing Price Index for May 2019 was released by the Federal Housing Finance Agency. The market was looking for a 0.3% rise in the Housing Price Index.
However, the actual result was lower than the forecast, the HPI increased only 0.1% (less than the last increase of 0.4%). Looking at the yearly change, house prices were up 5% in May 2019.
The report added:
For the nine census divisions, seasonally adjusted monthly house price changes from April 2019 to May 2019 ranged from -1.0 percent in the East South Central division to +0.5 percent in the South Atlantic division.
The overall market sentiment favored the US Dollar, with strong bearish moves in EUR/USD and GBP/USD. However, AUD/USD might still bounce back unless it breaks the 0.6950 support.
Economic Releases to Watch Today
- Germany's Manufacturing PMI for July 2019 (Preliminary) – Forecast 45.2, versus 45.0 previous.
- Germany's Services PMI for July 2019 (Preliminary) – Forecast 55.3, versus 55.8 previous.
- Euro Zone Manufacturing PMI July 2019 (Preliminary) – Forecast 47.6, versus 47.6 previous.
- Euro Zone Services PMI for July 2019 (Preliminary) – Forecast 53.3, versus 53.6 previous.
- US Manufacturing PMI for July 2019 (Preliminary) – Forecast 51.0, versus 50.6 previous.
- US Services PMI for July 2019 (Preliminary) – Forecast 51.7, versus 51.5 previous.
Brexit Update – New PM, Old Challenge
UK’s new Prime Minister Boris Johnson has about 3 months to deliver Brexit. With the EU reiterating refusal to amend the Withdrawal Agreement (the deal), Johnson should face the same challenge as his predecessor, Theresa May. We continue to expect Brexit with a deal, as the composition of the parliament has not changed, despite the change of the PM. As the majority still seeks to avert leaving the EU with no deal, they might do so via pushing a general election. Meanwhile, those in the Brexit camp might opt to accept a tweaked deal in order to ensure Brexit could materialize. Nonetheless, Johnson’s hardliner rhetoric has inevitably increased the chance of a no deal Brexit.
Although Johnson has suggested that the country should “prepare robustly” for a no deal Brexit, the majority in the Parliament would still seek to avoid this from happening. Chancellor Philip Hammond threatened that he would resign if Johnson becomes the PM, in opposition to his no deal Brexit approach. The parliament could trigger a general election by passing a “no confidence” motion. Yet, Johnson might try to prevent an election from happening before Brexit. A YouGov poll shows that around 51% of Conservative voters at the 2017 election would vote for Conservatives at an election, IF Brexit is completed by then. Indeed, the support has dropped sharply from the last election, although support for Labors is even worse. The poll suggests that less than half of 2017 Labour voters said they would vote for the party again in a post-Brexit election.
How Johnson can prevent an early election from happening is to avoid a no deal Brexit. The question then returns to how to make a deal. The stickiest point of the deal is Irish border backstop solution. The EU has ruled out removing, and setting a time limit to, Irish backstop. However, these are deemed unacceptable to many in the parliament. On the contrary, the EU might agree to revise the non-binding political declaration or extend the transition period until a new Irish border solution is found. We expect, as time passes, some of the MPs would eventually surrender and accept some tweaks in the deal. All is driven by political calculations. If they don’t support a revised deal, opposition MPs could urge to an election to avert ‘no deal’. This could make the Brexiteers accept a tweaked deal. This indeed happened in the third meaningful vote taken place on March 29. Although the deal was rejected, 286 out of 634 MPs voted for the motion, compared with 202 and 242 in the first and second meaningful votes respectively. Note that Johnson was one of those who voted for May’s deal in the third meaningful vote.
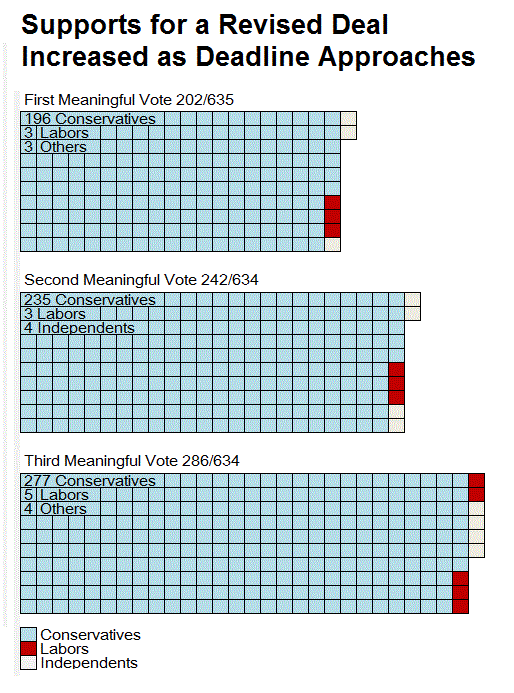
Leaving the EU with a deal remains our base scenario. As the majority of the parliament still seeks to avert leaving the EU with no deal, they might do so via pushing a general election. Meanwhile, those in the Brexit camp might be “forced” to accept a revised deal (though not ideal to them) in order to secure Brexit. Yet, even in the case of Brexit with a deal, further extension of Article 50 beyond October 31 is needed in order to get the bill passed in both Houses of the Parliament. Nonetheless, Johnson’s hardliner rhetoric has inevitably increased the chance of a no deal Brexit.
| Key Dates | |
| Jul 23 | Boris Johnson elected as new PM |
| Jul 25 | Parliament recess begins |
| Sep 3 | Parliament returns |
| Sep 14 | Lib Dem conference |
| Sep 21 | Labors conference |
| Sep 29 | Conservatives conference |
| Oct 2 | PM's speech to Conservatives |
| Oct 17-18 | EU Council meeting |
| Oct 31 | Brexit deadline |