Sample Category Title
UK Parliament Confirms Johnson As The Next PM
The UK's Conservative party's leadership race concluded with the appointment of Boris Johnson. Johnson will replace the outgoing prime minister, Theresa May who resigned after failed attempts to deliver Brexit. The markets were widely expecting Johnson to win the race. Elsewhere, BoE's Andy Haldane, in comments said that the MPC will not be pushing for a rate hike when it meets next week.
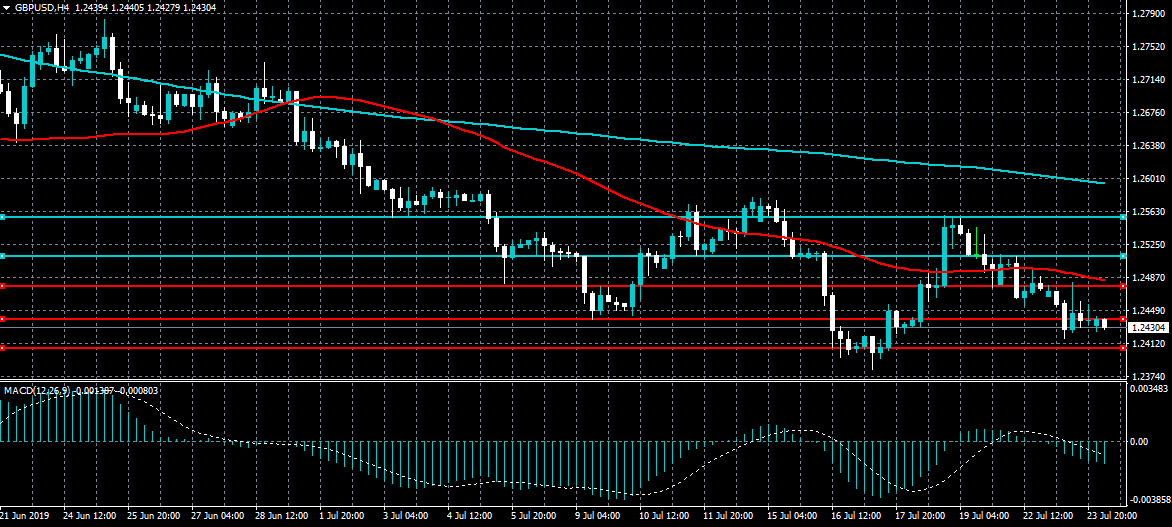
Will the GBPUSD Rebound off the Two-Year Lows?
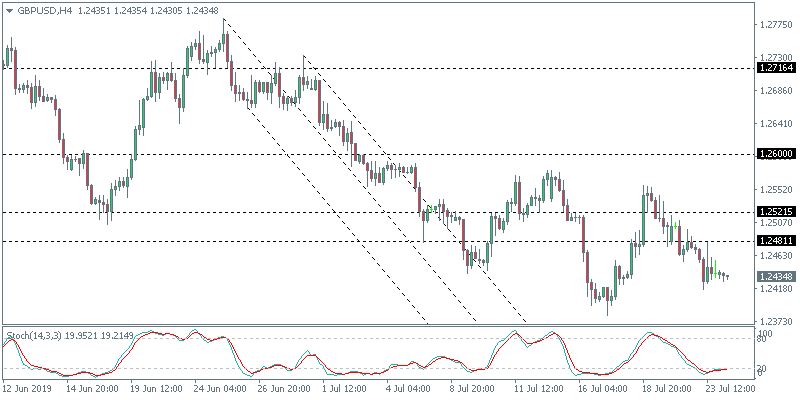
The pound sterling is trading near a two-year low for the most part since last week. The currency pair initially bounced off the lows with price action in the past few sessions showing a strong consolidation. The resistance area of 1.2481 remains key. A close above this level could signal some kind of a bullish bias.
USD/CHF Daily Outlook
Daily Pivots: (S1) 0.9826; (P) 0.9843; (R1) 0.9870; More...
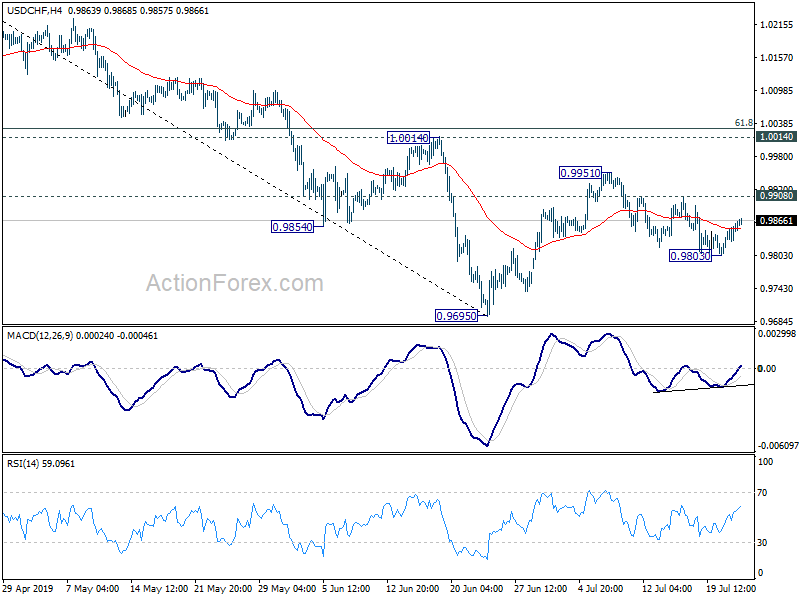
Outlook in USD/CHF remains neutral and intraday bias stays neutral. Further decline is in favor with 0.9908 resistance intact. Below 0.9803 will extend the fall from 0.9951 to retest 0.9695 low. On the upside, break of 0.9908 resistance would resume the rebound from 0.9695, through 0.9951, to 1.0014 resistance.
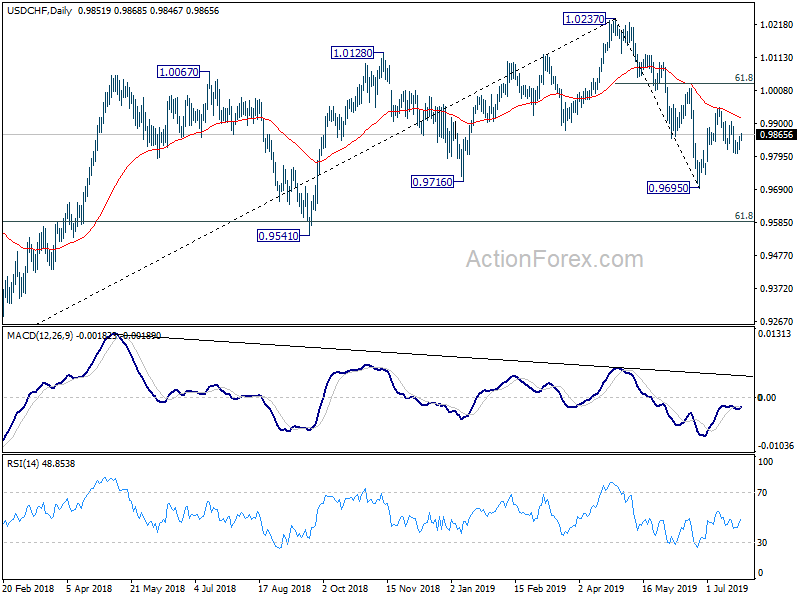
In the bigger picture, up trend from 0.9186 (2018 low) should have completed at 1.0237 already. Deeper decline would be seen to 61.8% retracement of 0.9186 to 1.0237 at 0.9587 and below. For now, USD/CHF is seen as in long term range pattern between 0.9186 and 1.0342. Hence, we'd pay attention to bottoming signal below 0.9587. However, sustained break of 1.0014 will revive medium term bullishness and turn focus back to 1.0237 high.
Euro Slips To A Two-Month Low
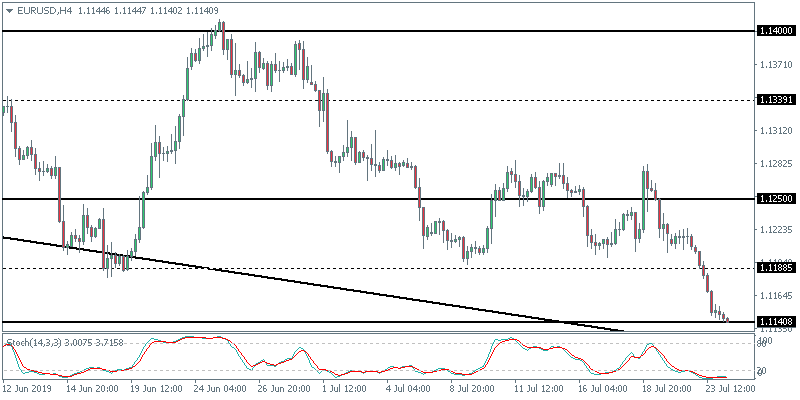
The common currency extended declines, falling to a two-month low at 1.1140. The Eurozone consumer confidence data showed that the index registered -6.6 in July from -7.2 in June. This was slightly better than the forecasts. The flash manufacturing and services PMI reports are due to come out later today.
Can EURUSD Hold the Declines?
The decline to 1.1140 level came following the breakout from the minor support level at 1.1250. The Stochastics Oscillator is currently oversold and could indicate that the declines are overdone. As a result, there is scope for the currency pair to rebound. However, the gains are likely to be limited to the 1.1250 level which could act as resistance.
USD/JPY Daily Outlook
Daily Pivots: (S1) 107.94; (P) 108.11; (R1) 108.40; More...
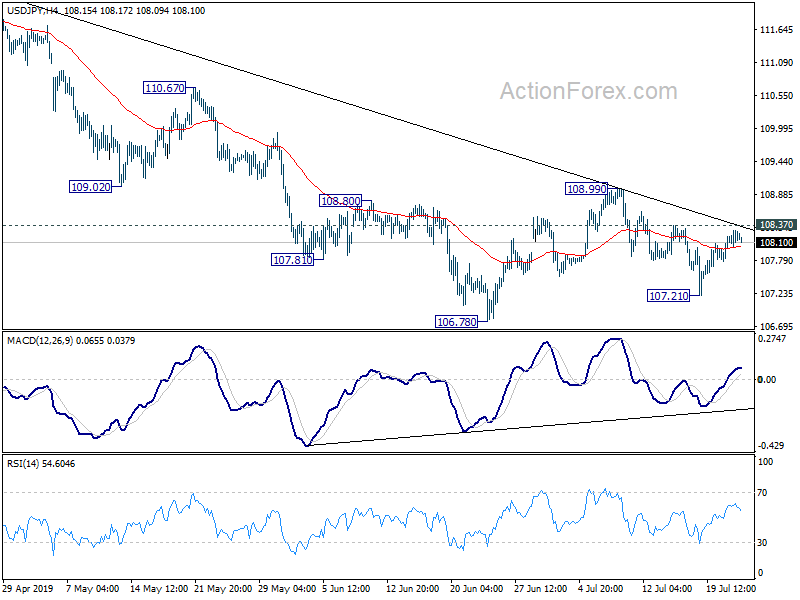
Intraday bias in USD/JPY remains neutral at this point. On the upside, break of 108.37 will extend the rebound from 106.78 with another rise, possibly through 108.99 resistance. On the downside, break of 107.21 will resume the fall from 108.99 to 106.78 low. Decisive break there will resume whole decline from 112.40.
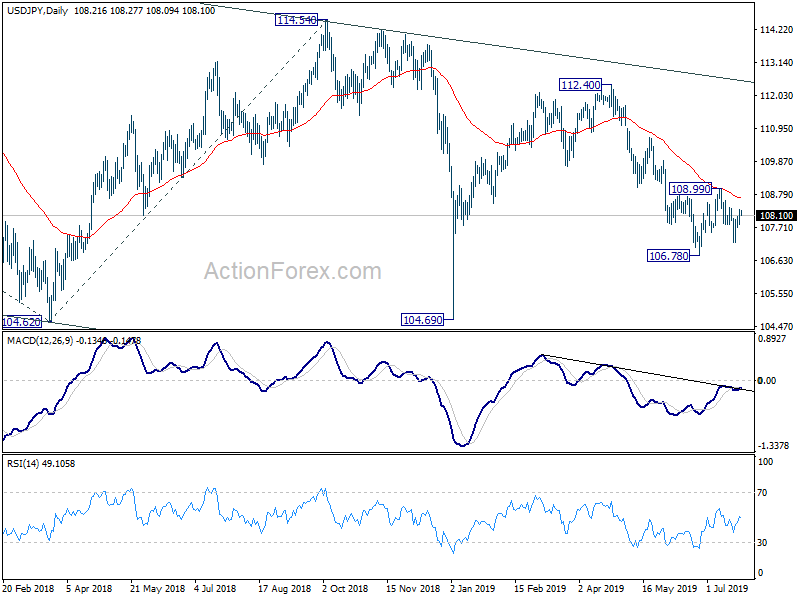
In the bigger picture, decline from 118.65 (Dec 2016) is still in progress, with the pair staying inside long term falling channel. Break of 104.62 will target 100% projection of 118.65 to 104.62 from 114.54 at 100.51. For now, we'd expect strong support above 98.97 (2016 low) to contain downside to bring rebound. In any case, break of 112.40 is needed to the first serious sign of medium term bullishness. Otherwise, further decline will remain in favor in case of rebound.
Silver Elliott Wave View: Impulse Move Favoring More Upside
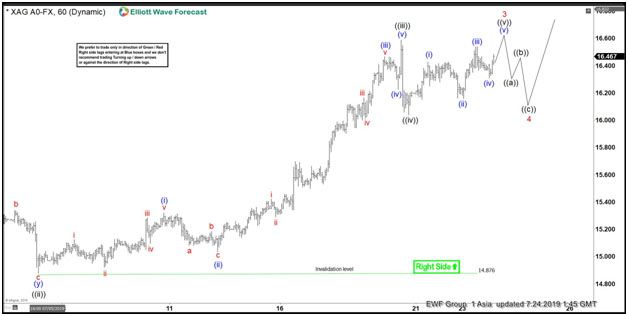
Silver rally from May 28, 2019 low is unfolding as an impulse Elliott wave structure favoring more upside to take place. The near-term pullback to $14.87 low ended wave ((ii)). Up from there, the metal made a strong rally to the upside and ended wave ((iii)) at $16.58 high. The internals of that rally unfolded in lesser degree 5 waves structure where wave (i) ended at $15.31 high. Wave (ii) pullback ended at $15.03 low, wave (iii) ended at $16.46 high. Then pullback to $16.22 low ended wave (iv) and a rally to $16.58 high ended wave (v).
Down from there, the 3 swings pullback to $16.04 low ended wave ((iv)). While above there, wave ((v)) remain in progress looking to extend higher 1 more time before wave 3 ends & pullback in wave 4 takes place in 3, 7 or 11 swings. The minimum extension area for wave ((v)) of 3 i.e inverse 1.236%-1.618% extension area comes at $16.72-$16.93. From where the metal can potentially see a pullback in 3, 7 or 11 swings before more upside can be seen. We don’t like selling the stock & expect intraday buyers to appear in 3, 7 or 11 swings within wave 4 pullback at a later stage. As far as a pivot from $14.87 low stays intact.
Silver 1 Hour Elliott Wave Chart
USD/CAD Daily Outlook
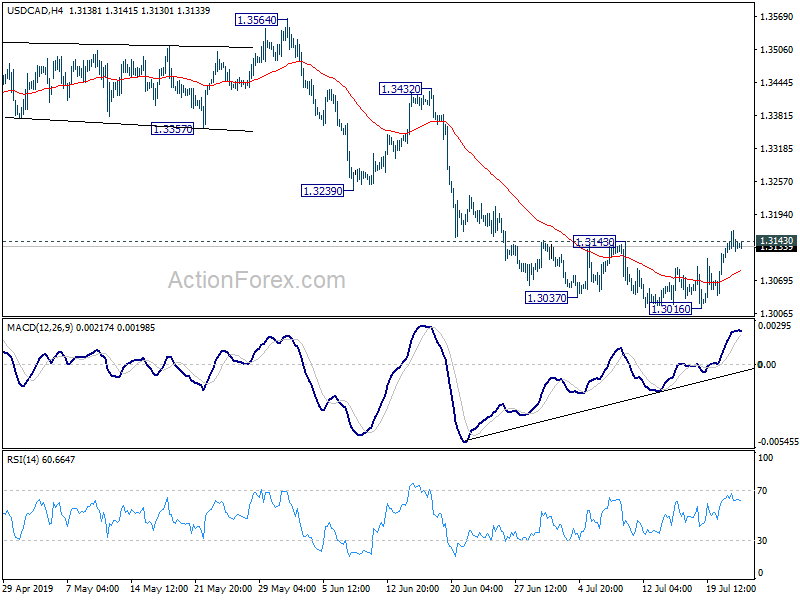
Daily Pivots: (S1) 1.3113; (P) 1.3139; (R1) 1.3161; More....
Prior break of 1.3143 resistance indicates short term bottoming at 1.3016, after drawing support from 1.3052/68 cluster support. Intraday bias remains on the upside for stronger rebound to 55 day EMA (now at 1.3215). For now, further rise will remain in favor in the near term as long as 1.3016 support holds, in case of retreat.
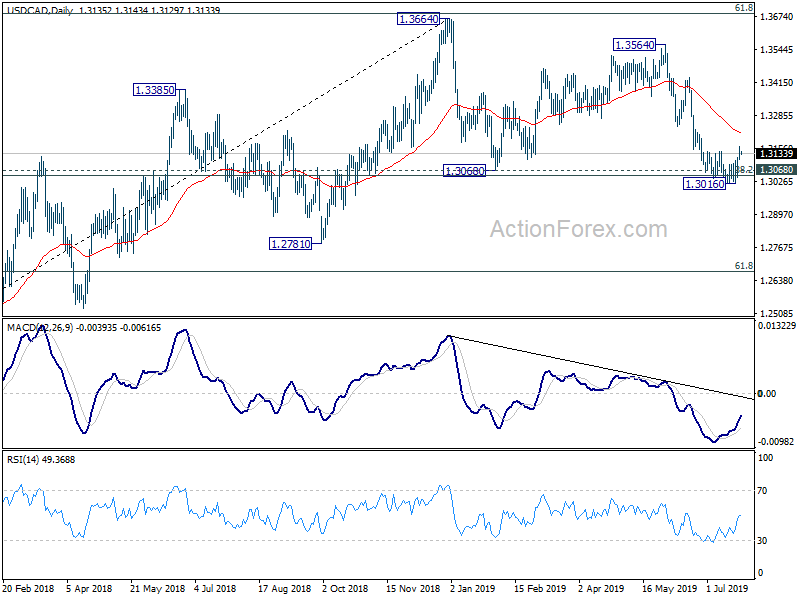
In the bigger picture, decisive break of 1.3068 cluster support (38.2% retracement of 1.2061 to 1.3664 at 1.3052) will confirm completion of up trend from 1.2061 (2017 low). Further fall should be seen to 61.8% retracement at 1.2673 next. On the upside, sustained break of 61.8% retracement of 1.4689 (2016 high) to 1.2061 at 1.3685, is needed to confirm resumption of up trend from 1.2061 (2017 low). Otherwise, risk will stay on the downside.
LTCUSD In Trouble Below $90.00
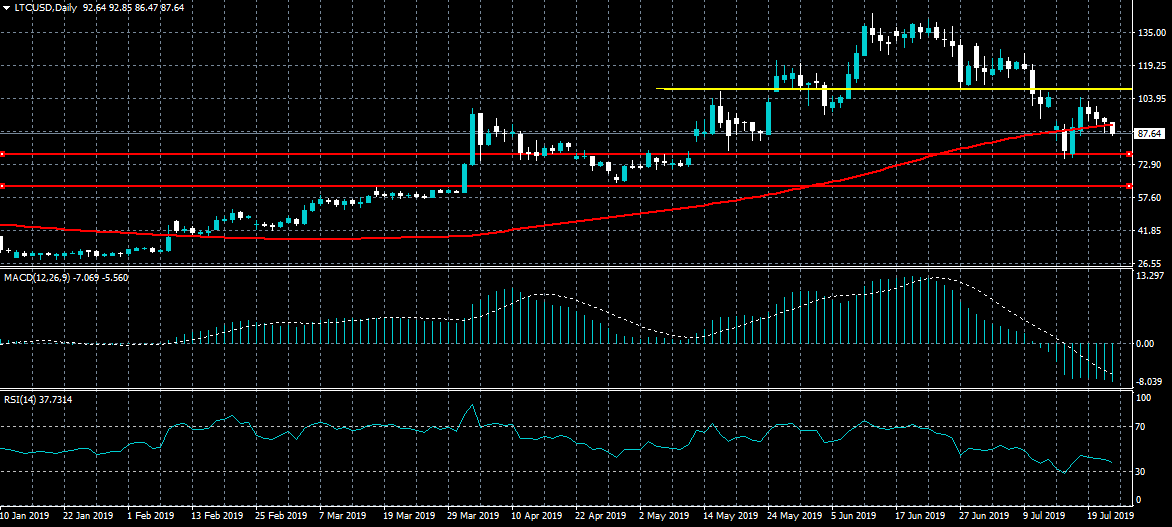
Litecoin is once again trading below the $90.00 level after the cryptocurrency suffered a strong technical rejection from the $104.50 region. The $75.00 level may start to come back in focus if bulls struggle to contain the LTCUSD pair above the pivotal $90.00 level. The head and shoulders pattern on the four-hour time frame is also still predicting a deeper drop towards the $60.00 level.
The LTCUSD pair is only bullish while trading above the $90.00 level, key resistance is found at the $105.00 and $120.00 levels.
If the LTCUSD pair trades below the $90.00 level, key support is found at the $75.00 and $60.00 levels.
EURUSD PMI Data In Focus
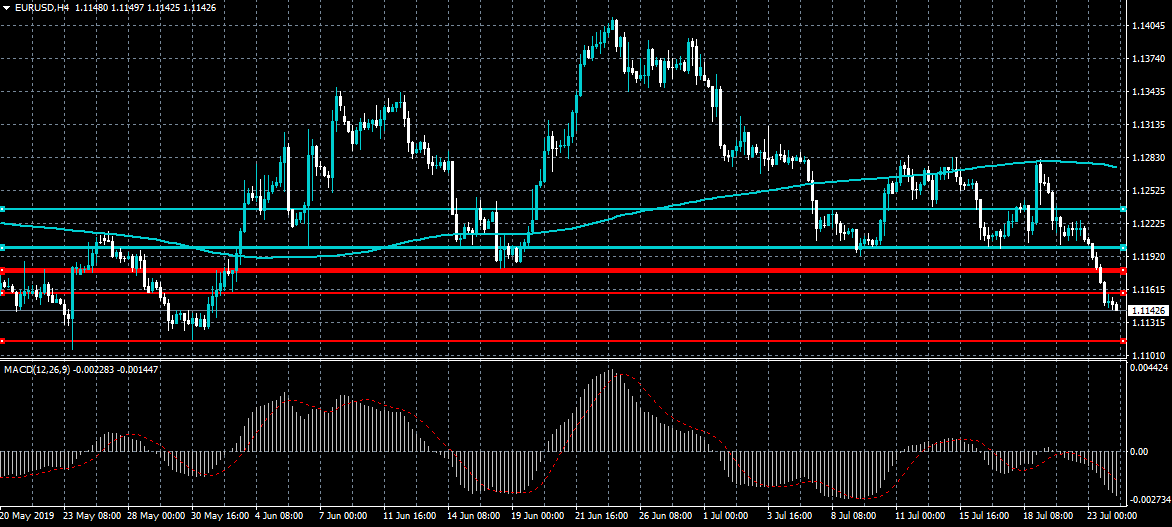
The euro currency has turned heavily bearish over the medium-term against the US dollar after breaking through the 1.1160 support level on Tuesday. Continued weakness below the 1.1160 level may prompt a test of the 1.1110 support level during today’s European trading session. Market participants are now waiting for the release of PMI Manufacturing data from the eurozone.
The EURUSD pair is heavily bearish while trading below the 1.1160 level, key support is found at the 1.1110 and 1.1050 levels.
If the EURUSD pair trades above the 1.1160 level, bulls could test back towards the 1.1180 and 1.1200 levels.
GBPUSD Still On The Ropes
The British pound remains under downside pressure against the US dollar after bears broke through the 1.2440 support zone on Tuesday. The current monthly and yearly low is the key level that GBPUSD sellers need to soon break, or short-term sellers may start to lose patience. The 1.2480 level is the immediate upside barrier that bulls need to break in order to encourage another test of the 1.2510 level.
The GBPUSD pair is only bullish while trading above the 1.2480 level, key resistance is located at the 1.2510 and 1.2530 levels.
If the GBPUSD pair holds below the 1.2480 level, key support is found at the 1.2380 and 1.2350 levels.
Kiwi Declines Sharply After Weak Trade Data
The Euro declined to a two-month low as investors await the European Central Bank’s (ECB) decision tomorrow. While the bank is expected to leave rates unchanged, investors will want to know the planned timeline of a rate hike. In recent statements, ECB officials like Mario Draghi have signaled that a rate hike will be delayed until the first half of the year. Officials have also signaled that the quantitative easing that ended last December could be restarted. Today, investors will receive the PMI data from the region. In Germany, the manufacturing PMI is expected to rise slightly from 45.0 to 45.1.
The New Zealand dollar declined today after the country released weak trade numbers. In June, the country exported goods worth more than N$5.01 billion, which was lower than the previous N$5.74 billion. Investors were expecting the exports to be at $5.29 billion. During the month, the country exported goods worth more than $4.65 billion, which was lower than the previous $5.57 billion. As a result of increased exports rather than imports, the trade surplus increased to more than $365 million.
In the United States, the earnings season will continue. This is after hundreds of companies like Chipotle Mexican Grill and Snap reported better-than-expected earnings. Today, companies like Boeing, Caterpillar, Dassault, Facebook, Wix, and Northrup Grumman will report. Meanwhile, investors will receive the manufacturing PMI and home sales from the US. The Markit PMI data for the month of July is expected to rise slightly to 50.9 from the previous 50.8. New home sales for June are expected to rise by 659k.
EUR/USD
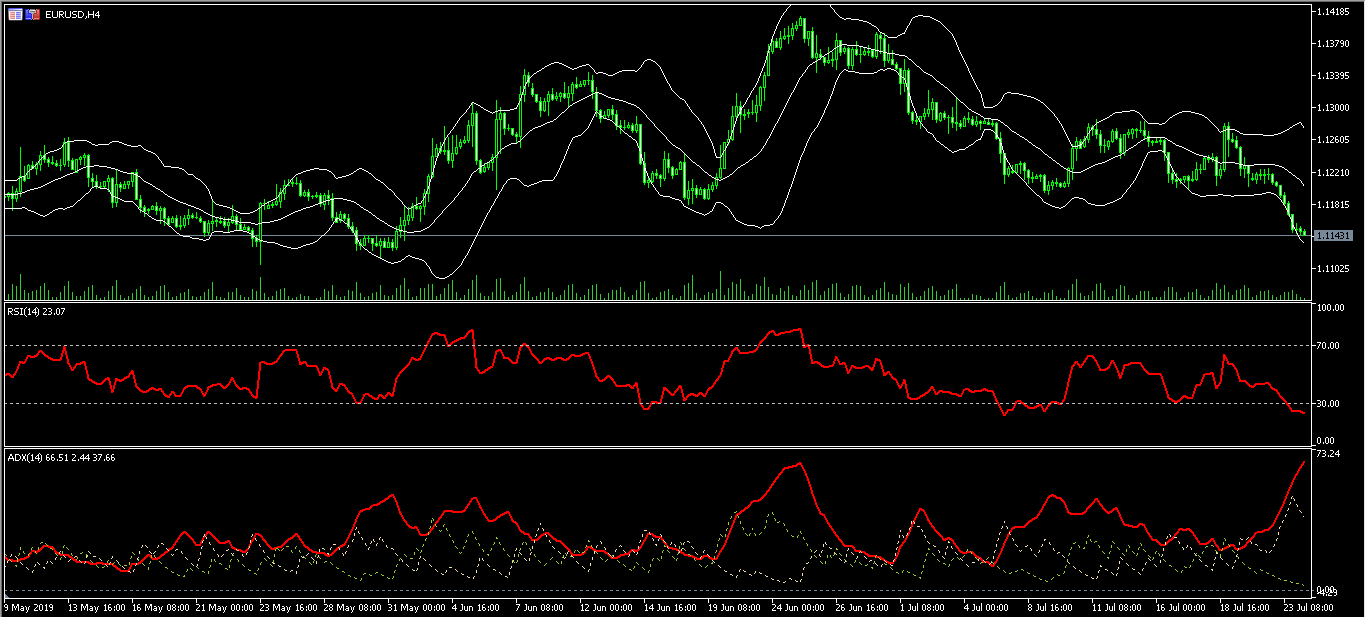
The EUR/USD pair declined to a low of 1.1140, which was the lowest level in two months. The current price is along the lower line of the Bollinger Bands and below the 25-day and 14-day moving averages. The RSI has moved to the oversold level of 23 while the ADX indicator has moved to the extreme level of 66. The pair will likely continue moving lower to test the important support of 1.1100.
NZD/USD
The NZD/USD pair declined after the weak import and export data. It is now trading at 0.6690, which is below the 14-day and 28-day moving averages. The price is along the lower line of the Bollinger Bands. The RSI has moved close to the oversold level of 30. The pair will likely continue moving lower to test the important support of 0.6670, which is the 61.8% Fibonacci Retracement level.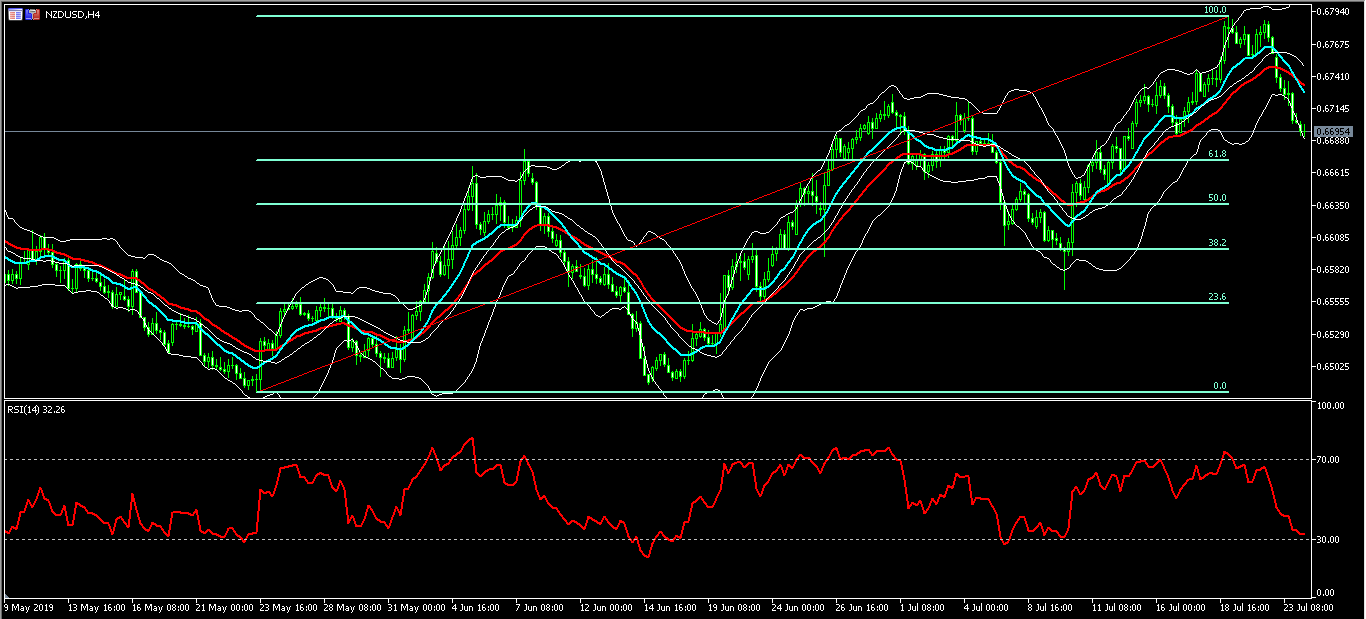
GBP/USD
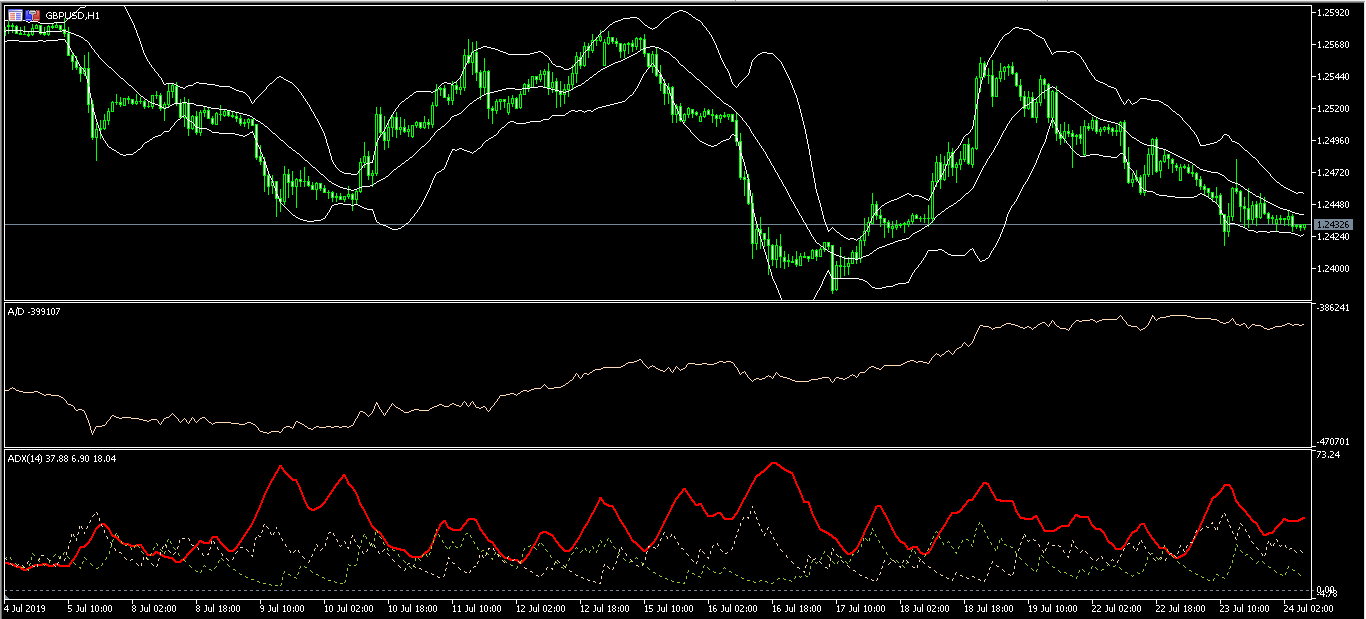
The GBP/USD pair declined to a low of 1.2430, a day after Boris Johnson won the vote to become the next UK Prime Minister. On the hourly chart, the price is between the lower and middle moving averages. The accumulation/distribution continued the upward momentum while the average directional index has remained unchanged. The pair will move in either direction as Boris Johnson sets his agenda.