Sample Category Title
AUDUSD Extends Downside Below 20-day SMA
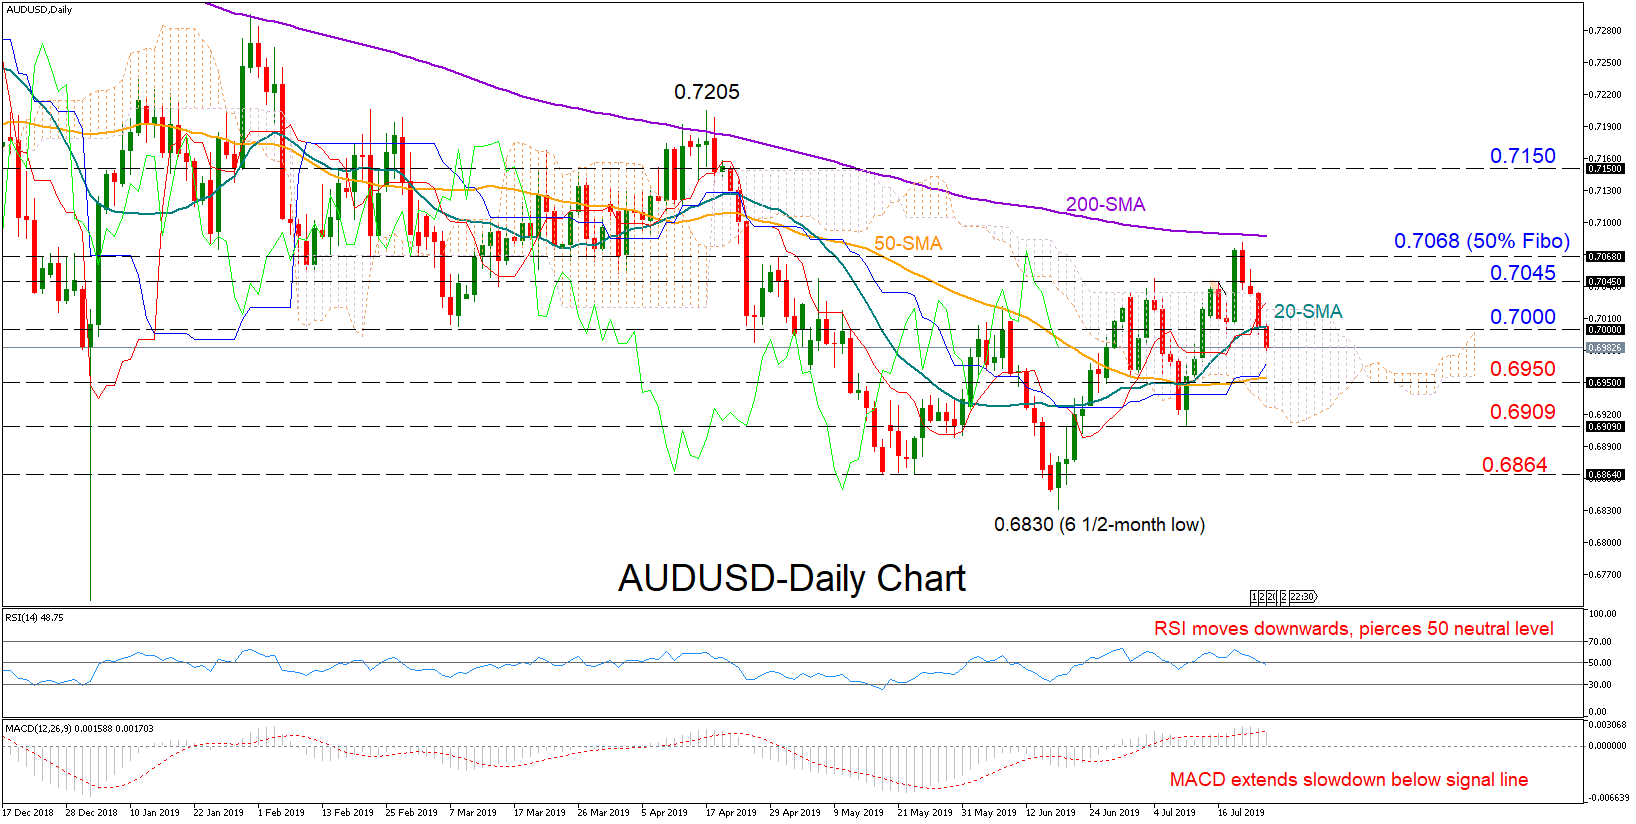
AUDUSD drifted lower after hitting a three-month high of 0.7081, slightly above the 50% Fibonacci level of the steep downleg from 0.7392 to 0.6745.
The bearish move has driven the price back into the Ichimoku cloud and below the 20-day simple moving average (SMA), increasing speculation that the softness may stay in place in the short-term. Meanwhile in momentum indicators, the signals are neutral-to-negative as the RSI is exiting the bullish territory, while the MACD seems to be losing ground below its red signal line.
The 50-day SMA currently around 0.6950 is likely to be the next target if the market extends the slowdown, but the area around 0.6909 should be a bigger challenge since any close lower would fade hopes over an up-trending market. Further down, the bears would have to forcefully beat the 0.6864 barrier to confirm additional losses ahead.
Should the price bounce above the 20-day SMA and the 0.7000 round level, immediate resistance could be detected within the 0.7045-0.7068 area. Traders, however, would be eagerly looking for a rally above the 200-day SMA (0.7087), a move that could elevate the price towards the 0.7150 number.
In the medium-term timeframe, AUDUSD is in consolidation within the 0.7200-0.6830 boundaries. The flattening 50- and 200-day SMAs provide little hope for an outlook reversal.
In brief, the short-term bias for AUDUSD is viewed as neutral-to-bearish, while the medium-term outlook continues to hold neutral.
USD/CHF Trend Changed To Bullish
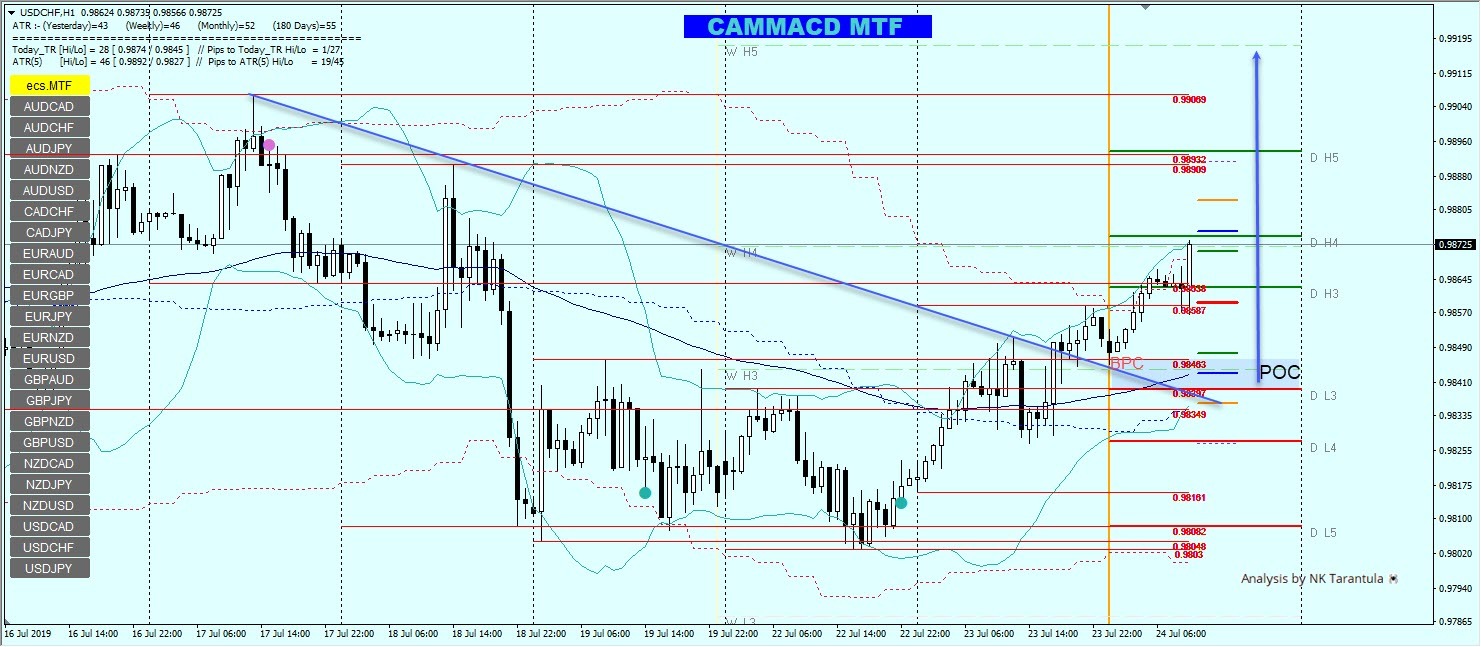
After the break of a descending trendline and a BPC pattern we see a continuation of the trend. POC zone could provide fresh buyers.
0.9840-50 is the zone where we might see another bounce. Above D H4 0.9875 we should see a continuation towards 0.9892, 0.9906 and 0.9918 as the weekly target. Only below 0.9800, the trend on the pair will return to bearish. At this point the negative correlation is again completely restored between EUR/USD and USD/CHF. Watch for fresh buying within the POC zone.
The Analytical Overview Of The Main Currency Pairs
The EUR/USD currency pair
Technical indicators of the currency pair:
Prev Open: 1.12087
Open: 1.11515
% chg. over the last day: -0.53
Day's range: 1.11410 – 1.11554
52 wk range: 1.1111 – 1.2009
The EUR/USD currency pair continues to show negative dynamics. During yesterday's and today's trading, the drop in quotes exceeded 65 points. The trading instrument reached two-month lows. EUR remains under pressure due to rising expectations that the ECB may announce the introduction of additional stimulus measures in the near future. The meeting of the Central Bank will be held on Thursday, July 25. Today, investors will be evaluating important economic releases from the eurozone and the US. Quotes EUR/USD can decline further. We recommend to open positions from key levels.
The Economic News Feed for 24.07.2019:
a number of indicators on business activity in Germany and the EU - 10:30 (GMT + 3:00) and 11:00 (GMT + 3:00);
primary real estate sales in the US - 17:00 (GMT + 3:00).
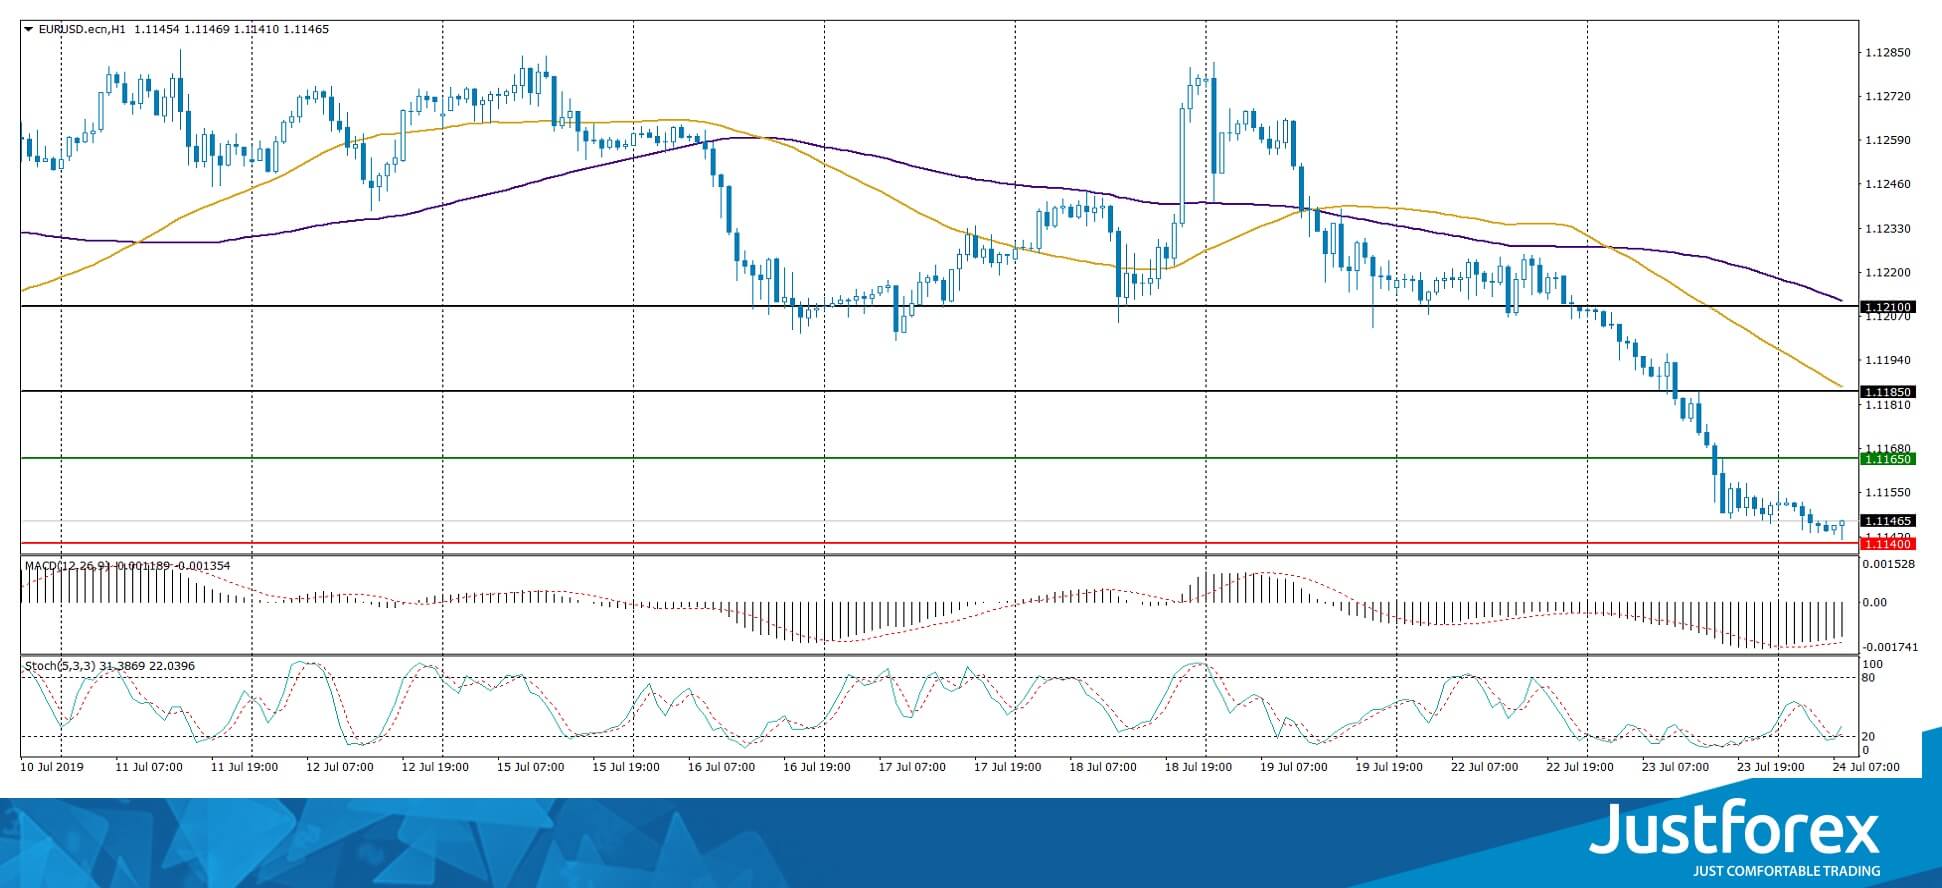
Indicators signal the strength of sellers: the price has fixed below 50 MA and 100 MA.
The MACD histogram is in the negative zone, but above the signal line, which gives a weak signal to sell EUR/USD.
The Stochastic Oscillator started to go out of the oversold zone, the %K line is above the %D line, indicating a technical correction of the EUR/USD currency pair.
Trading recommendations
Support levels: 1.11400, 1.11000
Resistance levels: 1.11650, 1.11850, 1.12100
If the price consolidates below 1.11400, the price will fall toward 1.11000.
Alternatively, the quotes can correct toward 1.11800-1.12000.
The GBP/USD currency pair
Technical indicators of the currency pair:
Prev Open: 1.24673
Open: 1.24370
% chg. over the last day: -0.30
Day's range: 1.24283 - 1.24497
52 wk range: 1.2397 - 1.3385
The technical picture on the GBP/USD currency pair is still ambiguous. The pound is trading in a flat. Currently, local support and resistance levels are: 1.24200 and 1.24550, respectively. Sterling remains under pressure due to uncertainty around Brexit. Boris Johnson will be the 77th prime minister of Great Britain. Earlier, the official repeatedly stated that Britain would withdraw from the block before October 31, even under the conditions of “tough” Brexit. Positions must be opened from key levels.
Today we recommend to pay attention to economic reports from the USA.
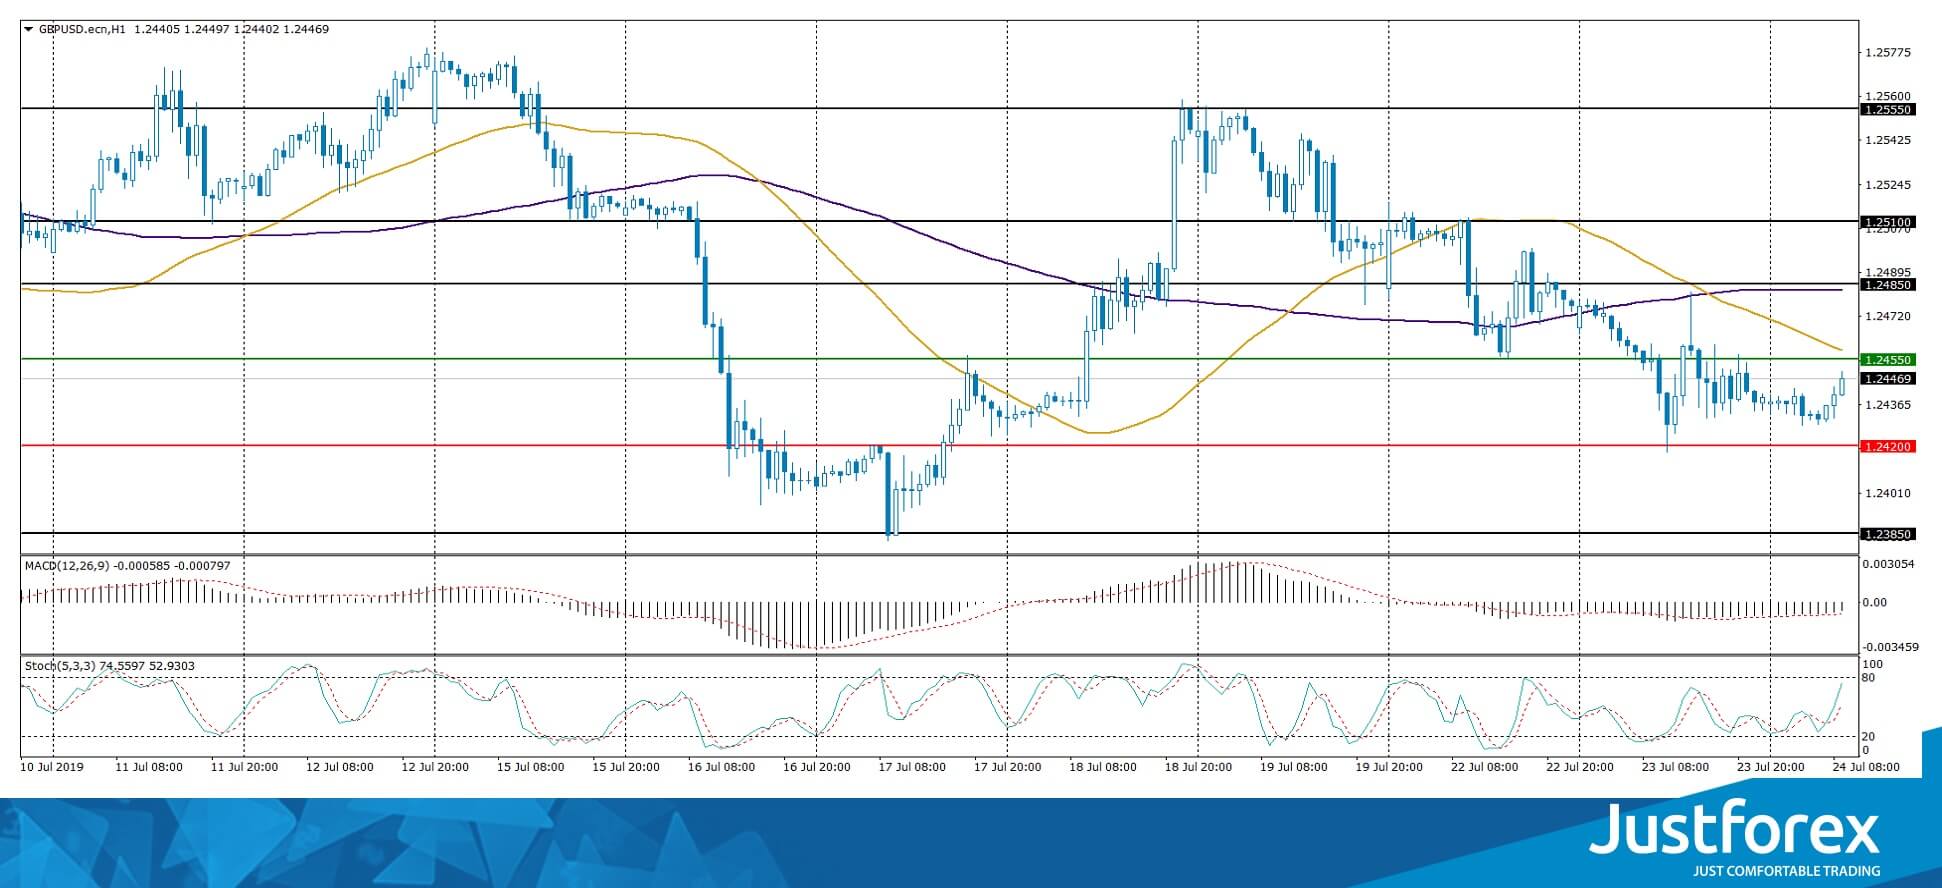
Indicators do not give accurate signals: the price is consolidated near 50 MA and 100 MA.
The MACD histogram is in the negative zone, but above the signal line, which gives a weak signal to sell GBP/USD.
The Stochastic Oscillator is in the neutral zone, the %K line is above the %D line, which indicates bullish moods.
Trading recommendations
Support levels: 1.24200, 1.23850
Resistance levels: 1.24550, 1.24850, 1.25100
If the price consolidates below 1.24200, the price will fall toward 1.23850-1.23600.
Alternatively, the quotes can grow toward 1.24850-1.25000.
The USD/CAD currency pair
Technical indicators of the currency pair:
Prev Open: 1.31179
Open: 1.31307
% chg. over the last day: +0.16
Day's range: 1.31307 - 1.31433
52 wk range: 1.2727 - 1.3664
The USD/CAD currency pair has stabilized after a sharp rally since the beginning of this week. At the moment, CAD is consolidating. Local levels of support and resistance are 1.31200 and 1.31450, respectively. In the near future technical correction is not excluded. Investors expect statistics from the United States. We also recommend to pay attention to the dynamics of oil prices. Positions must be opened from key levels.
The Economic News Feed for 24.07.2019 is calm.
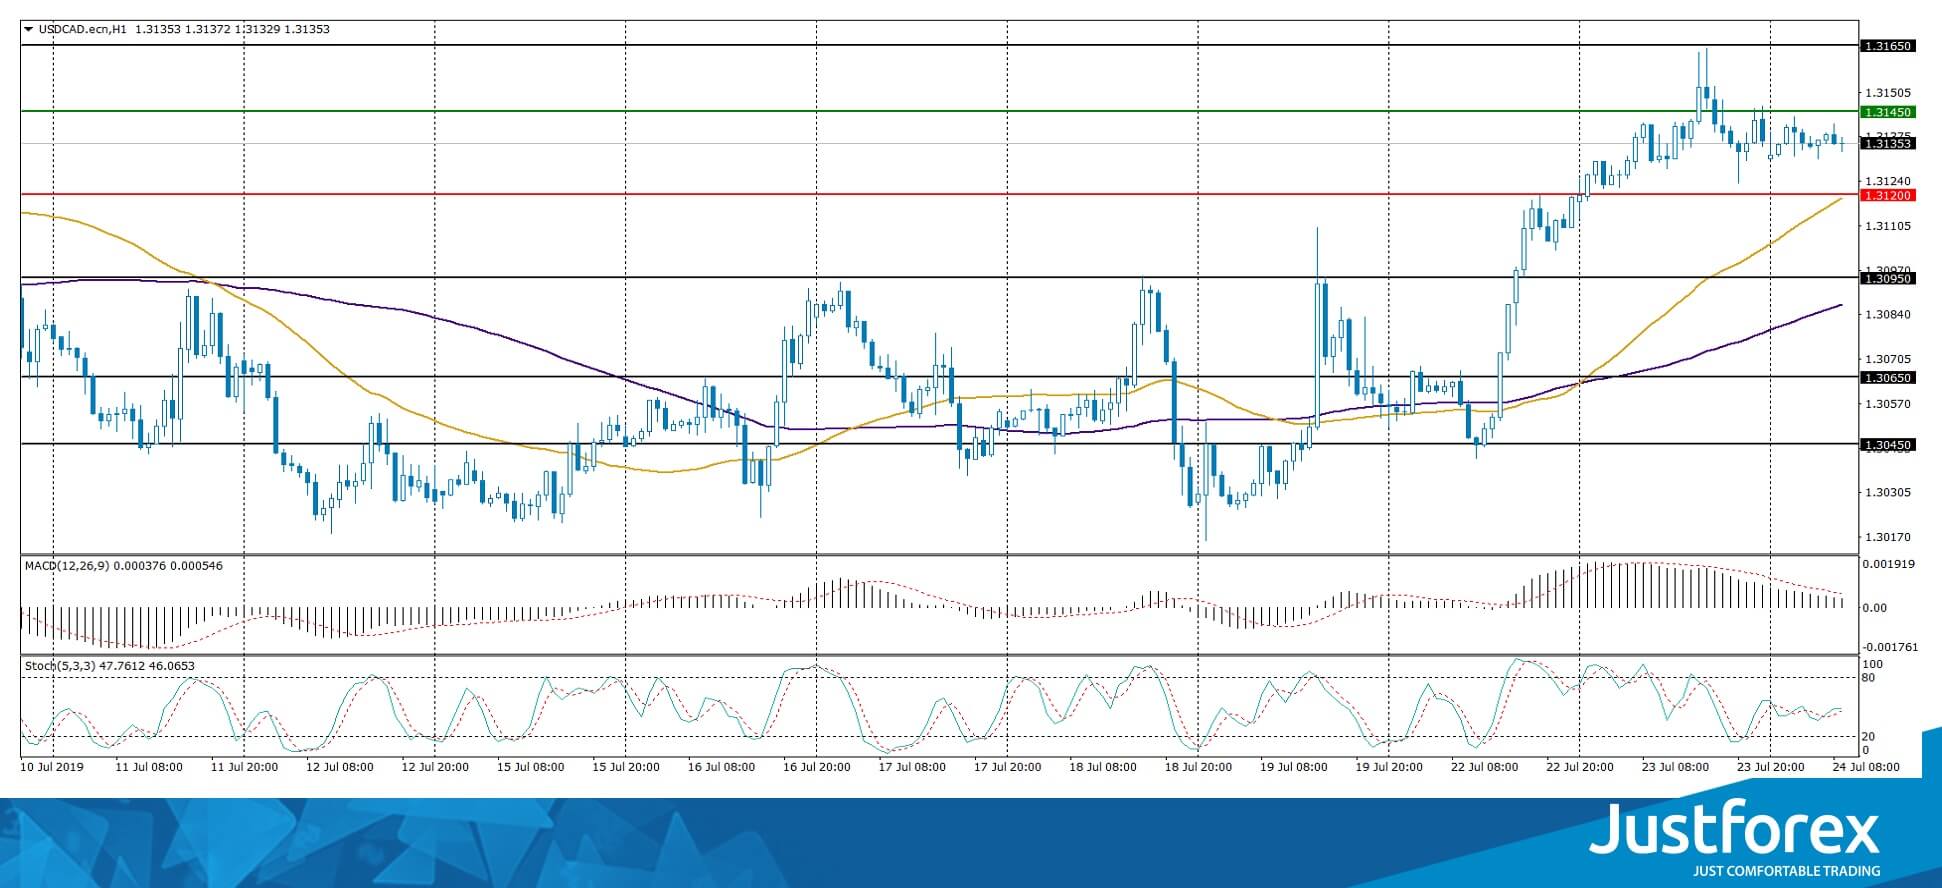
The price has fixed above 50 MA and 100 MA, which indicates the strength of buyers.
The MACD histogram is located in the positive zone, but below the signal line, which gives a weak signal to buy USD/CAD.
The Stochastic Oscillator is in the neutral zone, the %K line has started to cross the %D line. There are no signals at the moment.
Trading recommendations
Support levels: 1.31200, 1.30950, 1.30650
Resistance levels: 1.31450, 1.31650, 1.32000
If the price consolidates above the level of 1.31450, the quotes will grow toward to 1.31700-1.32000.
An alternative would be a correction of the USD/CAD quotes to 1.31000-1.30850.
The USD/JPY currency pair
Technical indicators of the currency pair:
Prev Open: 107.852
Open: 108.217
% chg. over the last day: +0.33
Day's range: 108.105 - 108.277
52 wk range: 104.97 - 114.56
A bullish sentiment still prevails on the USD/JPY currency pair. At the moment the trading instrument is consolidating. Key levels of support and resistance are 108.000 and 108.350. Financial market participants expect additional drivers. We recommend to pay attention to economic releases, as well as the dynamics of the US Treasury bonds yield. Positions must be opened from key levels.
The Economic News Feed for 24.07.2019 is calm.
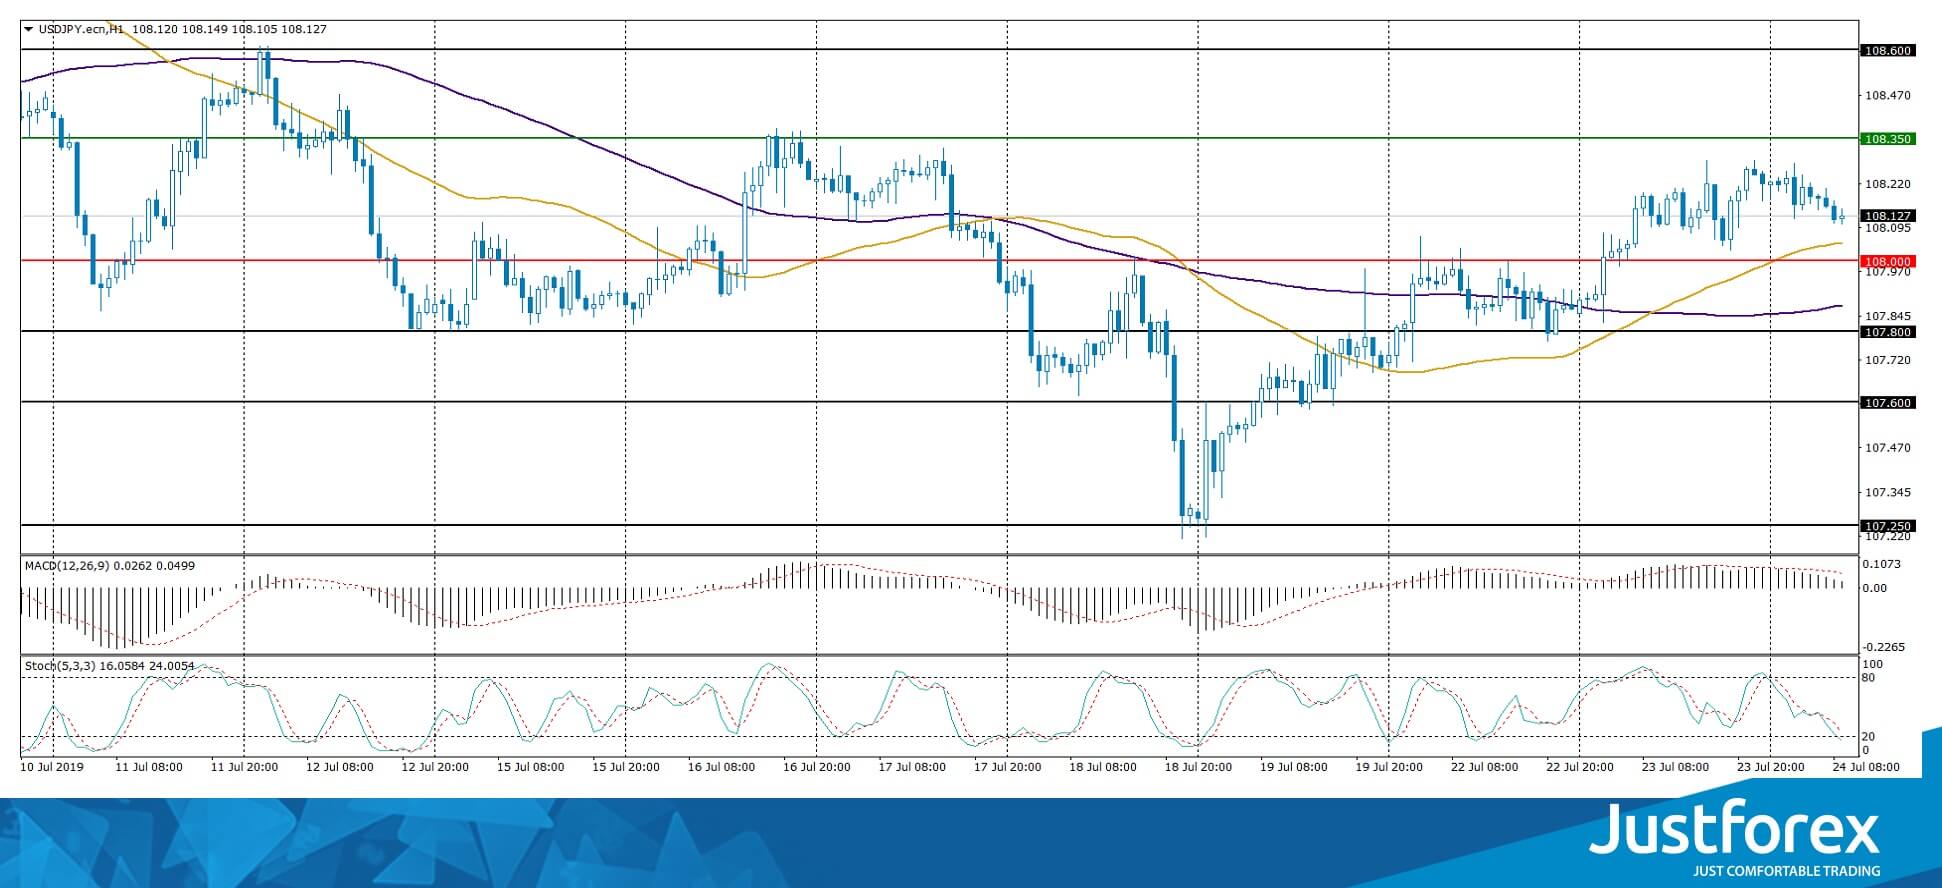
The price has fixed above 50 MA and 100 MA, which indicates the strength of buyers.
The MACD histogram is located in the positive zone, but below the signal line, which gives a weak signal to buy USD/JPY.
Stochastic Oscillator is in the neutral zone, the %K line is below the %D line, indicating a bearish mood.
Trading recommendations
Support levels: 108.000, 107.800, 107.600
Resistance levels: 108.350, 108.600
If the price consolidates above the 108.350 the price will rise toward 108.600-108.800.
Alternatively, the quotes can decline toward 107.800-107.600.
Forex Technical Analysis: EUR/USD, USD/JPY, GBP/USD
EUR/USD
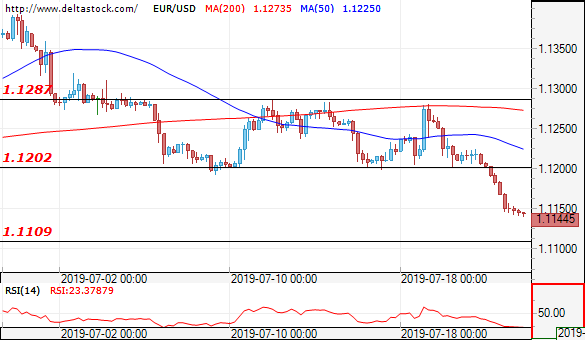
Current level - 1.1144
The successful breakthrough at 1.1200 was followed by a drop in the price towards next important support level at 1.1110. If the price momentum continues through 1.1100 it is possible to see a test of the 1.0900 zone.
| Resistance | Support | ||
| intraday | intraweek | intraday | intraweek |
| 1.1200 | 1.1280 | 1.1110 | 1.0930 |
| 1.1200 | 1.1350 | 1.1050 | 1.0850 |
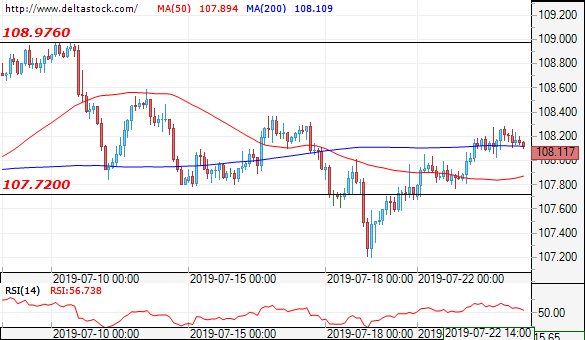
USD/JPY
Current level - 108.17
The outlook is still positive for a test of the resistance level at 109.00. In the opposite direction the key support level is at 106.80.
| Resistance | Support | ||
| intraday | intraweek | intraday | intraweek |
| 108.90 | 109.80 | 107.55 | 106.70 |
| 109.80 | 112.40 | 106.70 | 104.50 |
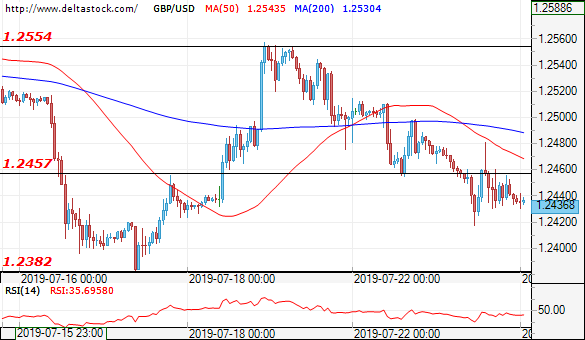
GBP/USD
Current level - 1.2436
The downward movement of the price after the breakthrough of the support zone at 1.2460 has not been confirmed, which might mean a new test of the resistance level at 1.2560. The key support lays at 1.2380.
| Resistance | Support | ||
| intraday | intraweek | intraday | intraweek |
| 1.2460 | 1.2660 | 1.2380 | 1.2320 |
| 1.2520 | 1.2890 | 1.2320 | 1.2110 |
Euro Area PMIs Disappoint, Dollar Powers Through Competition
- Euro area PMIs disappoint, raising bets for a dovish ECB tomorrow
- US dollar outperforms, without any major catalyst
- Euro/franc falls below 1.10 – will the SNB intervene soon?
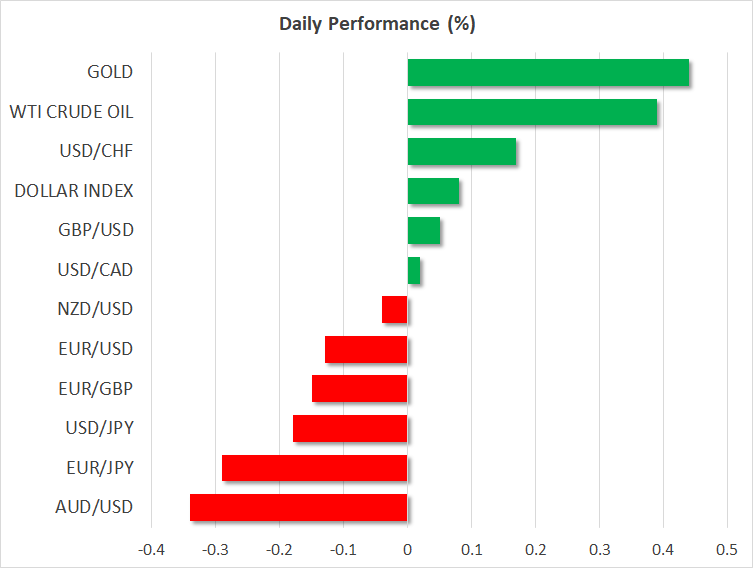
Euro slips as disappointing PMIs fuel ECB bets
Preliminary PMI data out of France and Germany for June have just been released, and were disappointing overall. While the service sector prints were more or less in line with forecasts, the manufacturing figures fell substantially, with the French print touching the neutral 50 level and the German one sinking deeper into contractionary waters. The German surveys even highlighted the risk of a ‘mild technical recession'.
The continued malaise in manufacturing amplifies the prospect that the ECB will act with force in the coming months and deliver an extensive stimulus package that includes more QE, to keep this weakness from infecting the so-far resilient services sector. Who knows, if the German economy weakens enough, the nation's government may even consider using part of its massive ‘war chest' to provide some fiscal stimulus.
The euro fell on the news, and the near-term risks remain tilted to the downside. Draghi has a talent for sinking the euro on ECB policy meetings, and tomorrow's gathering is unlikely to be an exception given the quality of these data and the elevated external risks.
‘King dollar' makes a comeback
The US dollar was at the epicenter of attention once more on Tuesday, powering through all other major currencies to touch a two-month high against the euro, even without any clear fundamental catalyst behind the surge. News that American negotiators will head to Shanghai next week for trade talks may have augmented the dollar's gains, by lifting US bond yields and stock markets – but did not trigger the move.
What's striking is that the implied probability for an aggressive 50bp Fed rate cut in July barely moved, staying static near 20%. Such a move still seems excessive, as it makes little sense for the Fed to use so much of the rate ammunition it fought so hard to accumulate in recent years, without the economy even being in trouble. The point is that more easing is priced in than the Fed is likely to deliver next week, which means the dollar may have more room to run higher for now – especially if Friday's GDP data are solid.
Euro/franc drops below 1.10 – is the SNB about to step in?
One of the themes that could grow into something much bigger soon, revolves around the Swiss franc and the extraordinary gains it has posted recently. Simmering trade tensions and fears of a global slowdown are clearly fueling demand for the safe-haven currency. More importantly though, major central banks have started to ease, narrowing Switzerland's rate differentials with the rest of the world and by extension making the franc more attractive.
And yet, Switzerland's infamous central bank has remained on the sidelines, intervening neither physically nor verbally in the FX market to weaken the franc, or at least slow down its appreciation. However, this is unlikely to continue. If the franc continues to gain, especially against the euro that may be weakened by ECB easing, the SNB will eventually have to step in. The real question is, what level in euro/franc policymakers will choose to ‘defend'. In this sense, any drop below the 1.07-1.08 area may be a headache for the Bank.
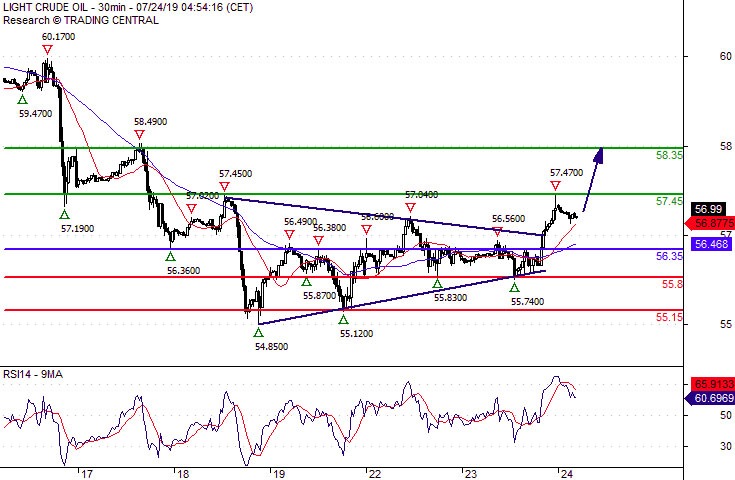
Crude Oil The Bias Remains Bullish
Pivot (invalidation): 56.35
Our preference Long positions above 56.35 with targets at 57.45 & 58.35 in extension.
Alternative scenario Below 56.35 look for further downside with 55.80 & 55.15 as targets.
Comment The RSI is mixed with a bullish bias.
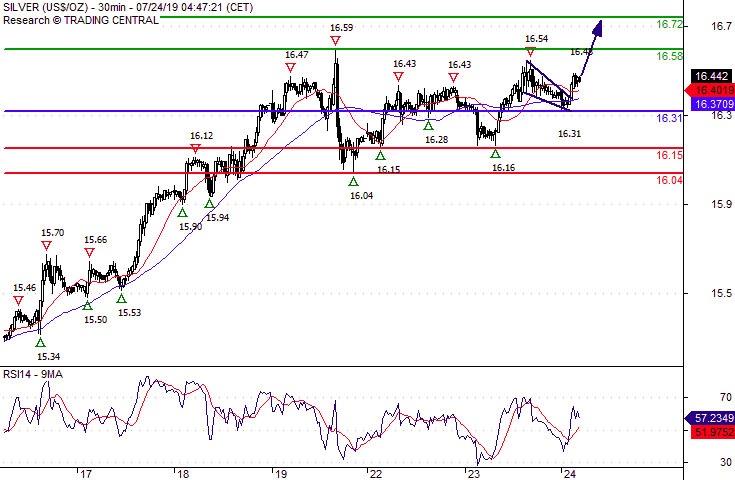
Silver Spot Further Upside
Pivot (invalidation): 16.3100
Our preference Long positions above 16.3100 with targets at 16.5800 & 16.7200 in extension.
Alternative scenario Below 16.3100 look for further downside with 16.1500 & 16.0400 as targets.
Comment The RSI is bullish and calls for further upside.
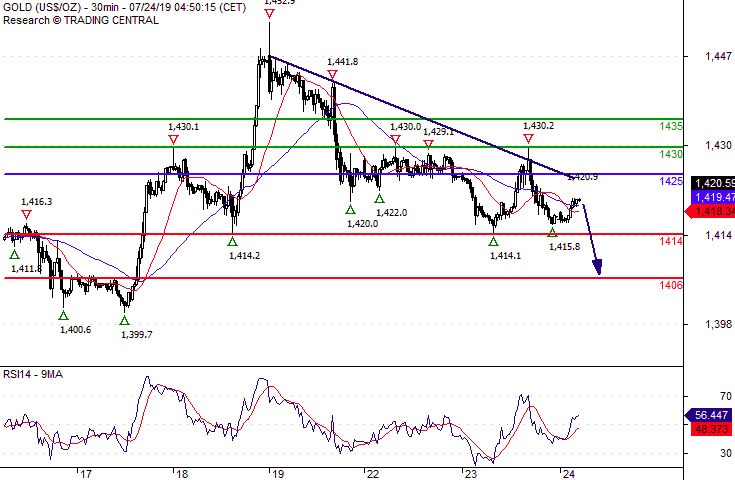
Gold Spot Capped By A Negative Trend Line
Pivot (invalidation): 1425.00
Our preference Short positions below 1425.00 with targets at 1414.00 & 1406.00 in extension.
Alternative scenario Above 1425.00 look for further upside with 1430.00 & 1435.00 as targets.
Comment A break below 1414.00 would trigger a drop towards 1406.00.
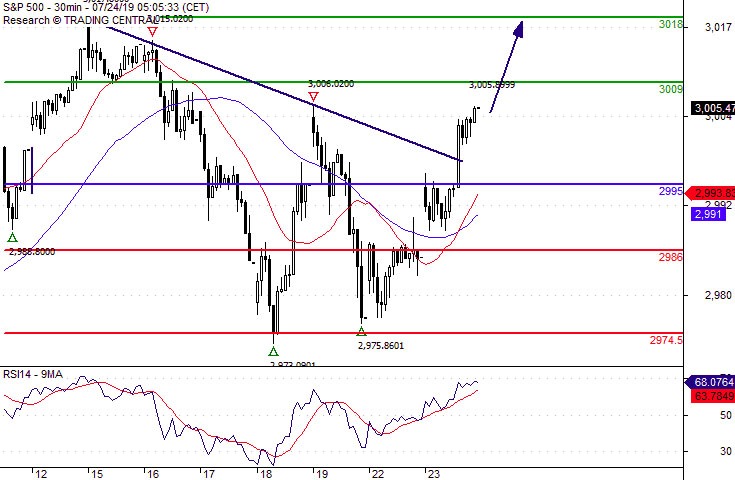
S&P 500 Further Advance
Pivot (invalidation): 2995.00
Our preference Long positions above 2995.00 with targets at 3009.00 & 3018.00 in extension.
Alternative scenario Below 2995.00 look for further downside with 2986.00 & 2974.50 as targets.
Comment The RSI shows upside momentum.
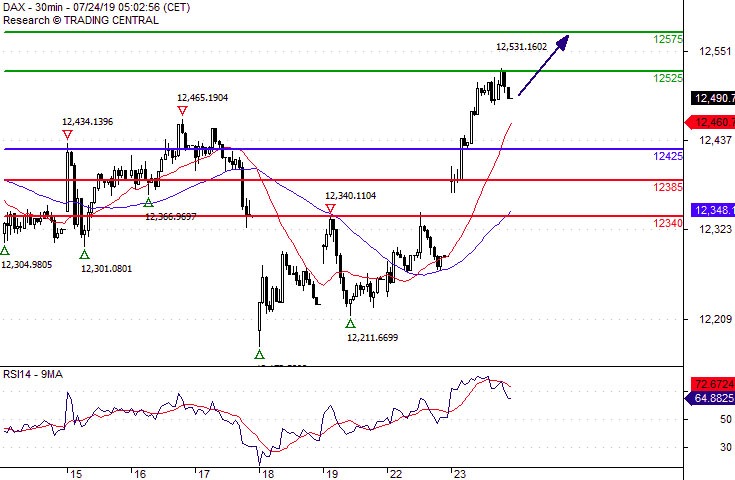
DAX Further Upside
Pivot (invalidation): 12425.00
Our preference Long positions above 12425.00 with targets at 12525.00 & 12575.00 in extension.
Alternative scenario Below 12425.00 look for further downside with 12385.00 & 12340.00 as targets.
Comment The RSI is bullish and calls for further advance.