Sample Category Title
SNB And Market Are At Collision Course
After a brief flirtation with 'normalization' global central banks are now decidedly dovish. Likely to re-embark on a global easing cycle, starting with FOMC July 31st meeting. While the Fed has been the most public reversal in policy stance the ECB & BoJ have also turned more dovish, as the inflation outlook remains weak and growth slows. Markets expect the ECB to follow the Fed in September with interest rate cuts and additional asset purchases. The market seems comfortable with this idea since Euro-dollar two-week implied volatility is below the past-year average, even after ECB meeting indicated that policymakers are ready to disclose economic stimulus. ECB could surprise markets by the magnitude or the timing of its potential easing measures but it's widely held that actions are coming.
This will likely drive the SNB, to become more dovish.
January 15th, 2015 the SNB suddenly declared that it would no longer maintain the minimum Swiss franc at a fixed exchange rate with the euro. This move was preemptive to avoid the expected CHF inflows from an ECB going negative.
While the macro environment is nowhere as sever today, conditions are similar. We have good visibility that the ECB will ease further, sparking a rotation of capital into Switzerland. Action becomes a bit blurry after that. The high probably play is that the SNB will take official interest rates more negative.
Following much-publicized comments, SNB President Jordon's view that interest rates can go deeper into negative territory. In the past, Jordon stated, 'If we come to the conclusion that it's necessary to fulfill our mandate, then, of course, we're ready to use our monetary policy instruments.'
Although the SNB is communicating a frictionless environment to policy setting we suspect things are more complicated. The central bank's massive balance sheet has become a concern and assuming more FX exposure (even converting into equities) is not a given. Remarkable failure of the SNB to intervene in any material size during the Italian crisis last year indicates that the SNB's capacity to intervene is inhibited. While negative interest rates are hurting, banks and savers while providing upward momentum to housing prices (highlighted in the statement).
At the start of the 2007-2008 financial crisis SNB reserves stood at a mild 15% of GDP. But after extreme easing cycle that including multiple direct FX intervention, negative interest rates FX and setting a hard minimal exchange rate against the Euro, reserves are at an unstable 120% of GDP. This suggest the SNB will accept more CHF appreciation.
With global monetary policy normalization reversing, and macro-economic risk increasing, CHF will remain in high demand. Historically, CHF has outpaced G10 FX during Fed easing cycle and recession. Despite the SNBs negative interest rate policy and threats physically intervene in currency markets, CHF is the king of economic safe-haven plays. Switzerland has the largest current account surplus as a percent of GDP in the majors. Swiss account surplus is 10% of GDP, significantly higher than JPY, the other pre-eminent FX safe-haven. This fact gives CHF a reputation of a credible recession, anti-cyclical hedge.
The stickiness of capital in Switzerland has been a real problem for the SNB. It's unlikely that with the global economy decelerating the key central banks poised to ease that the private sector will begin export capital. Clearly, SNB member should get some rest because autumn is looking to be eventful.
GBP/USD Outlook: Bulls Are Taking A Breather Under Key Barriers After 1% Advance
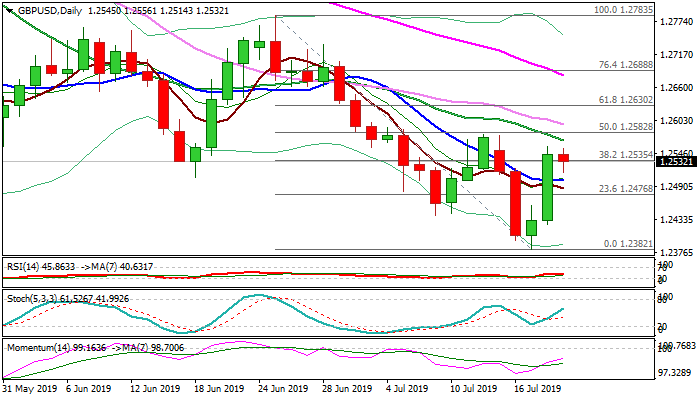
Cable is consolidating under new recovery high at 1.2558, posted after Thursday’s nearly 1% advance (the biggest one-day rally since 3 May).
Upbeat UK retail sales inflated pound with further acceleration higher being sparked by dovish Fed view that sent dollar lower.
Fresh bulls face headwinds from strong barriers at 1.2569 (falling 20DMA) and 1.2579 (12 July high), with risk of pullback seen on south-turning indicators on 4-hr chart.
Momentum on daily chart is rising, but still holding in the negative territory that keeps in play risk of recovery stall.
Unless we see clear break above 1.2569/79 pivots that would sideline bulls for stronger correction of 1.2783/1.2382 down leg, the downside will remain vulnerable.
Close below 10DMA (1.2500) to generate fresh bearish signal and shift near-term focus lower.
Overall negative picture with bearish sentiment on rising fears of no-deal Brexit, support scenario.
Caution on potential second Hammer on weekly chart that would signal bears might stay on hold for stronger recovery.
Res: 1.2558, 1.2569, 1.2579, 1.2597
Sup: 1.2514, 1.2500, 1.2439, 1.2425
GBP/CAD Super-Dot Confirmed Counter Trend Move
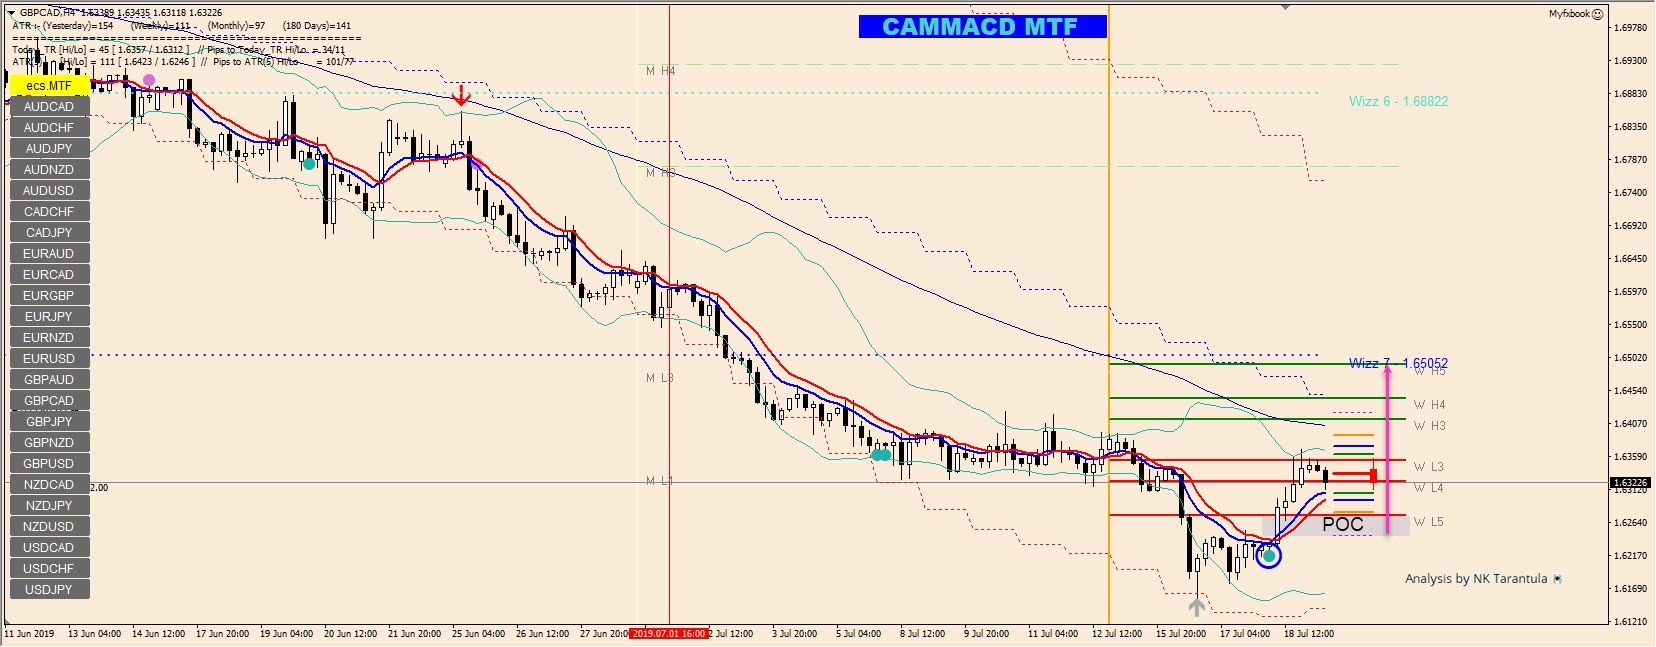
As you can see from the chart, the super-dot marked good buying opportunities in the GBP/CAD pair due to extreme oversold levels.
The POC zone 1.6200-10 has provided bulls with a fresh buying opportunities due to oversold + profit taking which happened when the price touched the HTF Bollinger band. Counter trend move aims for 1.6420 if 1.6360 breaks and eventually 1.6505 on a positive bullish momentum next week. At this point going counter trend is the valid option due to extreme oversold which has been confirmed by the super-dot.
Forex Technical Analysis: EUR/USD, USD/JPY, GBP/USD
EUR/USD
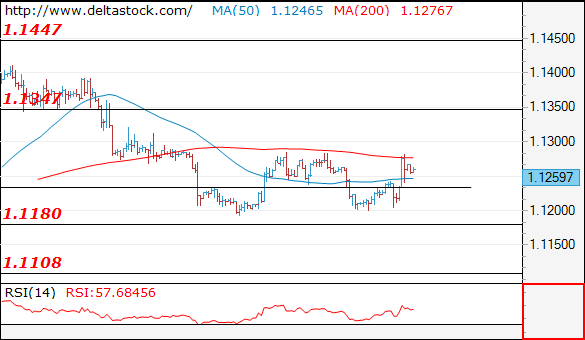
Current level - 1.1259
The pair reached the upper boundary of the trading range between 1.1180 and 1.1280 and a violation of the mentioned hurdle will challenge 1.1450 zone.
| Resistance | Support | ||
| intraday | intraweek | intraday | intraweek |
| 1.1285 | 1.1570 | 1.1180 | 1.1110 |
| 1.1350 | 1.1820 | 1.1110 | 1.1010 |
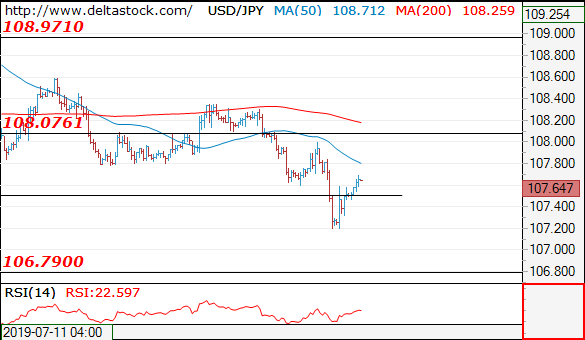
USD/JPY
Current level - 107.64
The pattern after 107.20 low is corrective in structure, but a return below 107.30 is needed in order to confirm a continuation towards 106.80. Key resistance lies at 108.00.
| Resistance | Support | ||
| intraday | intraweek | intraday | intraweek |
| 108.10 | 109.80 | 107.30 | 106.70 |
| 108.90 | 112.40 | 106.70 | 104.50 |
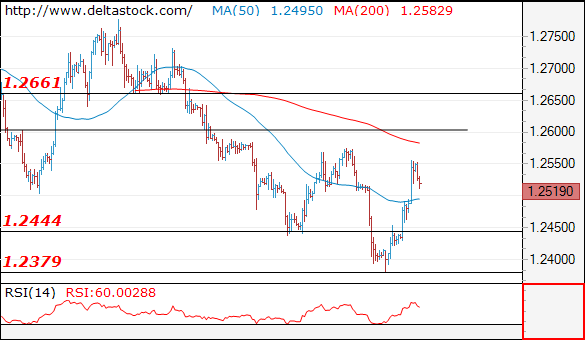
GBP/USD
Current level - 1.2519
The rebound after 1.2380 low managed to surpass 1.2500 hurdle and the bias is positive, for a break through the crucial 1.2580, towards 1.2800 major resistance.
| Resistance | Support | ||
| intraday | intraweek | intraday | intraweek |
| 1.2580 | 1.2800 | 1.2500 | 1.2380 |
| 1.2660 | 1.2890 | 1.2380 | 1.2110 |
EUR/USD Outlook: Bullish Bias Above Daily Cloud But Key Barriers Still Cap
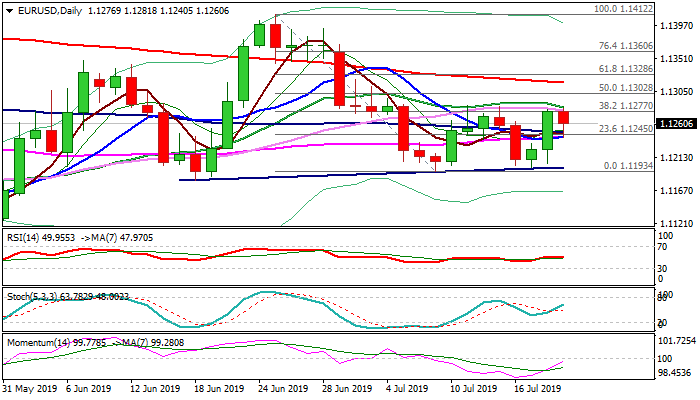
The Euro stays bid and holding under session high at 1.1281 in early European trading after overnight's dip was contained by converged 10/55 DMA's/daily cloud top (1.1242).
The single currency rallied strongly in late Thursday on dovish comments from NY Fed President Williams, which markets understood as signals for more aggressive rate cut, but subsequently eased after Fed officials toned down the comments.
Near-term bias remains with bulls as fresh strength touched again strong barriers at 1.1280 zone and action being supported by rising daily momentum and underpinned by thickening daily cloud.
Firm break above 1.1280 zone (tops of 11/15 July/converged 30/20DMA's) would signal extension of bounce from double-bottom at 1.1200 zone towards psychological 1.1300 barrier (also 50% retracement of 1.1412/1.1193) and 200DMA (1.1318).
On the other side, weaker than expected German PPI data softened near-term tone, keeping in play risk of repeated rejection at 1.1280 zone pivots. Bearish scenario requires return and close below daily cloud (1.1227/42) to re-focus key supports at 1.1200/1.1180 zone.
Res: 1.1277, 1.1285, 1.1300, 1.1318
Sup: 1.1248, 1.1242, 1.1227, 1.1200
Gold Stays Firm, Rises To A Fresh 6-Year High
The precious metal held steady on Thursday and is likely to post another week near the six-year highs. Gold prices gained despite some strong regional manufacturing data. The Philly Fed manufacturing index rebounded in July from a 4-month low. The data gave renewed optimism that the US economy could remain on the growth track.
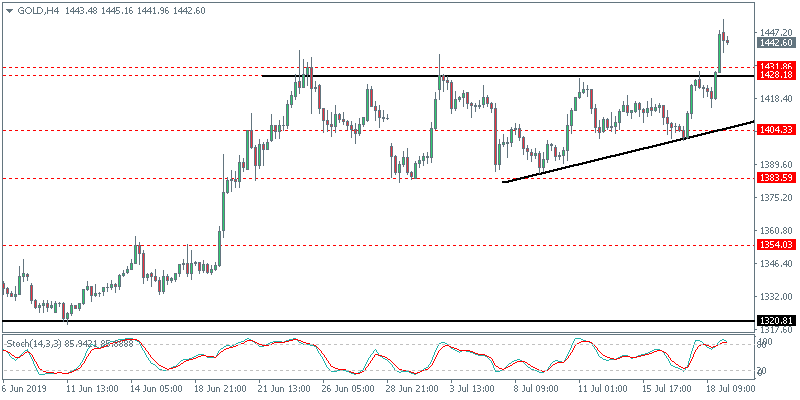
XAUUSD Consolidating into an Ascending Triangle Pattern
The precious metal is consolidating into the ascending triangle pattern. Price action is testing the resistance level of 1431 – 1428 region. A breakout above this level confirms further upside in gold. However, unless there is a strong breakout higher, it is unlikely that the breakout can be sustained.
Crude Oil Continues Its Descent
Oil prices continued to decline sharply on Thursday. The earlier gains in crude oil prices were erased as the commodity slipped to the lowest level in a month. Crude oil prices attempted to bounce higher earlier in the day. This came after news reports that Iran seized a foreign oil tanker. But the declines soon resumed in the back of the EIA’s inventory report on Wednesday.
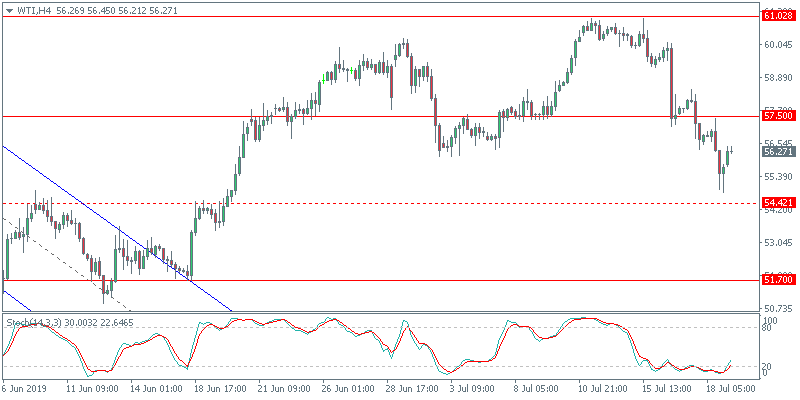
WTI Crude Oil to Test Short Term Support
The current declines in crude oil prices are likely to push the commodity to establish the support area near the 54.42 level. This is a minor support area that will be tested. If the support fails to hold the declines, oil prices could be potentially aiming for the 51.70 level of support below.
Euro Looks To German PPI & Current Account
The euro currency traded flat on Thursday ahead of next week's key ECB monetary policy meeting. Moving forward, the German PPI will be in focus. Producer prices in Germany are forecast to decline by 0.1% on the month. This comes after recent inflation data showed a rebound albeit still far away from the ECB inflation target rate. The current account data is also due later this morning.
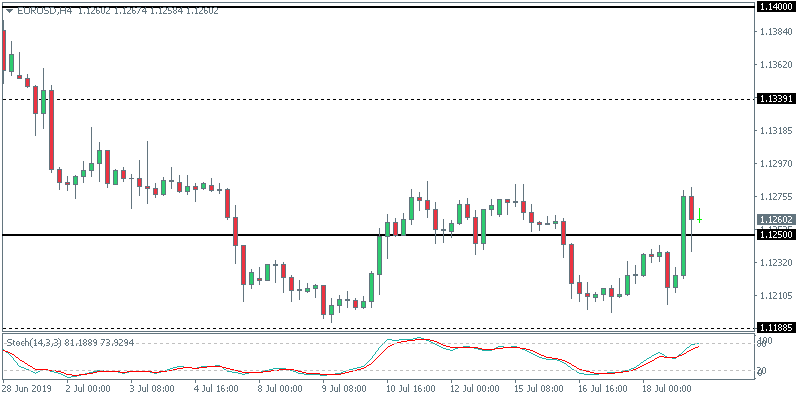
EURUSD Likely to Close Flat
The currency pair is expected to remain in a holding pattern ahead of next week's ECB meeting. From a technical perspective, price action remains firmly entrenched within the 1.1250 – 1.1188 levels. A breakout from this range could see further short term gains or declines. But this could also be limited in scope. Unless there is a strong fundamental catalyst, it is unlikely to expect further strength in the currency pair.
Strait Of Hormuz And Crude Oil Recovery
Oil broke it four consecutive days of losses on the back of the news that an American warship down an Iranian drone near the Strait of Hormuz yesterday. President Trump said on Thursday that the US “immediately destroyed” the drown which was only a few thousand yards away. This created a major panic among traders because of disruption of oil supply in the Middle East.
Strait of Hormuz is a critical area because it can choke the oil flow and Iran has the capability to close this as it controls this area. However, Iranian foreign minister, Mohammed Javad Zarif has said that the country has no such intentions because he believe this as there lifeline. Iran plays a critical role in securing this Strait of Hormuz and nearly one third of the world’s seaborne crude passed this area last year. Nearly six tankers were attacked during the last two months and the US has blamed Iran for this.
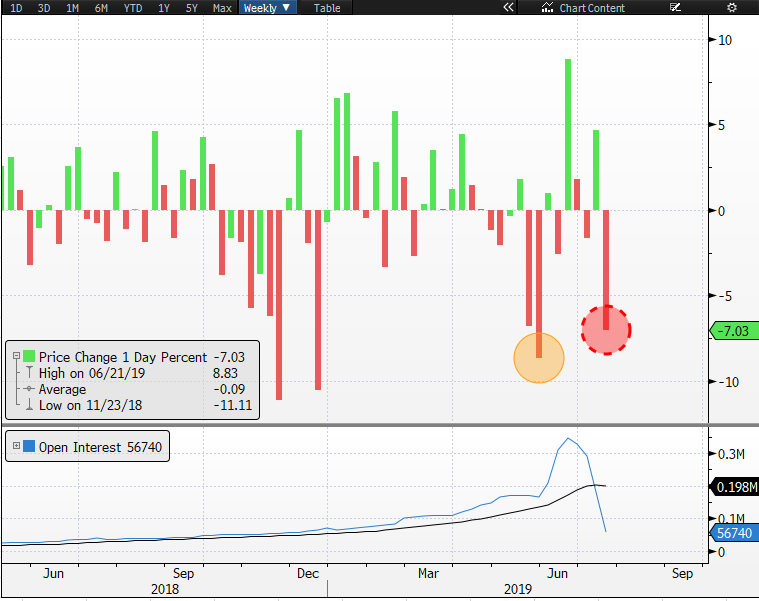
Oil is up 0.83 percent today and trying to recover its steepest weekly decline (down nearly 7%- something which is not witnessed since May), it is still set to close the week lower. However, WTI is up 17.21 percent year-to-date and Brent has soared 14.26 percent YTD. The below chart shows the weekly percentage loss for WTI.
Looking at the speculative market, it is evidently clear the hedge funds are no longer interested in opening any new long oil positions. The chart below shows that the net short and long WTI positions by hedge funds. It is important to keep in mind at this data is as of July 7, so the recent situation isn't clearly reflected in this data, but one cannot ignore the fact that long speculative positions on oil have fallen to their lowest level since 2013. 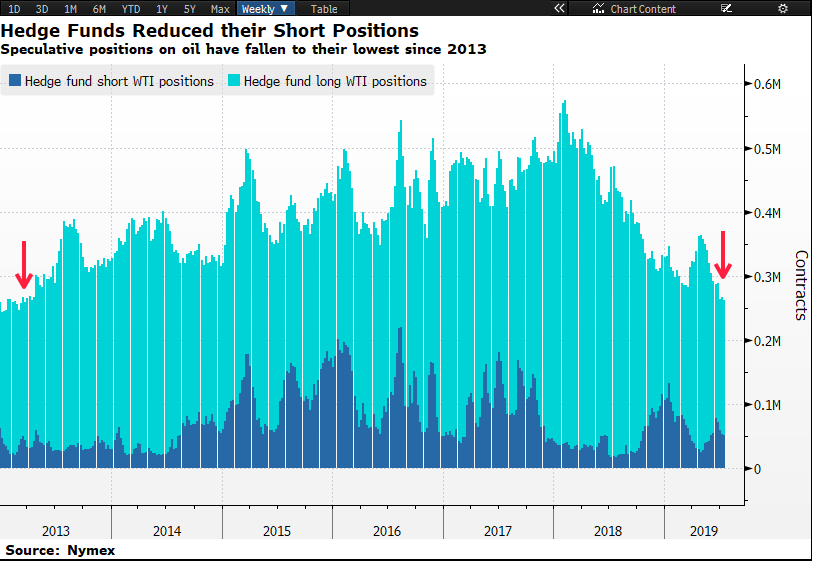
To conclude, the bearish grip is still too strong and there is too much pressure on oil producers to keep the supply in check and the demand equation isn’t showing any sign of recovery due the ongoing trade war between the US and China. I believe that the current mean reversion trade may not last for long unless of course, the geopolitical tensions in the Middle East shifts its gear or by any miracle, Donald Trump makes peace with China.
The near term support for WTI is near $50 (for now) and a break of this may open the door for the price to move towards a major support area of $45. The near term resistance is at $62 followed by the level of $65.
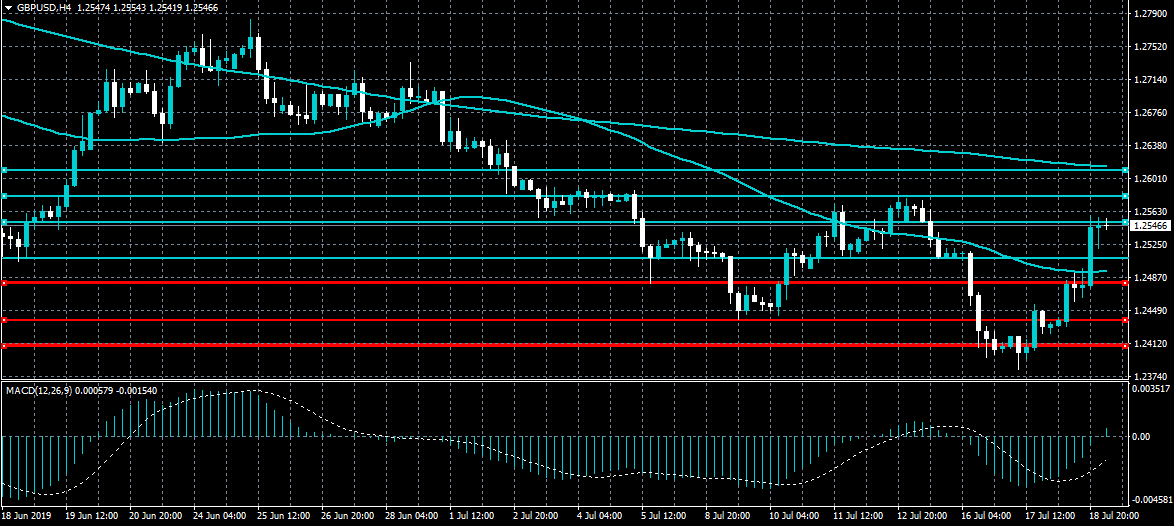
GBPUSD Watching 1.2550
The British pound continues to enjoy fresh buying interest against the US dollar as bulls hold price above the pivotal 1.2530 level. Further intraday gains above the 1.2550 level could propel the GBPUSD pair towards the 1.2610 resistance area. The GBPUSD pair will post a huge bullish weekly reversal candle if the daily candle closes above the former weekly open, at 1.2551.
The GBPUSD pair is bullish while trading above the 1.2530 level, key resistance is located at the 1.2580 and 1.2610 levels.
If the GBPUSD pair trades below the 1.2530 level, key support is found at the 1.2510 and 1.2480 levels.